


Issue Areas
The Washington Center for Equitable Growth is engaged in an array of issues to advance evidence-based ideas and policies that promote strong, stable, and broad-based economic growth.

242 Results

 View Chart
(opens in a new tab)
View Chart
(opens in a new tab)
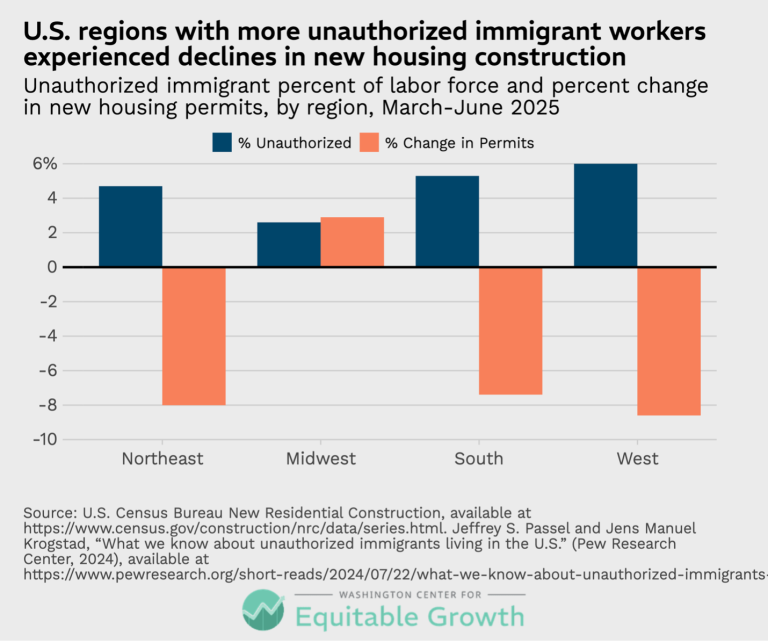
U.S. regions with more unauthorized immigrant workers experienced declines in new housing construction (opens in a new tab)
Visualizations Aug 31, 2026
 View Chart
(opens in a new tab)
View Chart
(opens in a new tab)
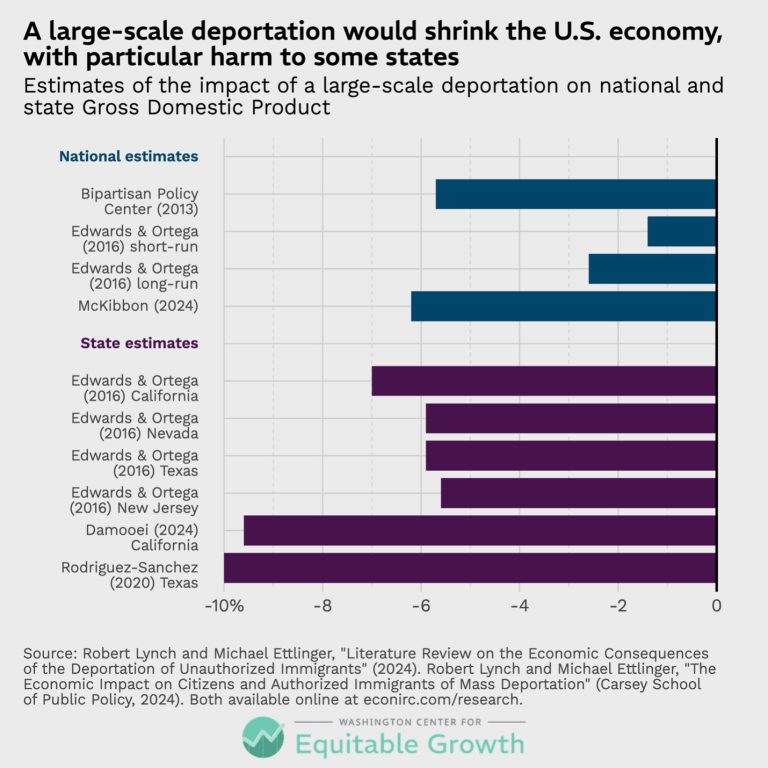
A large-scale deportation would shrink the U.S. economy, with particular harm to some states (opens in a new tab)
Visualizations Aug 31, 2026
 View Chart
(opens in a new tab)
View Chart
(opens in a new tab)
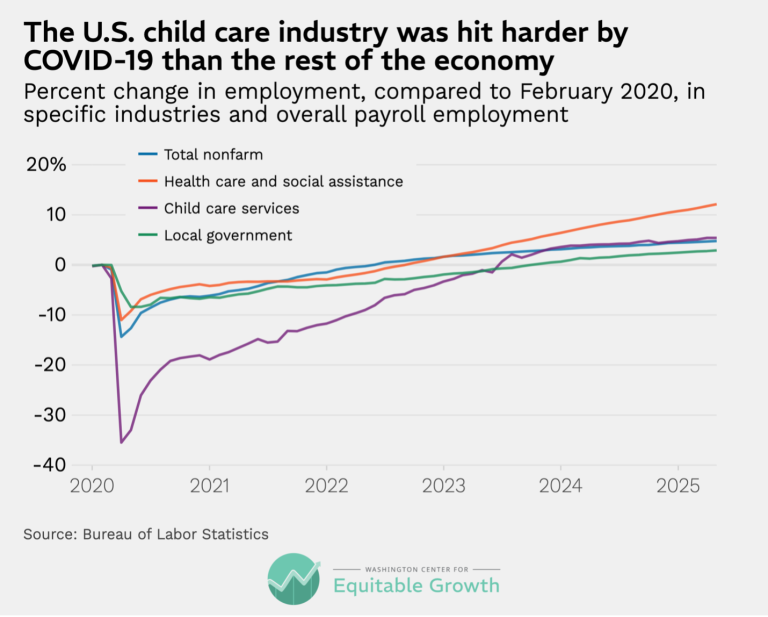
The U.S. child care industry was hit harder by COVID-19 than the rest of the economy (opens in a new tab)
Visualizations Apr 15, 2026
 View Chart
(opens in a new tab)
View Chart
(opens in a new tab)
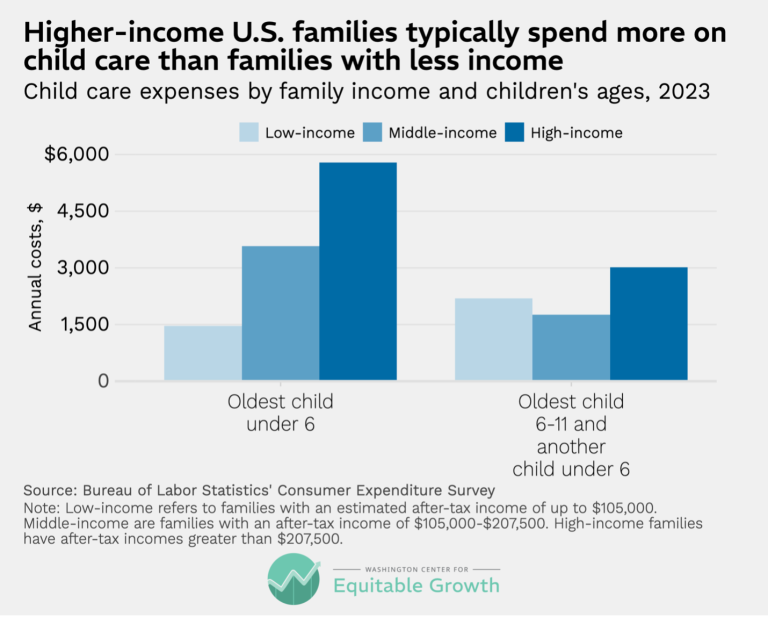
Higher-income U.S. families typically spend more on child care than families with less income (opens in a new tab)
Visualizations Apr 15, 2026
 View Chart
(opens in a new tab)
View Chart
(opens in a new tab)
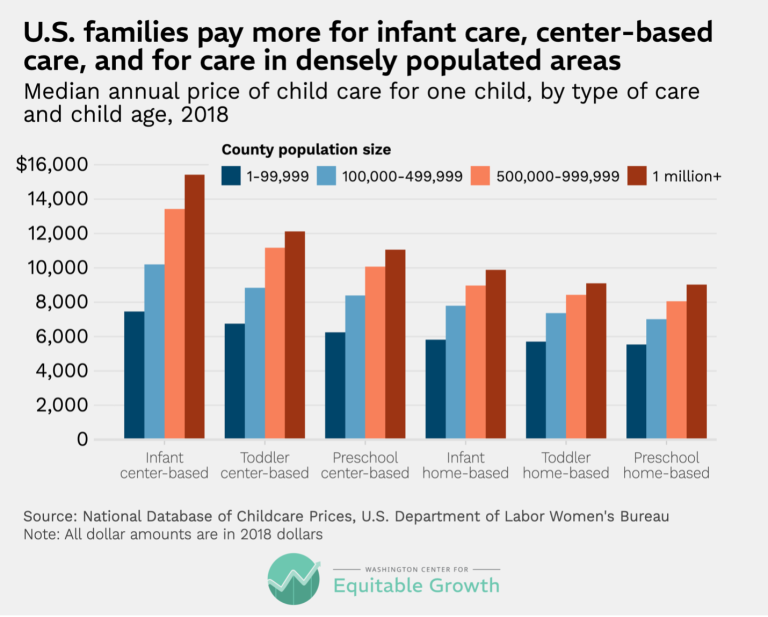
U.S. families pay more for infant care, center-based care, and for care in densely populated areas (opens in a new tab)
Visualizations Apr 15, 2026
 View Chart
(opens in a new tab)
View Chart
(opens in a new tab)
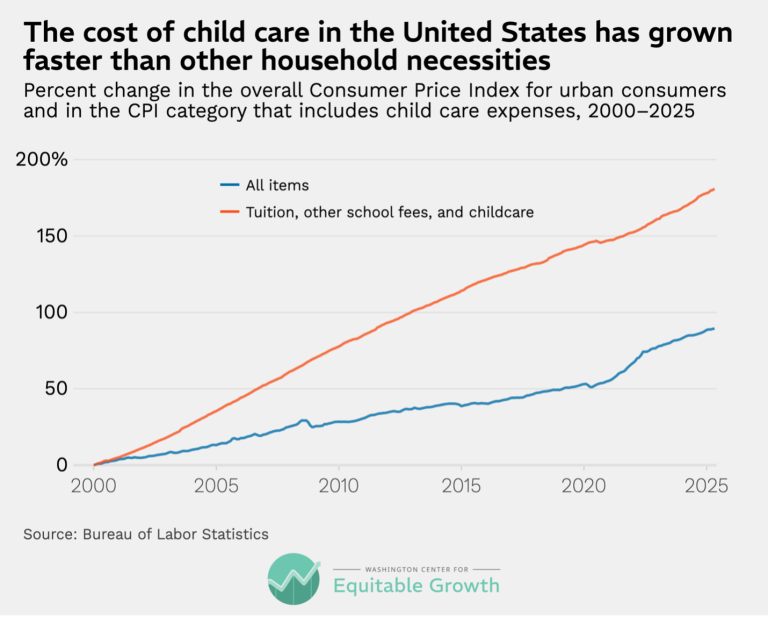
The cost of child care in the United States has grown faster than other household necessities (opens in a new tab)
Visualizations Apr 15, 2026
 View Chart
(opens in a new tab)
View Chart
(opens in a new tab)
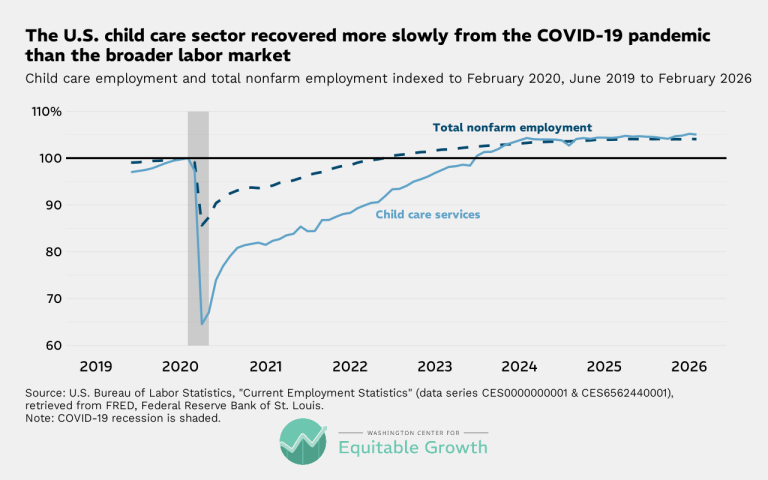
The U.S. child care sector recovered more slowly from the COVID-19 pandemic than the broader labor market (opens in a new tab)
Visualizations Apr 8, 2026
 View Chart
(opens in a new tab)
View Chart
(opens in a new tab)
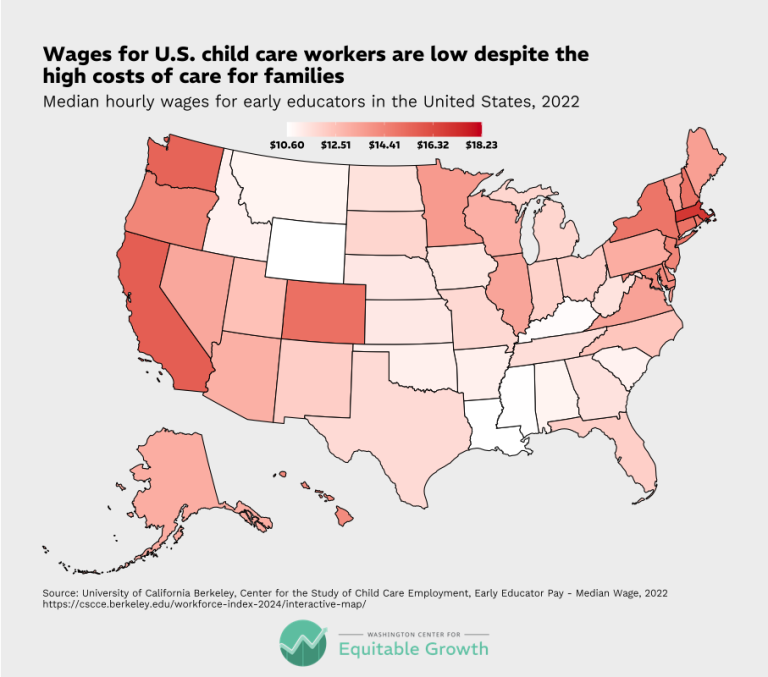
Wages for U.S. child care workers are low despite the high costs of care for families (opens in a new tab)
Visualizations Apr 8, 2026
 View Chart
(opens in a new tab)
View Chart
(opens in a new tab)
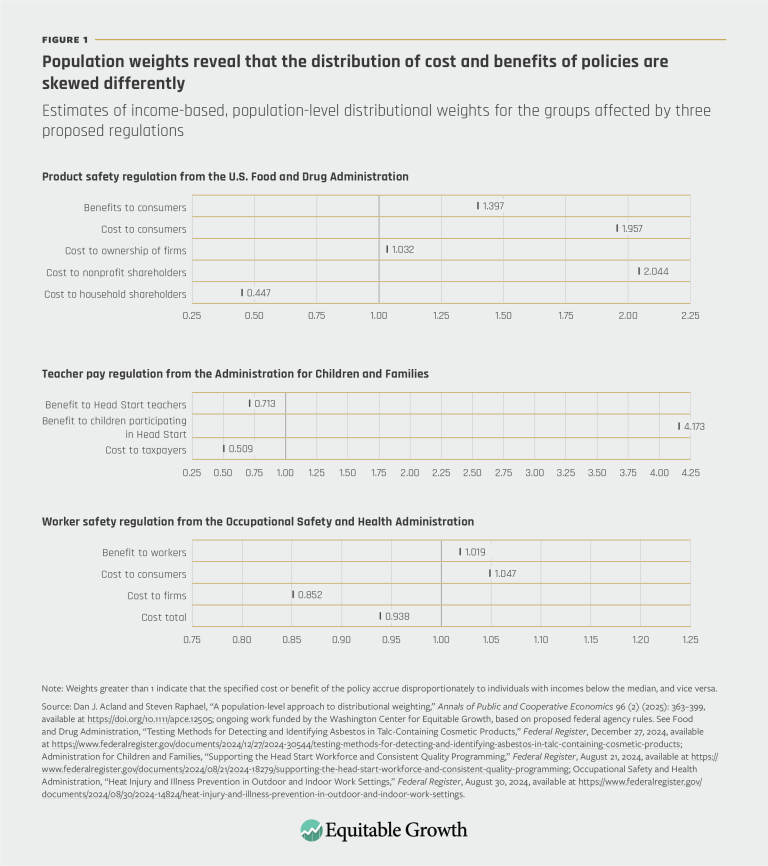
Population weights reveal that the distribution of cost and benefits of policies are skewed differently (opens in a new tab)
Visualizations Nov 13, 2025
 View Chart
(opens in a new tab)
View Chart
(opens in a new tab)
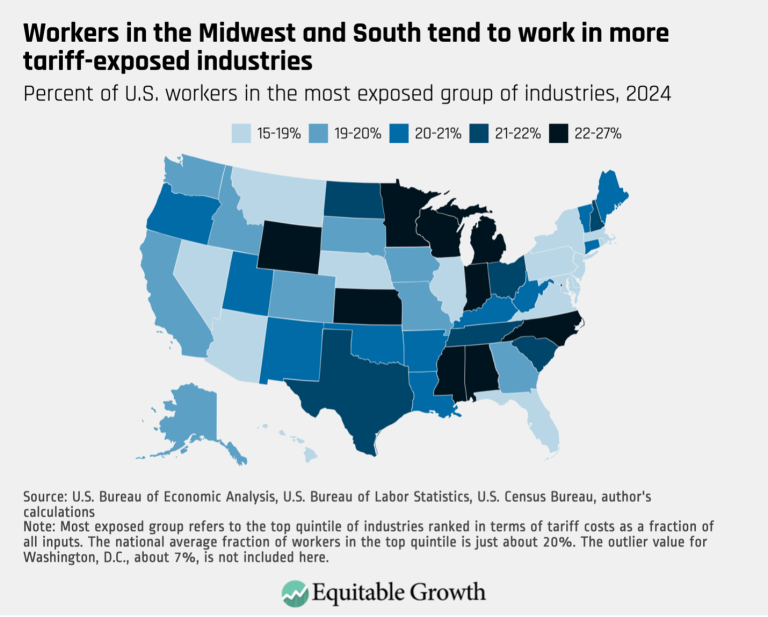
Workers in the Midwest and South tend to work in more tariff-exposed industries (opens in a new tab)
Visualizations Nov 3, 2025
 View Chart
(opens in a new tab)
View Chart
(opens in a new tab)
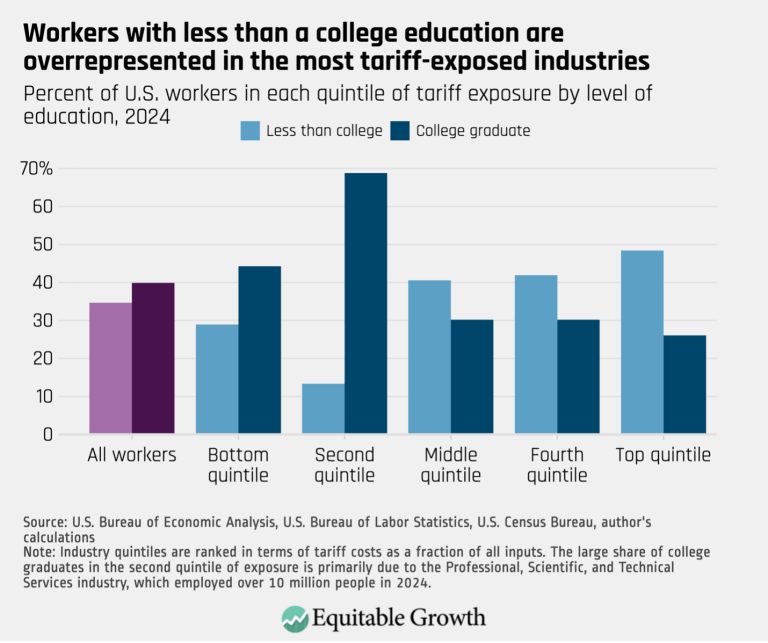
Workers with less than a college education are overrepresented in the most tariff-exposed industries (opens in a new tab)
Visualizations Nov 3, 2025
 View Chart
(opens in a new tab)
View Chart
(opens in a new tab)
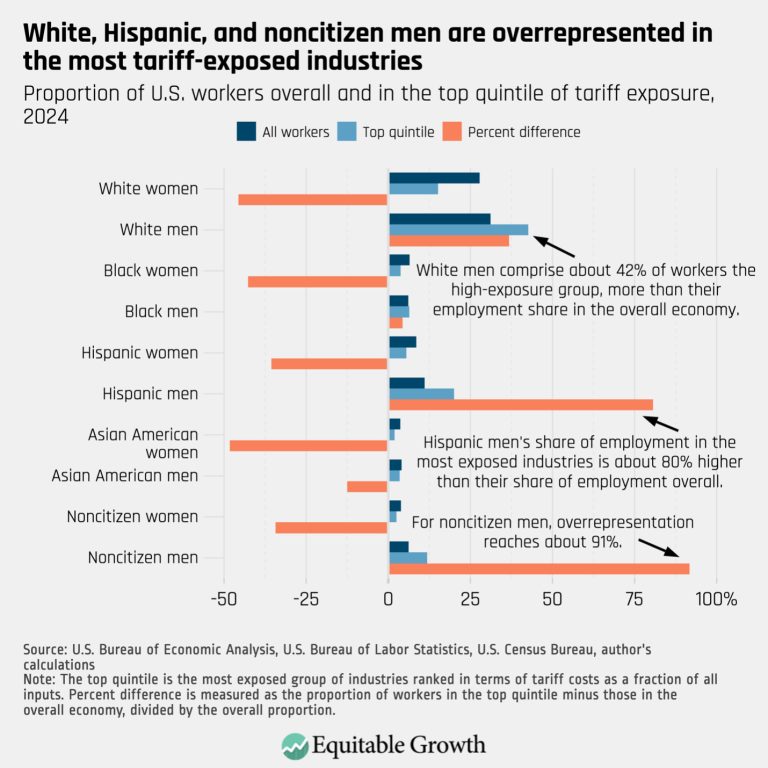
White, Hispanic, and noncitizen men are overrepresented in the most tariff-exposed industries (opens in a new tab)
Visualizations Nov 3, 2025
 View Chart
(opens in a new tab)
View Chart
(opens in a new tab)
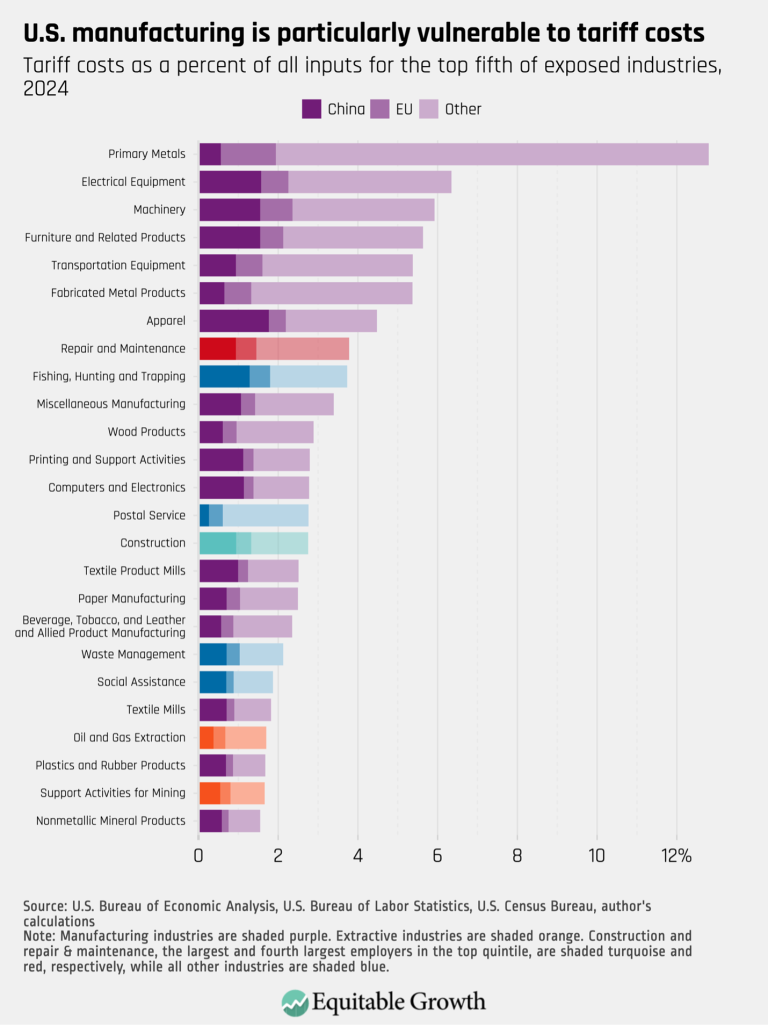
U.S. manufacturing is particularly vulnerable to tariff costs (opens in a new tab)
Visualizations Nov 3, 2025
 View Chart
(opens in a new tab)
View Chart
(opens in a new tab)
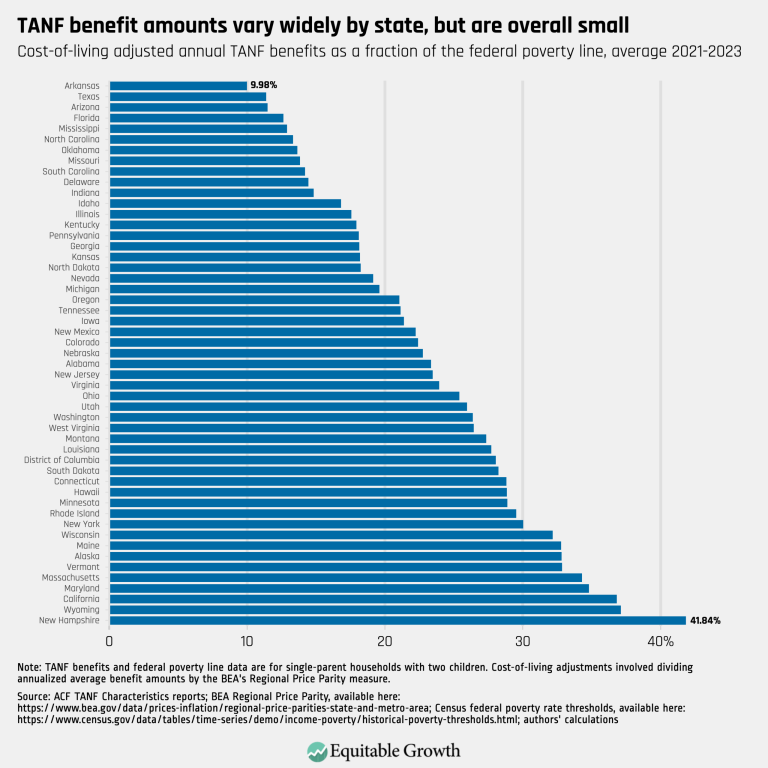
TANF benefit amounts vary widely by state, but are overall small – updated (opens in a new tab)
Visualizations Aug 26, 2025
 View Chart
(opens in a new tab)
View Chart
(opens in a new tab)
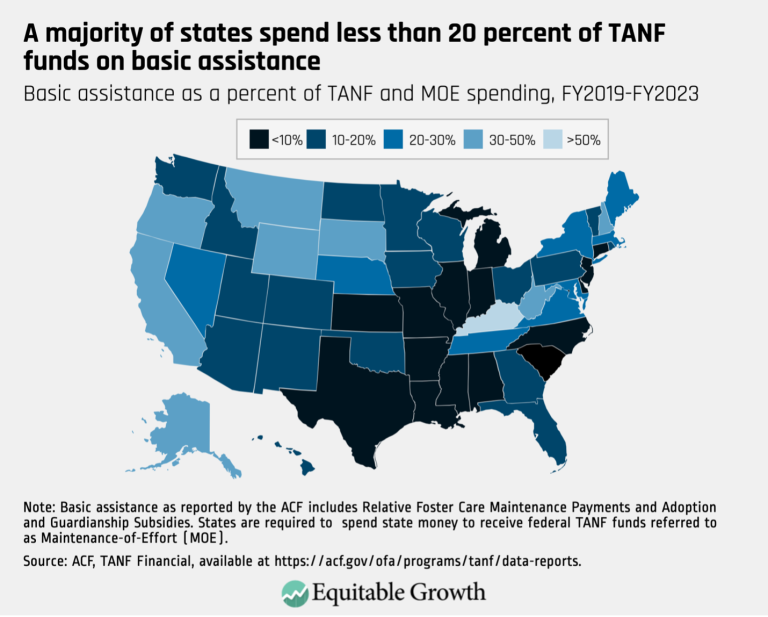
A majority of states spend less than 20 percent of TANF funds on basic assistance (opens in a new tab)
Visualizations Aug 26, 2025
 View Chart
(opens in a new tab)
View Chart
(opens in a new tab)
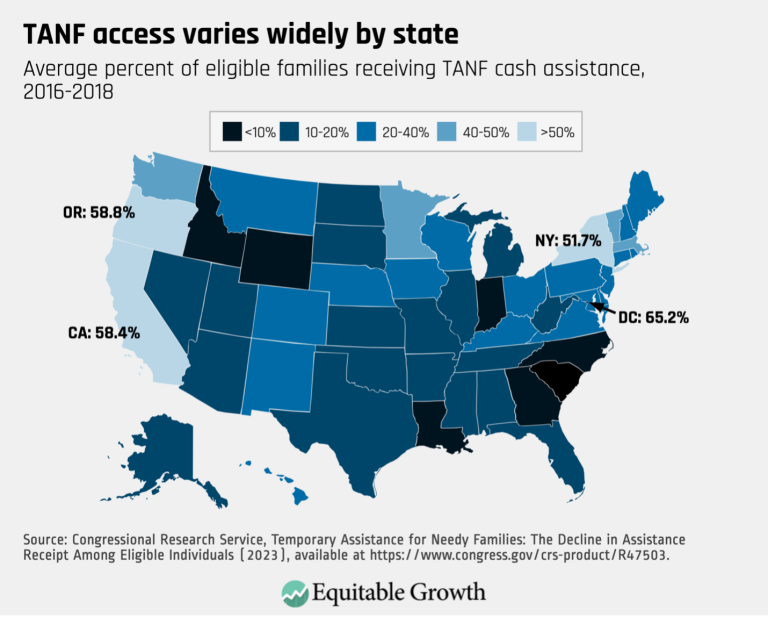
TANF access varies widely by state (opens in a new tab)
Visualizations Aug 26, 2025
 View Chart
(opens in a new tab)
View Chart
(opens in a new tab)
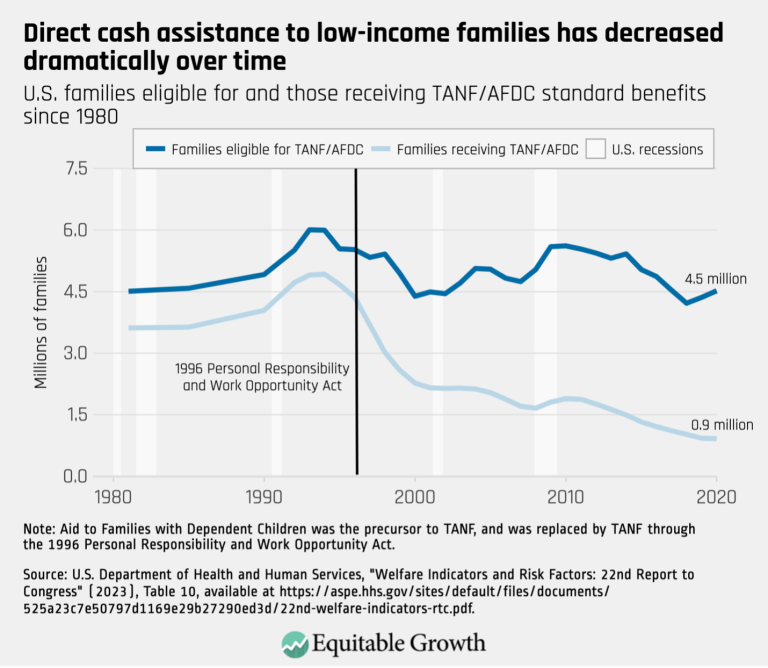
Direct cash assistance to low-income families has decreased dramatically over time (opens in a new tab)
Visualizations Aug 26, 2025
 View Chart
(opens in a new tab)
View Chart
(opens in a new tab)
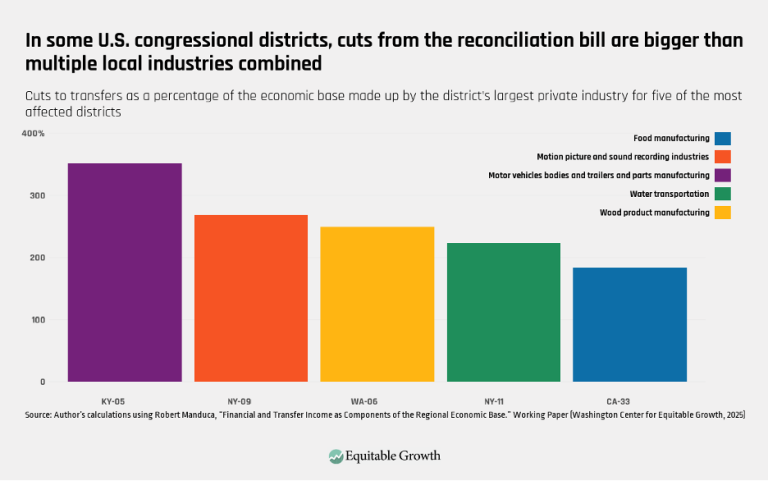
In some U.S. congressional districts, cuts from the reconciliation bill are bigger than multiple local industries combined (opens in a new tab)
Visualizations Jul 10, 2025
 View Chart
(opens in a new tab)
View Chart
(opens in a new tab)
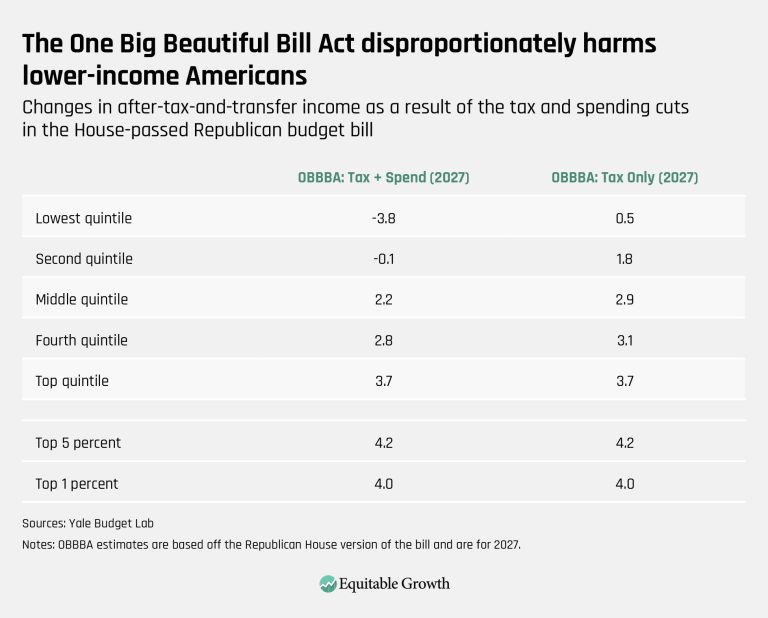
The One Big Beautiful Bill Act disproportionately harms lower-income Americans (opens in a new tab)
Visualizations Jul 3, 2025
 View Chart
(opens in a new tab)
View Chart
(opens in a new tab)
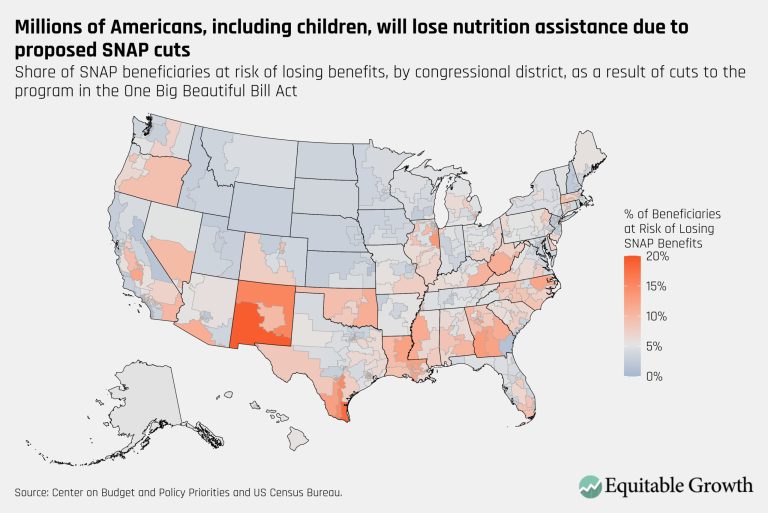
Millions of Americans, including children, will lose nutrition assistance due to proposed SNAP cuts – updated (opens in a new tab)
Visualizations Jun 24, 2025
 View Chart
(opens in a new tab)
View Chart
(opens in a new tab)
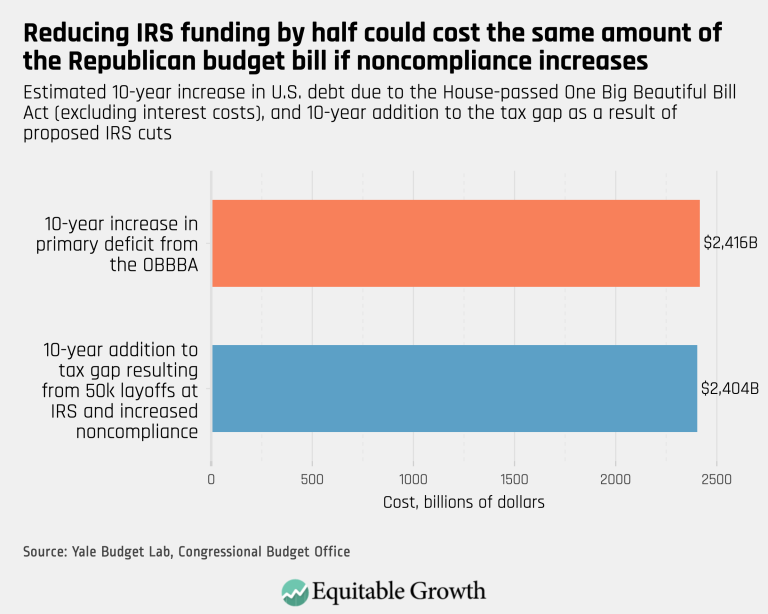
Reducing IRS funding by half could cost the same amount of the Republican budget bill in noncompliance increases (opens in a new tab)
Visualizations Jun 23, 2025
 View Chart
(opens in a new tab)
View Chart
(opens in a new tab)
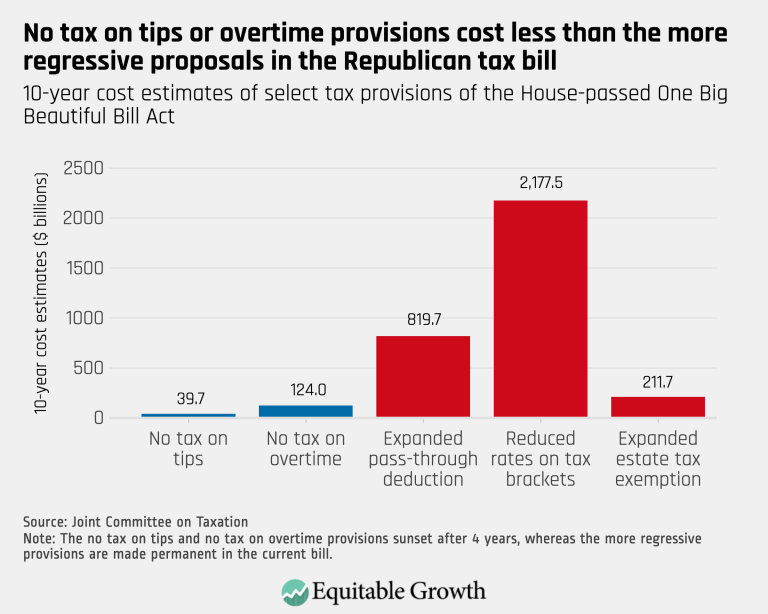
No tax on tips or overtime provisions cost less than the more regressive proposals in the Republican tax bill (opens in a new tab)
Visualizations Jun 23, 2025
 View Chart
(opens in a new tab)
View Chart
(opens in a new tab)
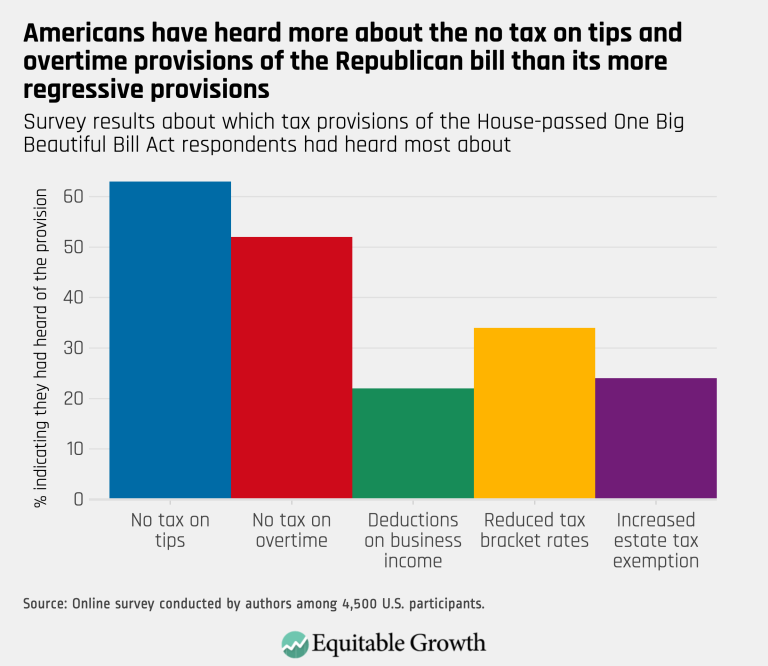
Americans have heard more about the no tax on tips and overtime provisions of the Republican bill than its more regressive provisions (opens in a new tab)
Visualizations Jun 23, 2025
 View Chart
(opens in a new tab)
View Chart
(opens in a new tab)
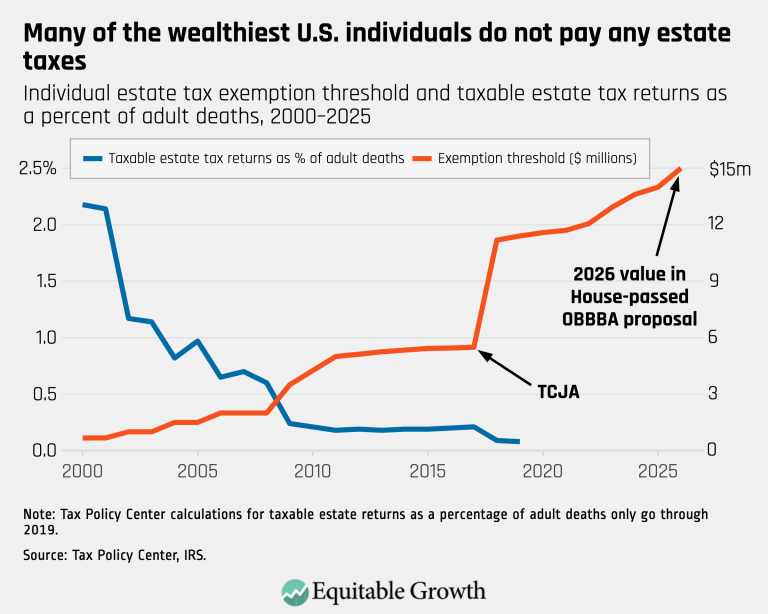
Many of the wealthiest U.S. individuals do not pay any estate taxes (opens in a new tab)
Visualizations Jun 23, 2025
 View Chart
(opens in a new tab)
View Chart
(opens in a new tab)
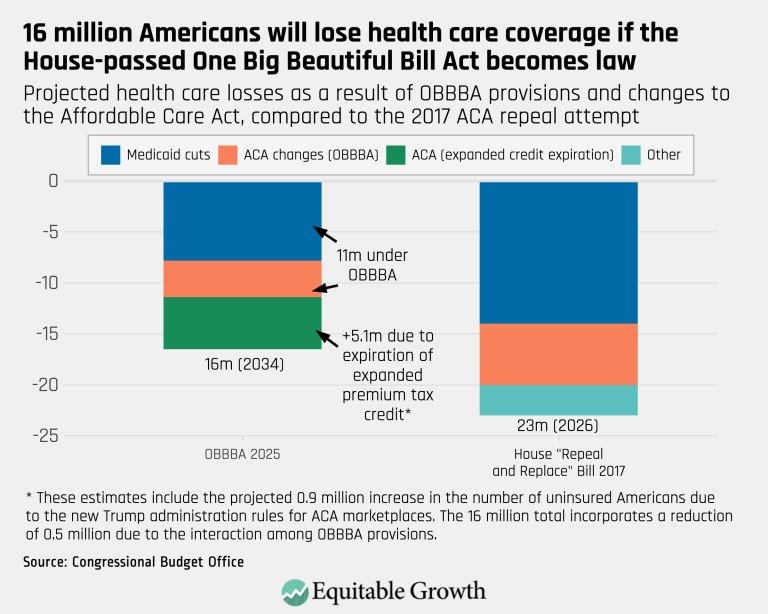
16 million Americans will lose health care coverage if the House-passed One Big Beautiful Bill Act becomes law (opens in a new tab)
Visualizations Jun 23, 2025
 View Chart
(opens in a new tab)
View Chart
(opens in a new tab)
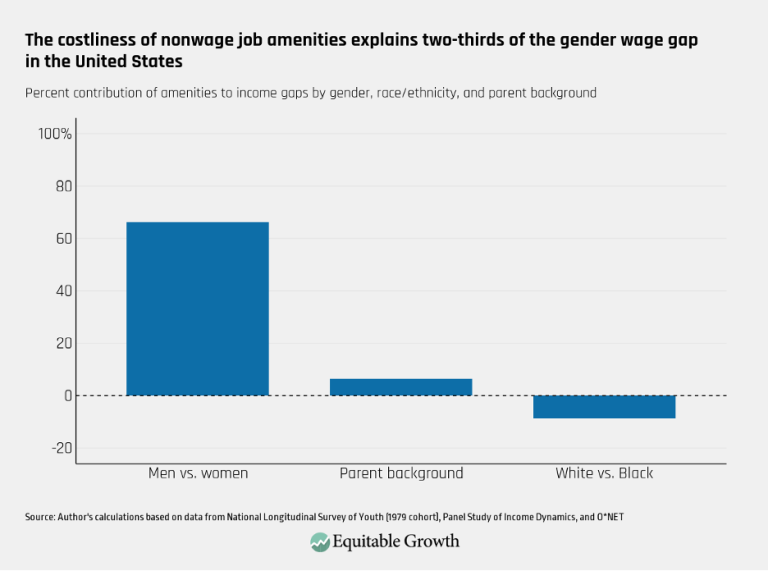
The costliness of nonwage job amenities explains two-thirds of the gender wage gap in the United States (opens in a new tab)
Visualizations Jun 10, 2025
 View Chart
(opens in a new tab)
View Chart
(opens in a new tab)
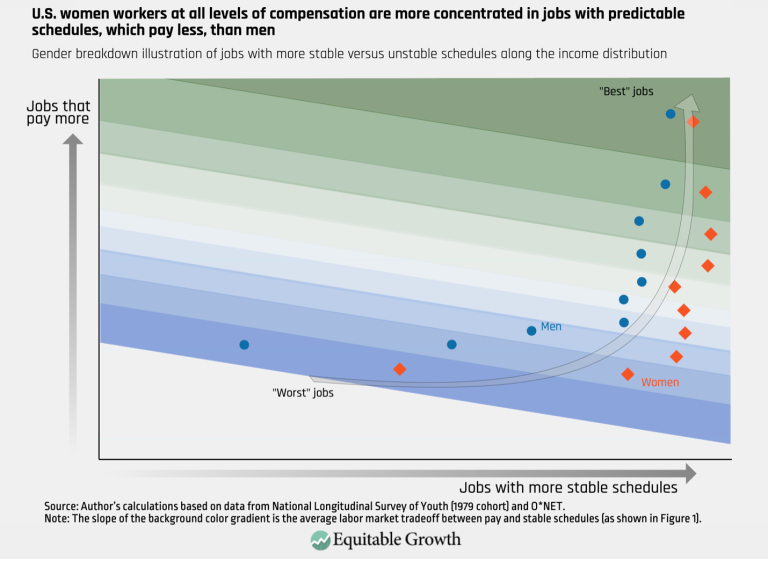
U.S. women workers at all levels of compensation are more concentrated in jobs with predictable schedules, which pay less, than men (opens in a new tab)
Visualizations Jun 10, 2025
 View Chart
(opens in a new tab)
View Chart
(opens in a new tab)
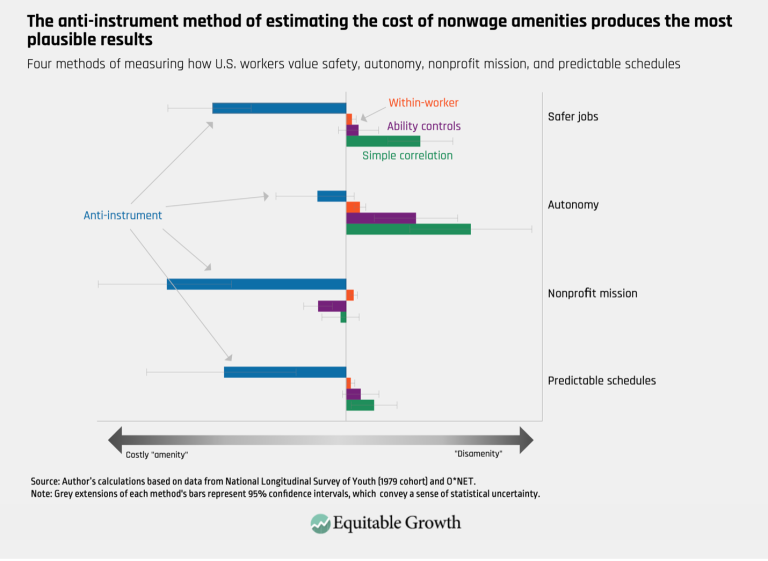
The anti-instrument method of estimating the cost of nonwage amenities produces the most plausible results (opens in a new tab)
Visualizations Jun 10, 2025
 View Chart
(opens in a new tab)
View Chart
(opens in a new tab)
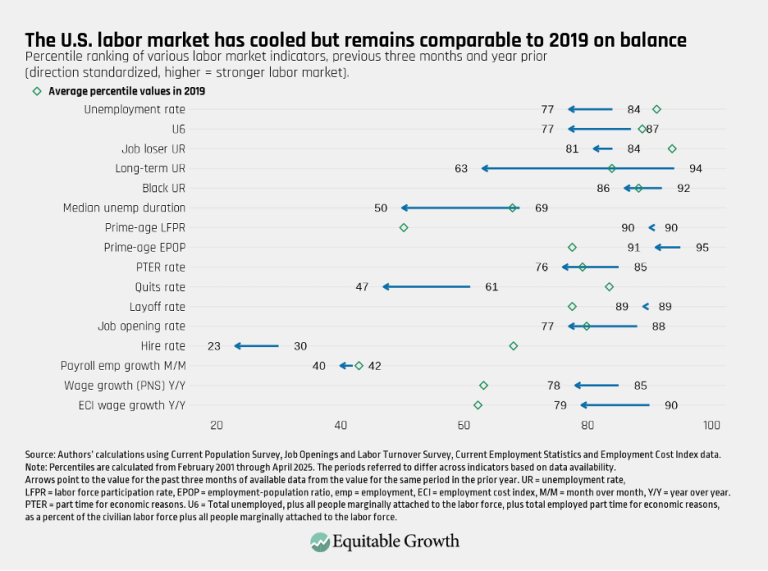
rinz fig 1 (opens in a new tab)
Visualizations May 9, 2025
 View Chart
(opens in a new tab)
View Chart
(opens in a new tab)
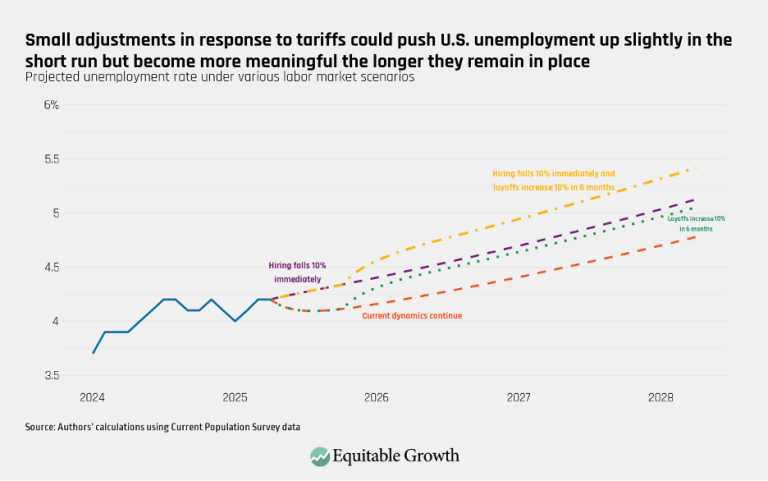
Small adjustments in response to tariffs could push U.S. unemployment up slightly in the short run but become more meaningful the longer they remain in place (opens in a new tab)
Visualizations May 9, 2025
 View Chart
(opens in a new tab)
View Chart
(opens in a new tab)
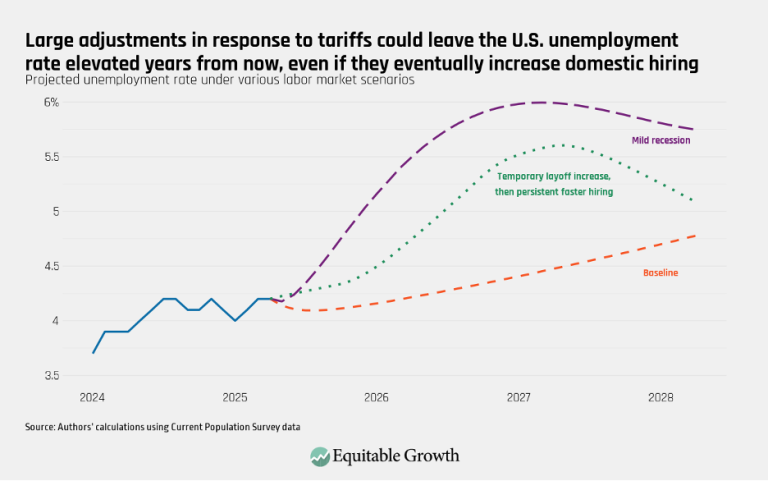
rinz fig 3 (opens in a new tab)
Visualizations May 9, 2025
 View Chart
(opens in a new tab)
View Chart
(opens in a new tab)
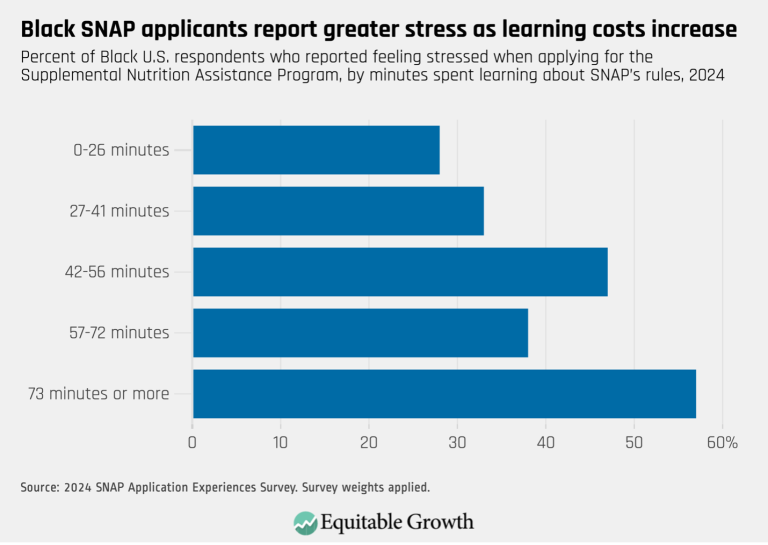
Black SNAP applicants report greater stress as learning costs increase (opens in a new tab)
Visualizations Apr 30, 2024
 View Chart
(opens in a new tab)
View Chart
(opens in a new tab)
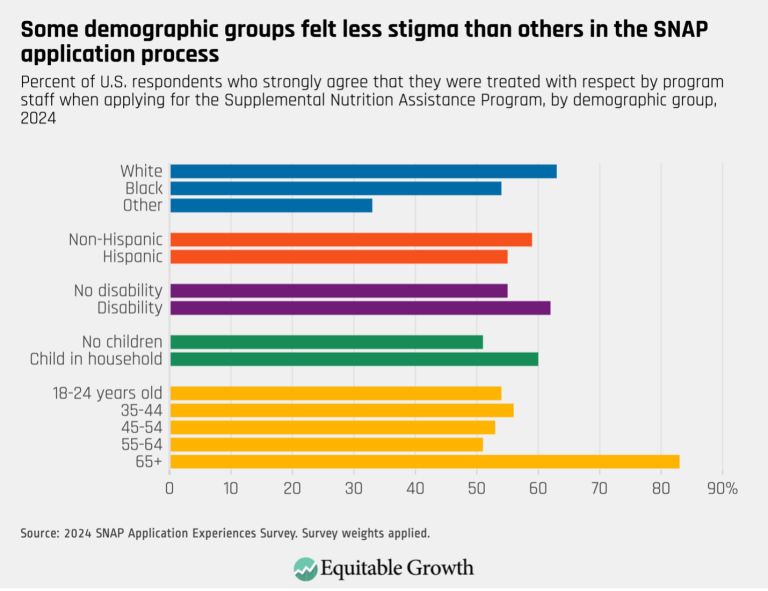
Some demographic groups felt less stigma than others in the SNAP application process (opens in a new tab)
Visualizations Apr 30, 2024
 View Chart
(opens in a new tab)
View Chart
(opens in a new tab)
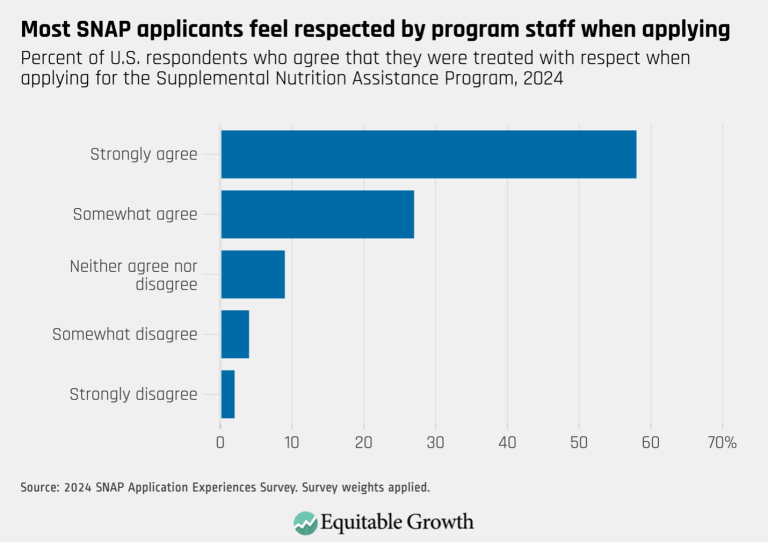
Most SNAP applicants feel respected by program staff when applying (opens in a new tab)
Visualizations Apr 30, 2024
 View Chart
(opens in a new tab)
View Chart
(opens in a new tab)
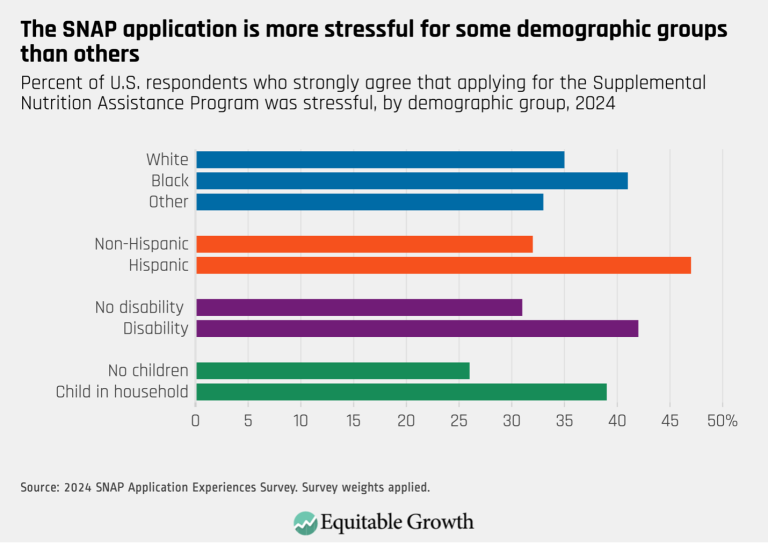
The SNAP application is more stressful for some demographic groups than others (opens in a new tab)
Visualizations Apr 30, 2024
 View Chart
(opens in a new tab)
View Chart
(opens in a new tab)
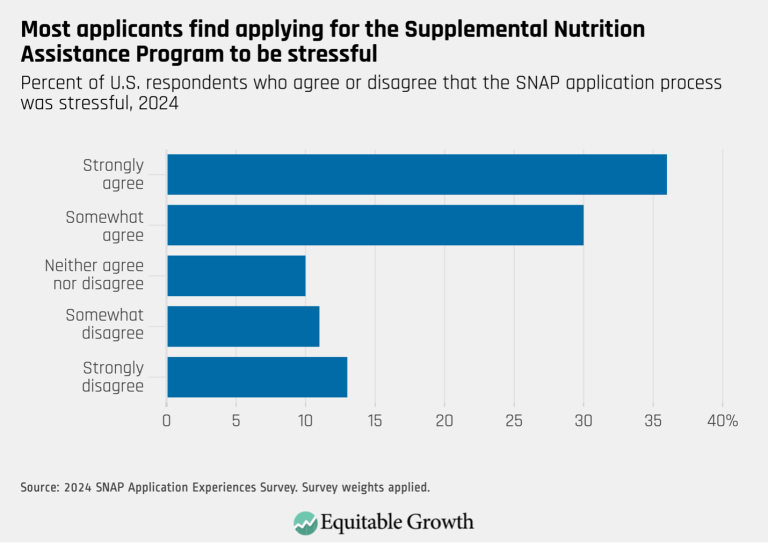
Most applicants find applying for the Supplemental Nutrition Assistance Program to be stressful (opens in a new tab)
Visualizations Apr 30, 2024
 View Chart
(opens in a new tab)
View Chart
(opens in a new tab)
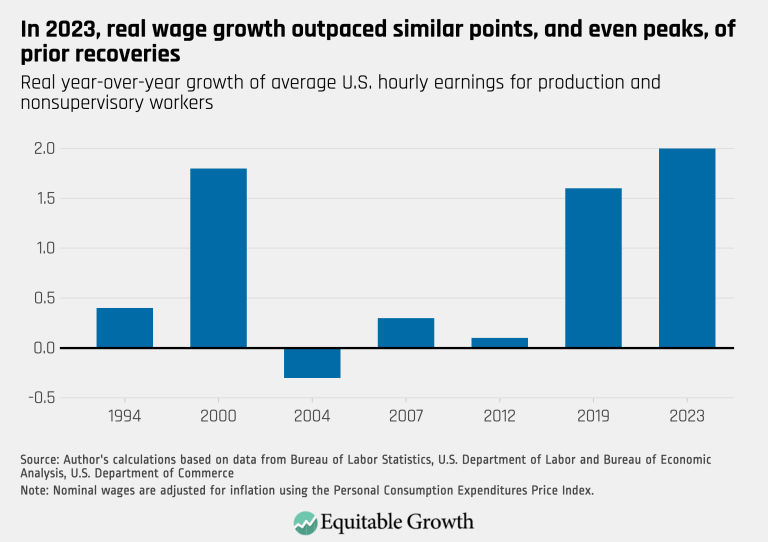
In 2023, real wage growth outpaces similar points, and even peaks, of prior recoveries (opens in a new tab)
Visualizations Mar 4, 2024
 View Chart
(opens in a new tab)
View Chart
(opens in a new tab)
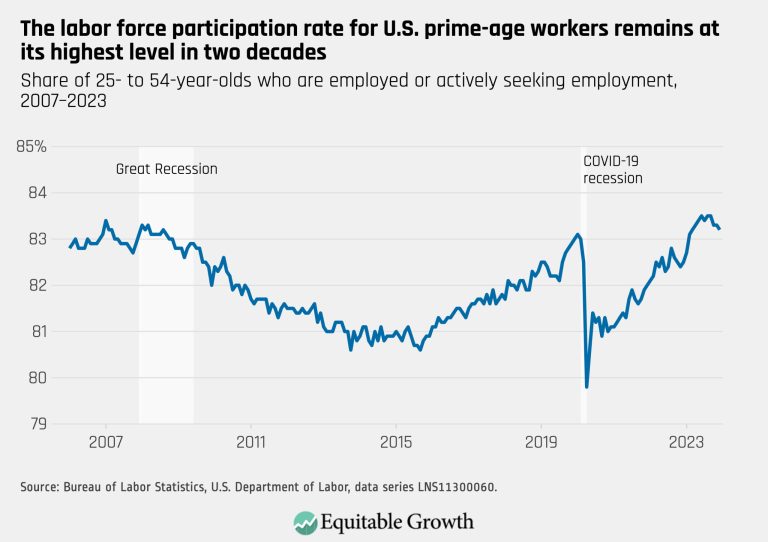
The labor force participation rate for U.S. prime-age workers remains at its highest level in two decades (opens in a new tab)
Visualizations Mar 4, 2024
 View Chart
(opens in a new tab)
View Chart
(opens in a new tab)
Personal loan delinquency is low or within normal levels for all major loan types (opens in a new tab)
Visualizations Feb 20, 2024
 View Chart
(opens in a new tab)
View Chart
(opens in a new tab)
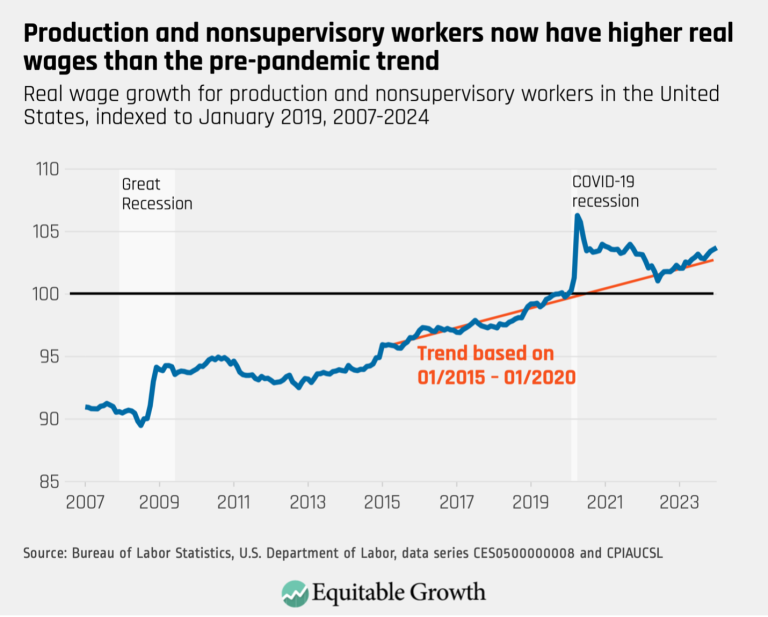
Production and nonsupervisory workers now have higher real wages than the pre-pandemic trend (opens in a new tab)
Visualizations Feb 20, 2024
 View Chart
(opens in a new tab)
View Chart
(opens in a new tab)
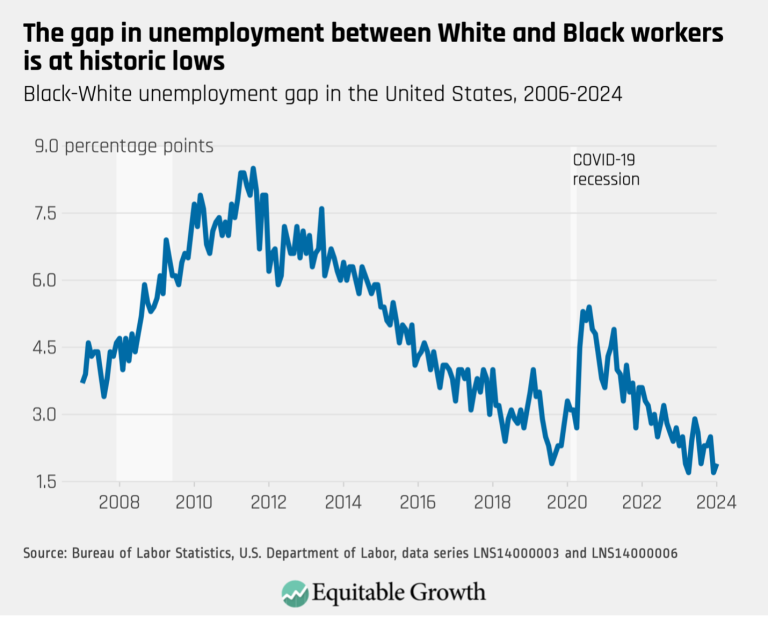
The gap in unemployment between White and Black workers is at historic lows (opens in a new tab)
Visualizations Feb 20, 2024
 View Chart
(opens in a new tab)
View Chart
(opens in a new tab)
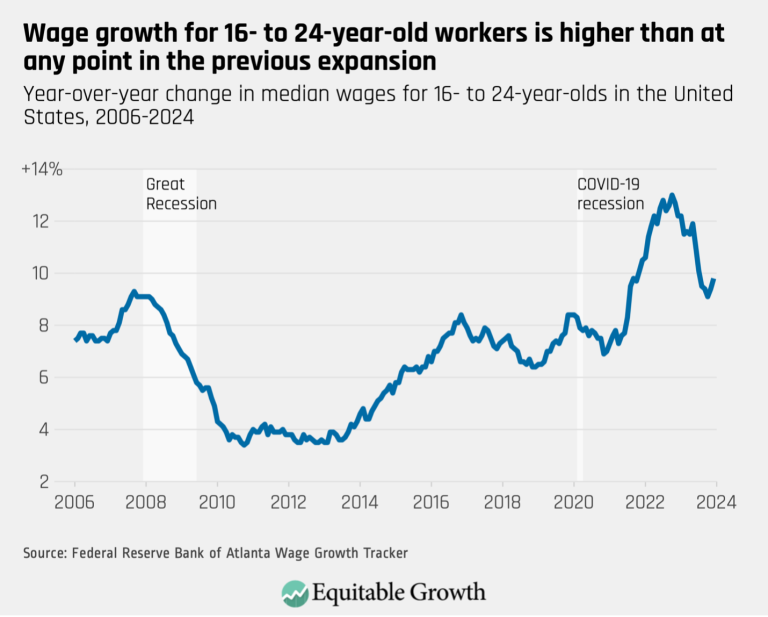
Wage growth for 16- to 24-year-old workers is higher than at any point in the previous expansion (opens in a new tab)
Visualizations Feb 20, 2024
 View Chart
(opens in a new tab)
View Chart
(opens in a new tab)
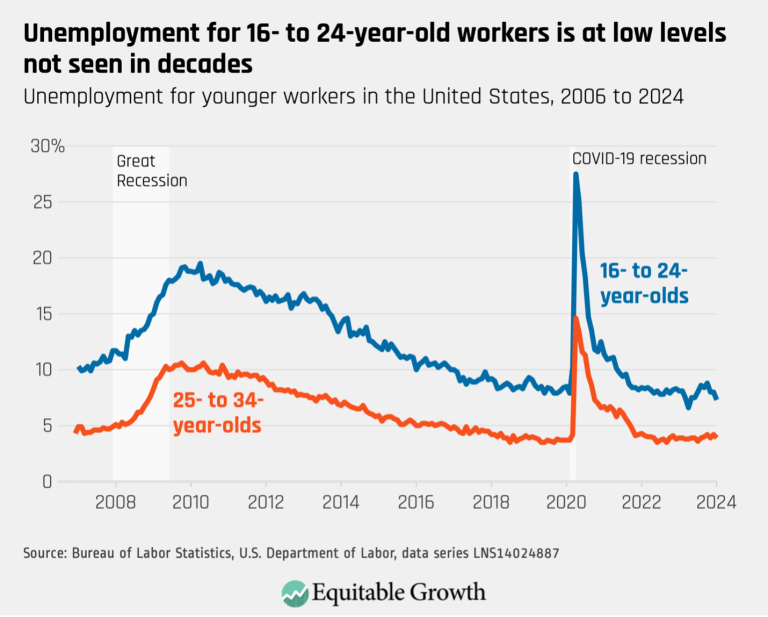
Unemployment for 16- to 24-year-old workers is at low levels not seen in decades (opens in a new tab)
Visualizations Feb 20, 2024
 View Chart
(opens in a new tab)
View Chart
(opens in a new tab)
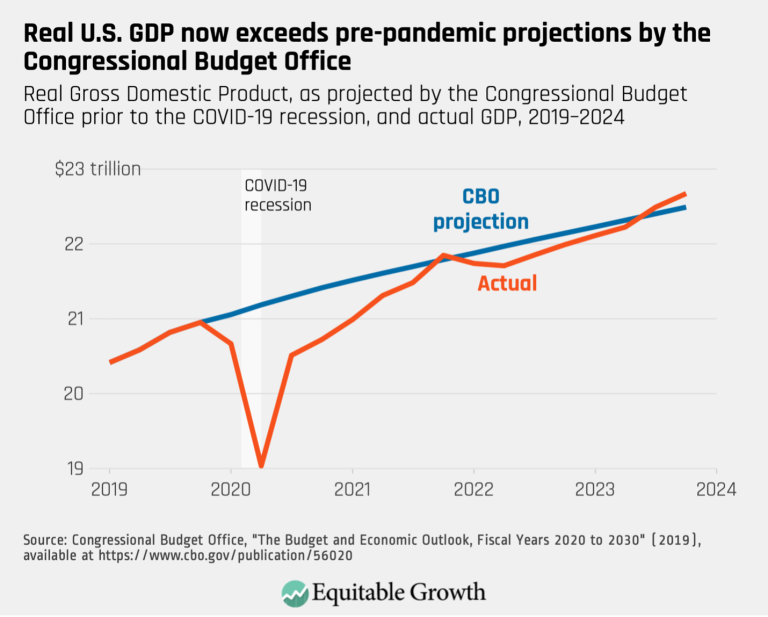
Real U.S. GDP now exceeds pre-pandemic projections by the Congressional budget Office (opens in a new tab)
Visualizations Feb 20, 2024
 View Chart
(opens in a new tab)
View Chart
(opens in a new tab)
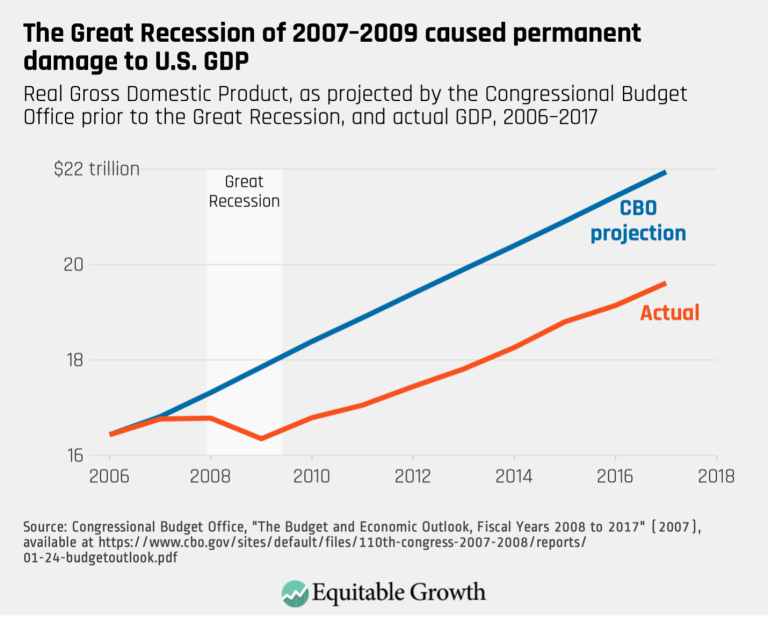
The Great Recession of 2007-2009 caused permanent damage to U.S. GDP (opens in a new tab)
Visualizations Feb 20, 2024
 View Chart
(opens in a new tab)
View Chart
(opens in a new tab)
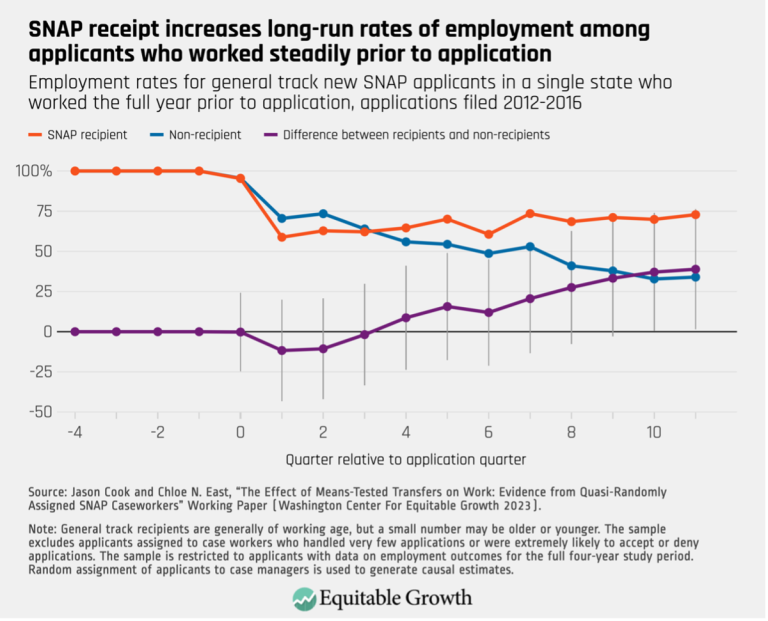
SNAP receipt increases long-run rates of employment among applicants who worked steadily prior to application (opens in a new tab)
Visualizations Nov 8, 2023
 View Chart
(opens in a new tab)
View Chart
(opens in a new tab)
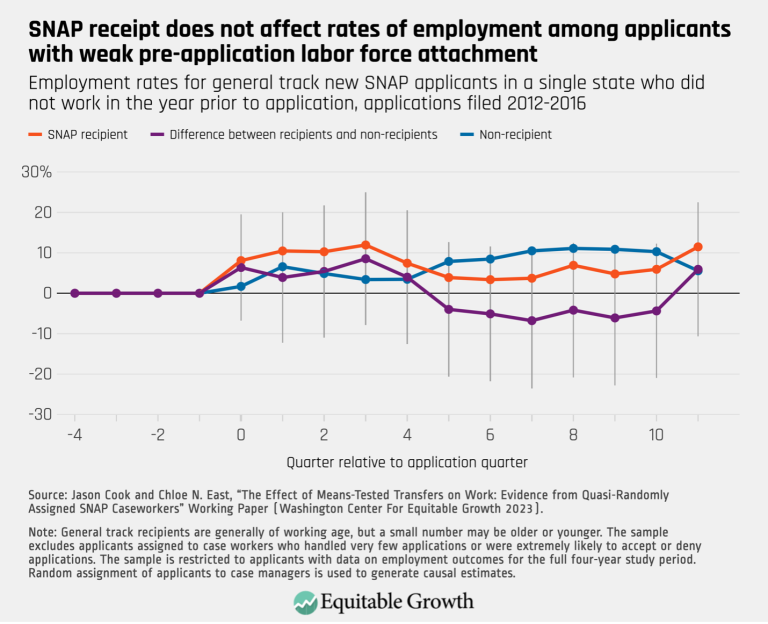
SNAP receipt does not affect rates of employment among applicants with weak pre-application labor force attachment (opens in a new tab)
Visualizations Nov 8, 2023
 View Chart
(opens in a new tab)
View Chart
(opens in a new tab)
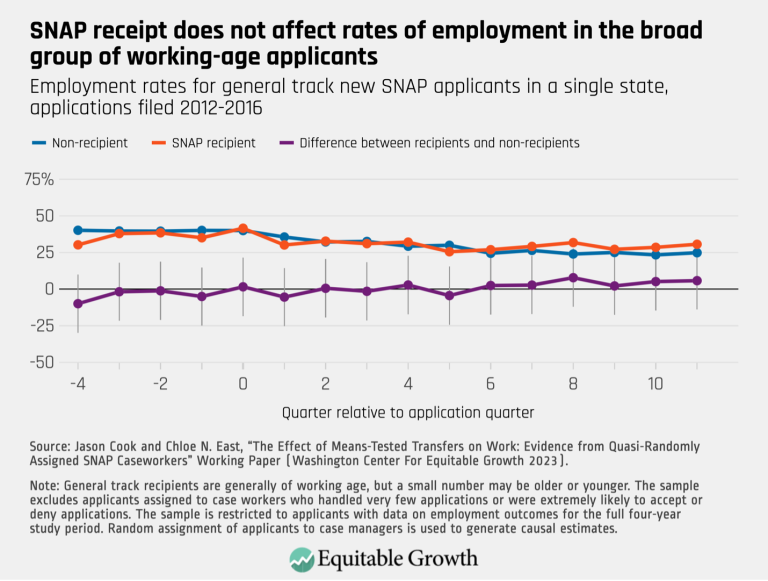
SNAP receipt does not affect rates of employment in the broad group of working-age applicant (opens in a new tab)
Visualizations Nov 8, 2023
 View Chart
(opens in a new tab)
View Chart
(opens in a new tab)
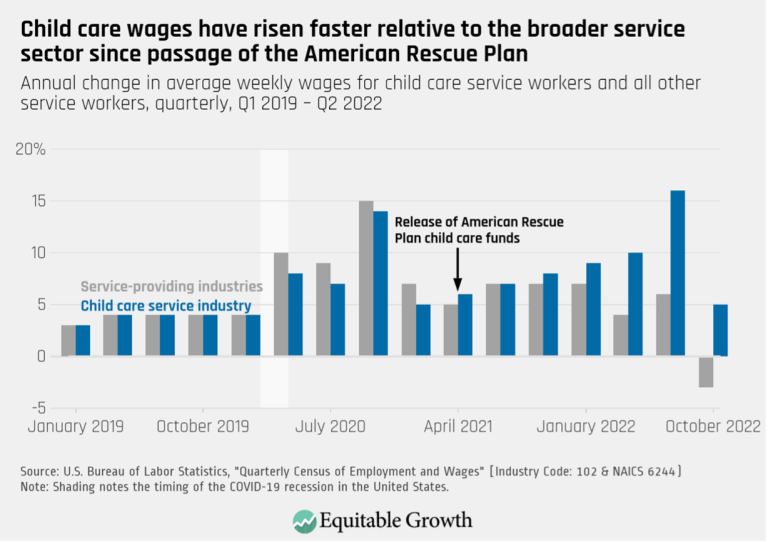
Child care wages have risen faster relative to the broader service sector since passage of the American Rescue Plan (opens in a new tab)
Visualizations Oct 31, 2023
 View Chart
(opens in a new tab)
View Chart
(opens in a new tab)
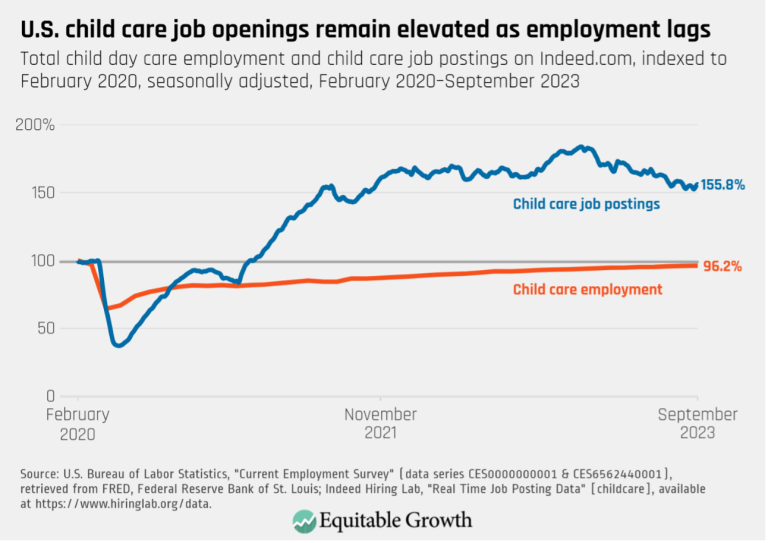
U.S. child care job openings remain elevated as employment lags (opens in a new tab)
Visualizations Oct 31, 2023
 View Chart
(opens in a new tab)
View Chart
(opens in a new tab)
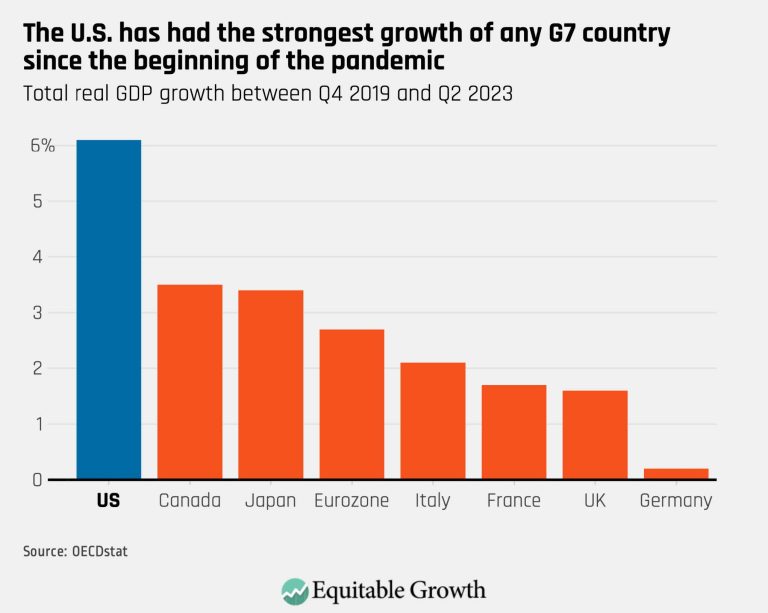
The U.S. has had the strongest growth of any G7 country since the beginning of the pandemic (opens in a new tab)
Visualizations Sep 20, 2023
 View Chart
(opens in a new tab)
View Chart
(opens in a new tab)
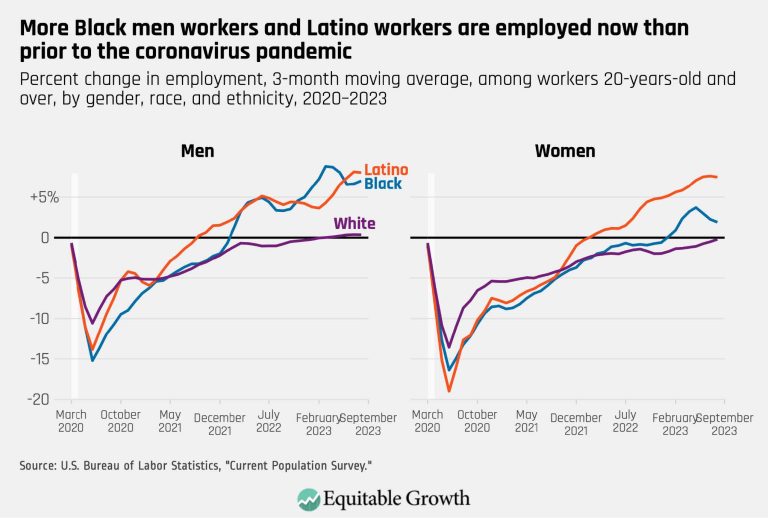
More Black men workers and Latino workers are employed now than prior to the coronavirus pandemic (opens in a new tab)
Visualizations Sep 20, 2023
 View Chart
(opens in a new tab)
View Chart
(opens in a new tab)
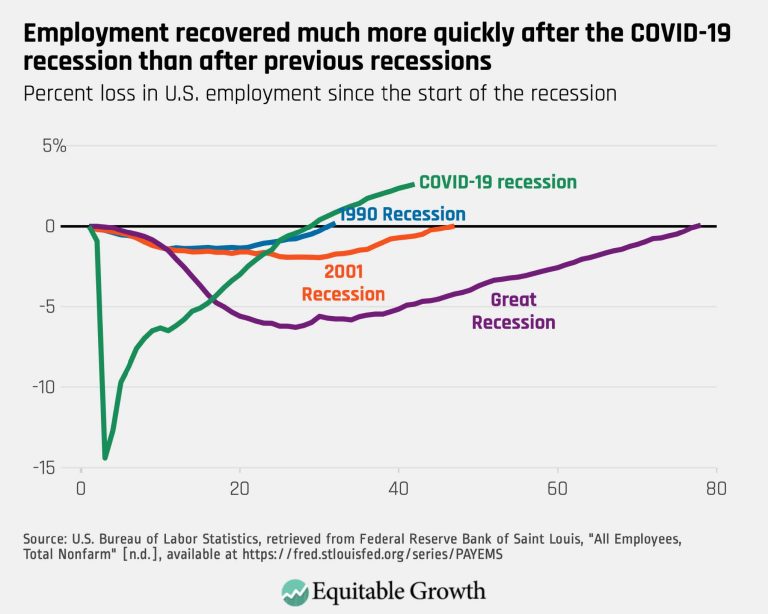
Employment recovered much more quickly after the COVID-19 recession than after previous recessions (opens in a new tab)
Visualizations Sep 20, 2023
 View Chart
(opens in a new tab)
View Chart
(opens in a new tab)
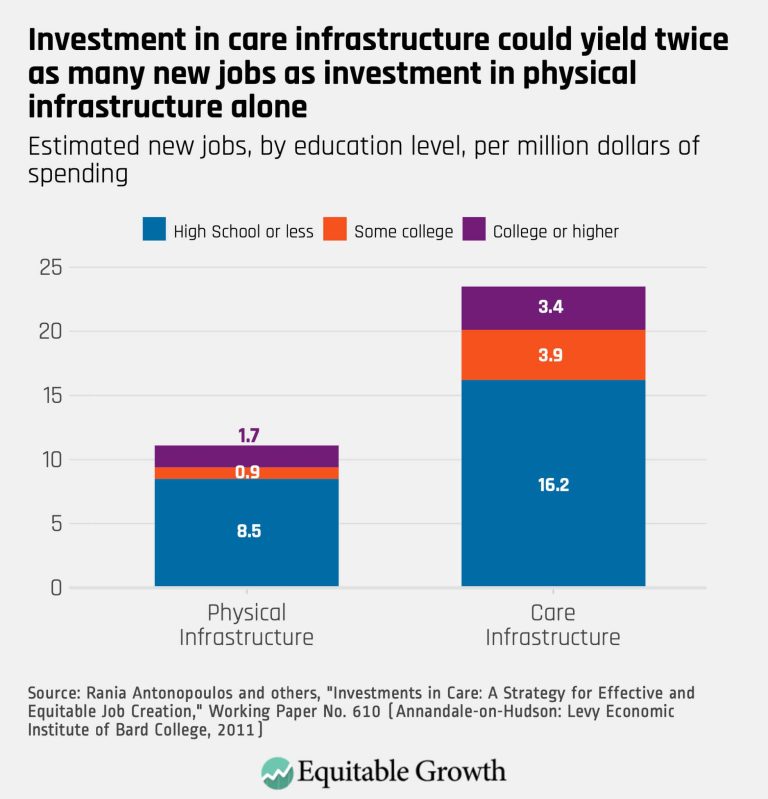
Investment in care infrastructure could yield twice as many new jobs as investment in physical infrastructure alone (opens in a new tab)
Visualizations Sep 19, 2023










































Your Source for the Latest Insights
Get updates on our latest research, event announcements, and policy insights delivered straight to your inbox. Stay connected with the leading voices on equitable growth.