


Issue Areas
The Washington Center for Equitable Growth is engaged in an array of issues to advance evidence-based ideas and policies that promote strong, stable, and broad-based economic growth.

242 Results

 View Chart
(opens in a new tab)
View Chart
(opens in a new tab)
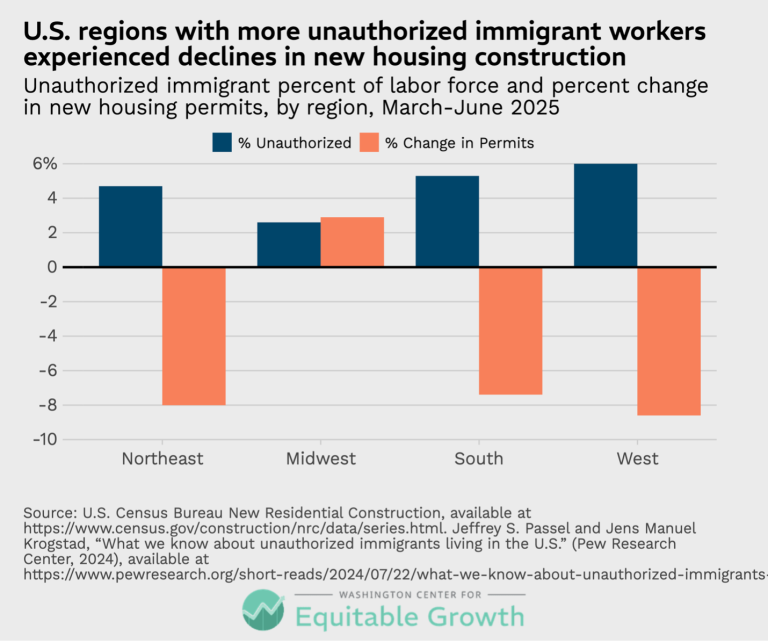
U.S. regions with more unauthorized immigrant workers experienced declines in new housing construction (opens in a new tab)
Visualizations Aug 31, 2026
 View Chart
(opens in a new tab)
View Chart
(opens in a new tab)
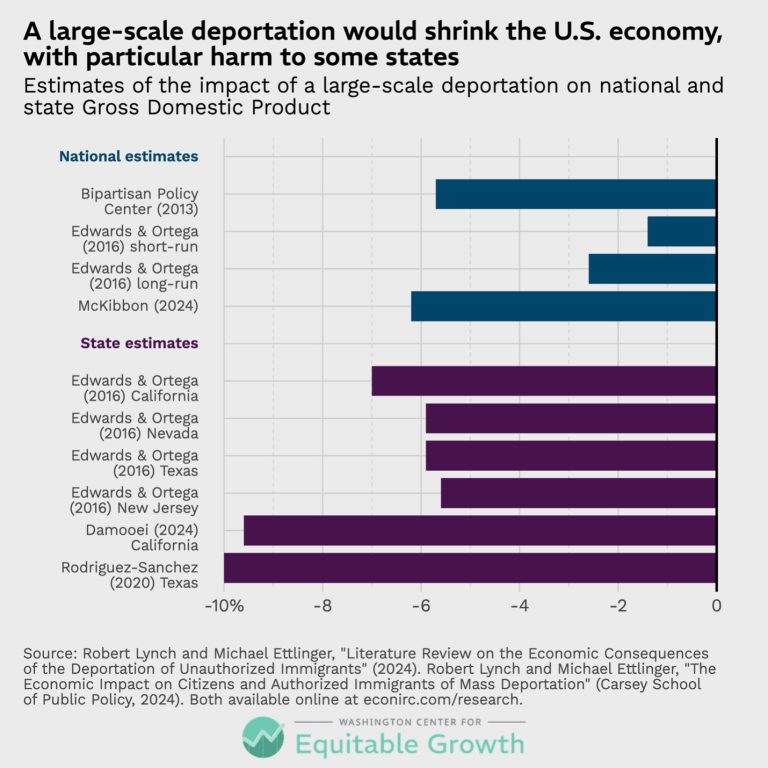
A large-scale deportation would shrink the U.S. economy, with particular harm to some states (opens in a new tab)
Visualizations Aug 31, 2026
 View Chart
(opens in a new tab)
View Chart
(opens in a new tab)
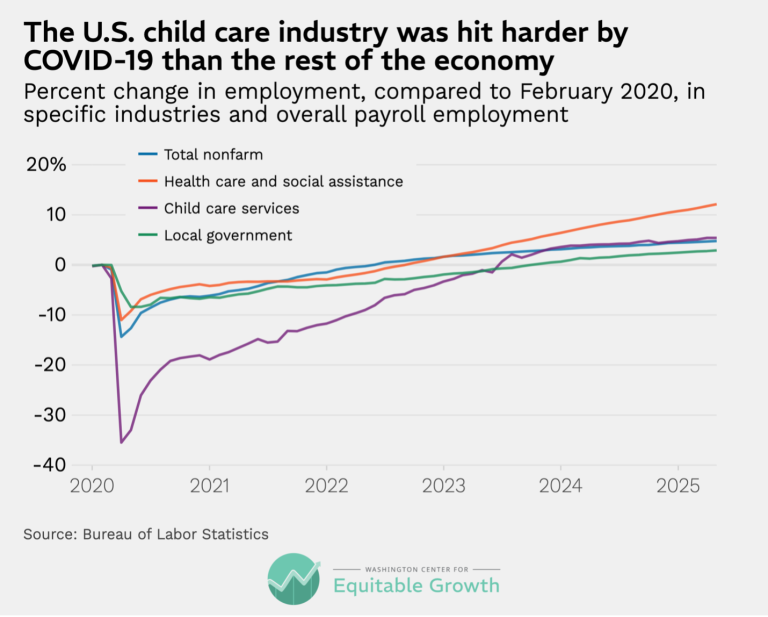
The U.S. child care industry was hit harder by COVID-19 than the rest of the economy (opens in a new tab)
Visualizations Apr 15, 2026
 View Chart
(opens in a new tab)
View Chart
(opens in a new tab)
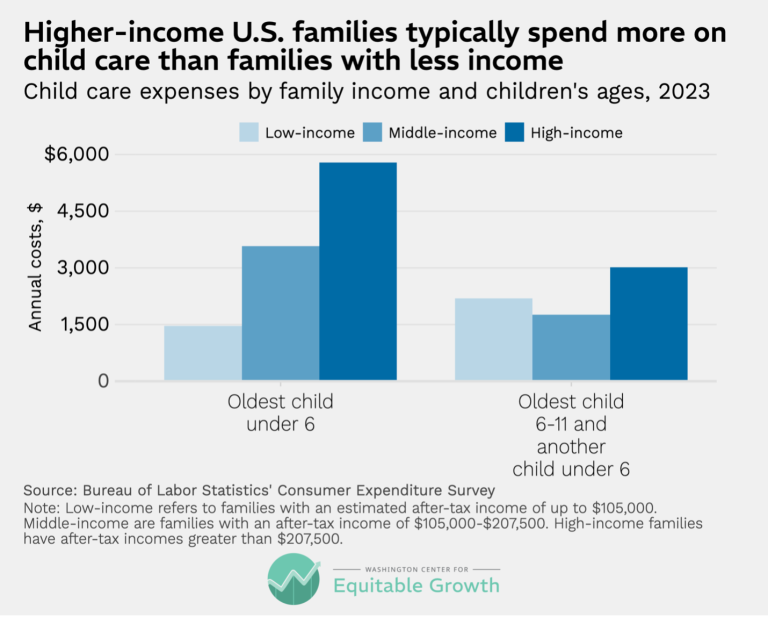
Higher-income U.S. families typically spend more on child care than families with less income (opens in a new tab)
Visualizations Apr 15, 2026
 View Chart
(opens in a new tab)
View Chart
(opens in a new tab)
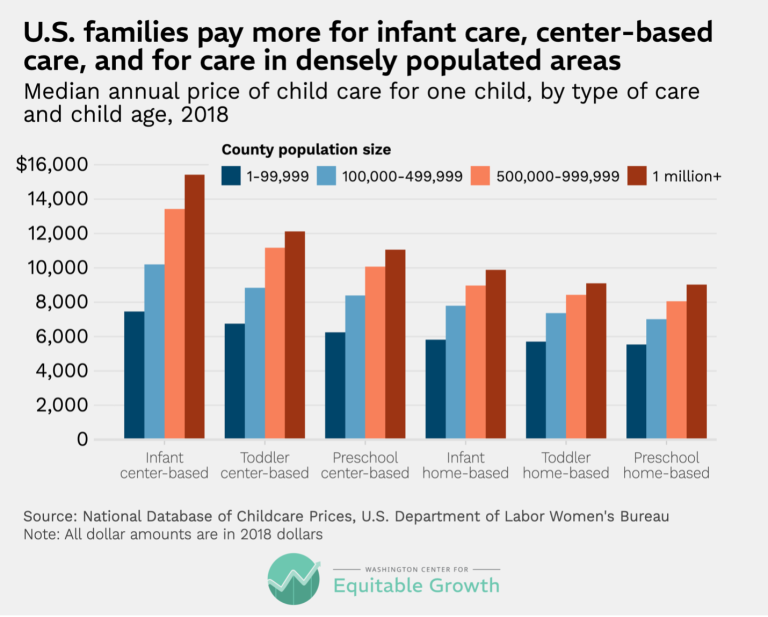
U.S. families pay more for infant care, center-based care, and for care in densely populated areas (opens in a new tab)
Visualizations Apr 15, 2026
 View Chart
(opens in a new tab)
View Chart
(opens in a new tab)
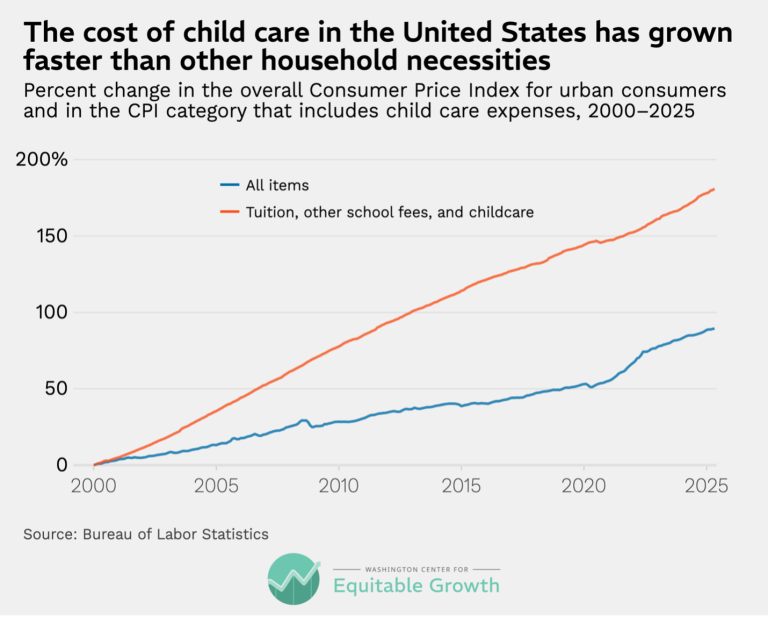
The cost of child care in the United States has grown faster than other household necessities (opens in a new tab)
Visualizations Apr 15, 2026
 View Chart
(opens in a new tab)
View Chart
(opens in a new tab)
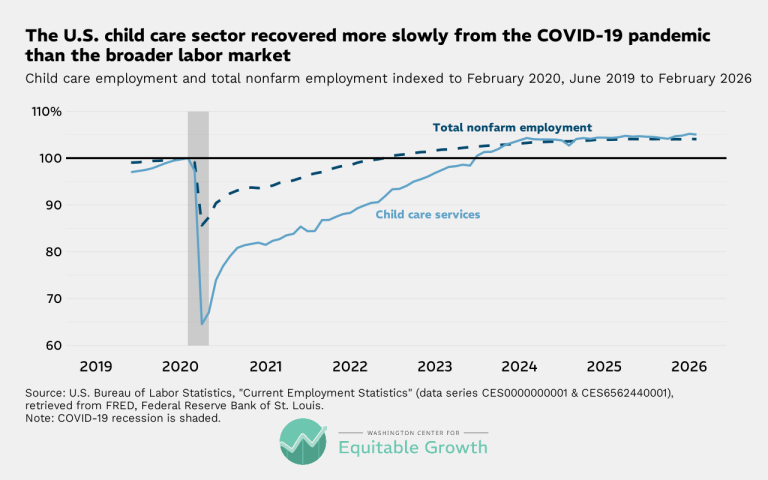
The U.S. child care sector recovered more slowly from the COVID-19 pandemic than the broader labor market (opens in a new tab)
Visualizations Apr 8, 2026
 View Chart
(opens in a new tab)
View Chart
(opens in a new tab)
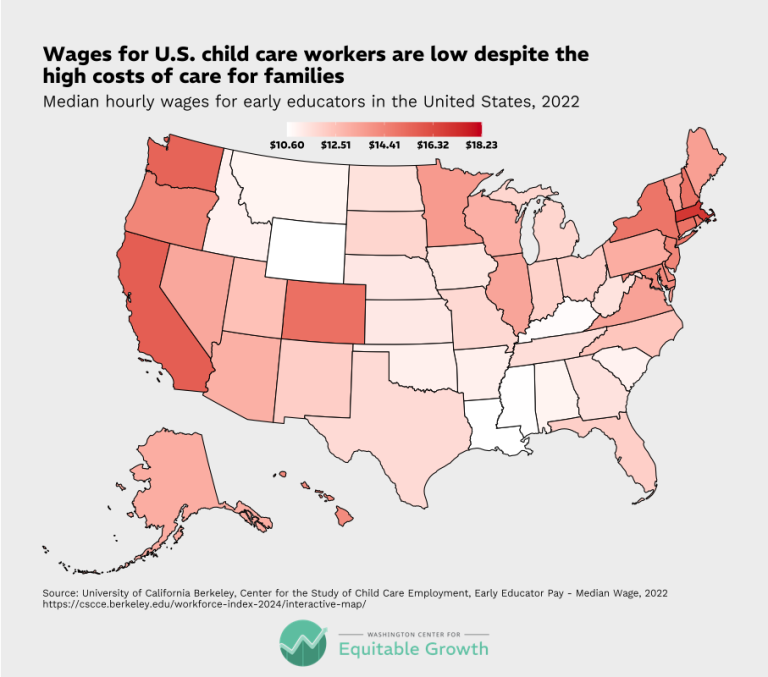
Wages for U.S. child care workers are low despite the high costs of care for families (opens in a new tab)
Visualizations Apr 8, 2026
 View Chart
(opens in a new tab)
View Chart
(opens in a new tab)
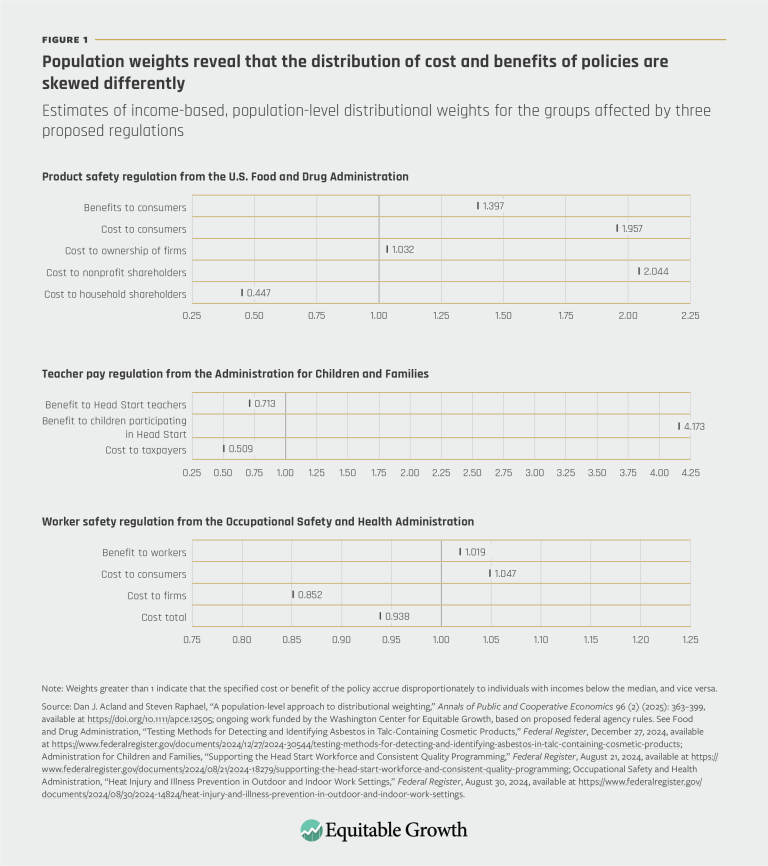
Population weights reveal that the distribution of cost and benefits of policies are skewed differently (opens in a new tab)
Visualizations Nov 13, 2025
 View Chart
(opens in a new tab)
View Chart
(opens in a new tab)
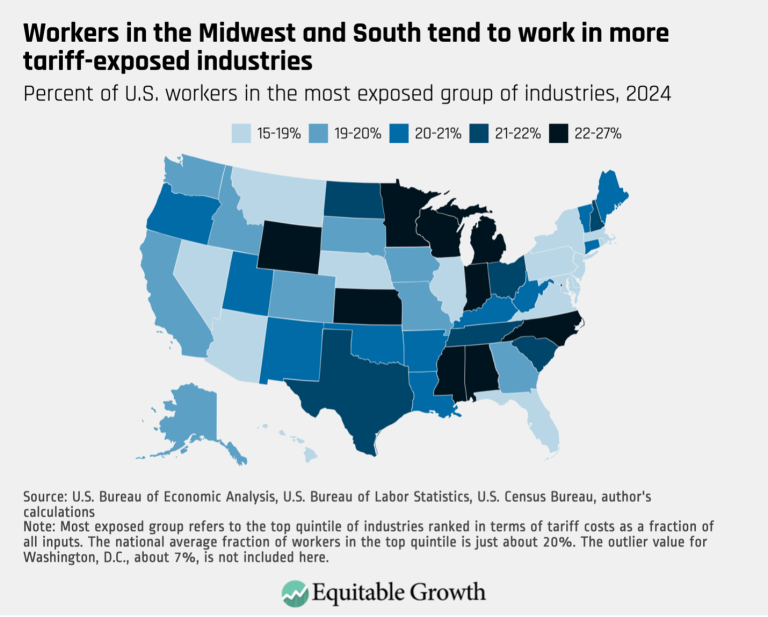
Workers in the Midwest and South tend to work in more tariff-exposed industries (opens in a new tab)
Visualizations Nov 3, 2025
 View Chart
(opens in a new tab)
View Chart
(opens in a new tab)
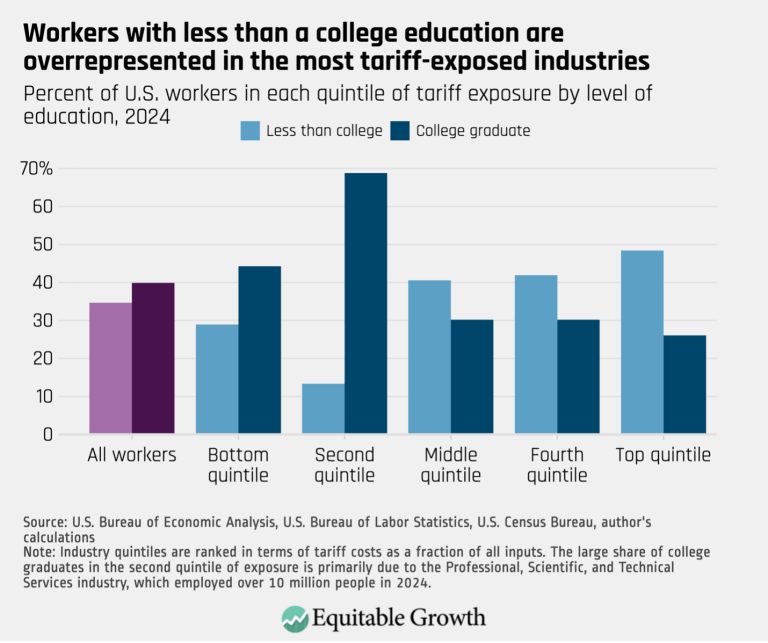
Workers with less than a college education are overrepresented in the most tariff-exposed industries (opens in a new tab)
Visualizations Nov 3, 2025
 View Chart
(opens in a new tab)
View Chart
(opens in a new tab)
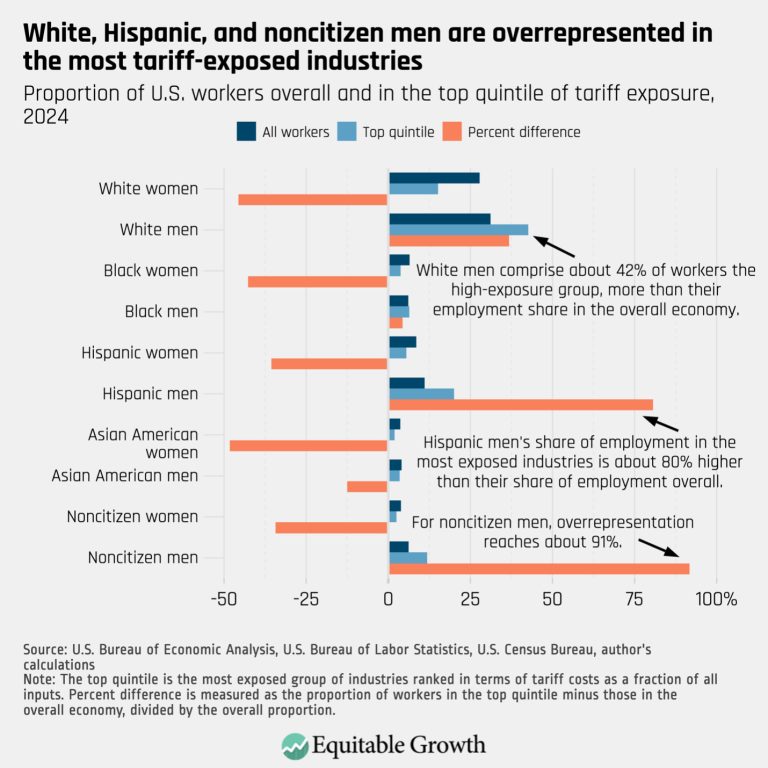
White, Hispanic, and noncitizen men are overrepresented in the most tariff-exposed industries (opens in a new tab)
Visualizations Nov 3, 2025
 View Chart
(opens in a new tab)
View Chart
(opens in a new tab)
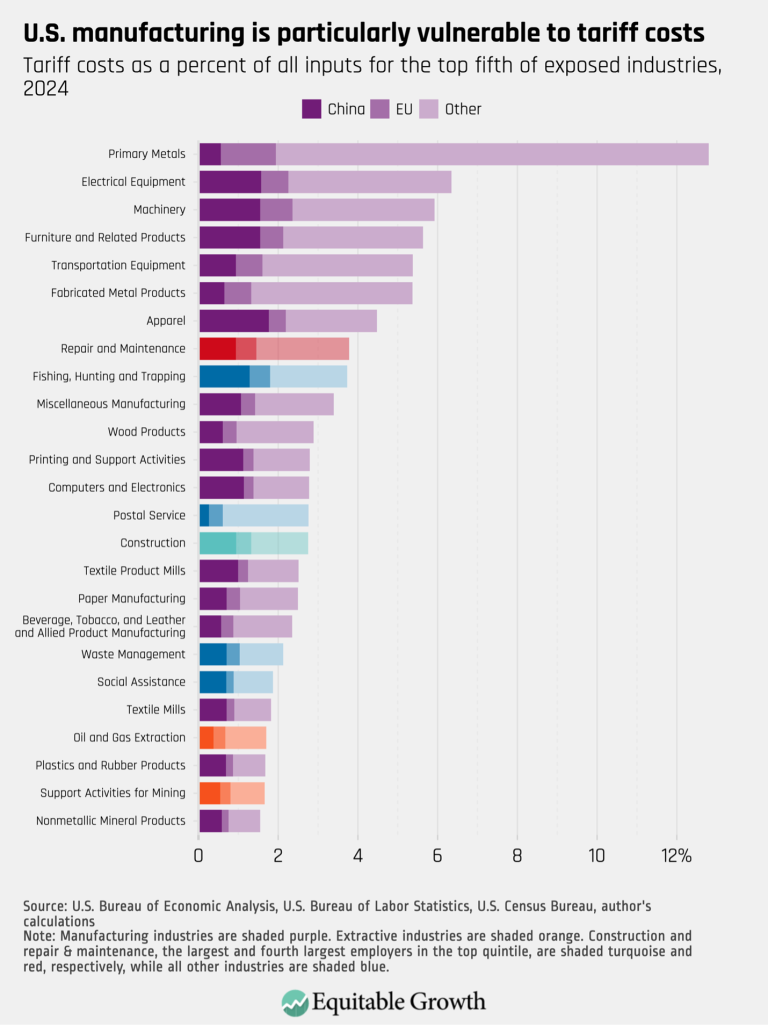
U.S. manufacturing is particularly vulnerable to tariff costs (opens in a new tab)
Visualizations Nov 3, 2025
 View Chart
(opens in a new tab)
View Chart
(opens in a new tab)
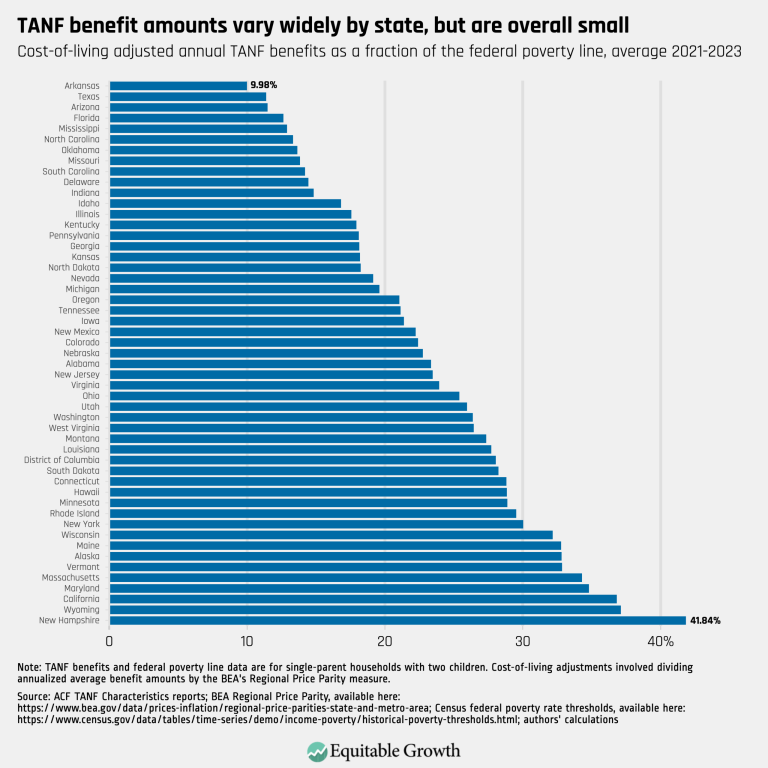
TANF benefit amounts vary widely by state, but are overall small – updated (opens in a new tab)
Visualizations Aug 26, 2025
 View Chart
(opens in a new tab)
View Chart
(opens in a new tab)
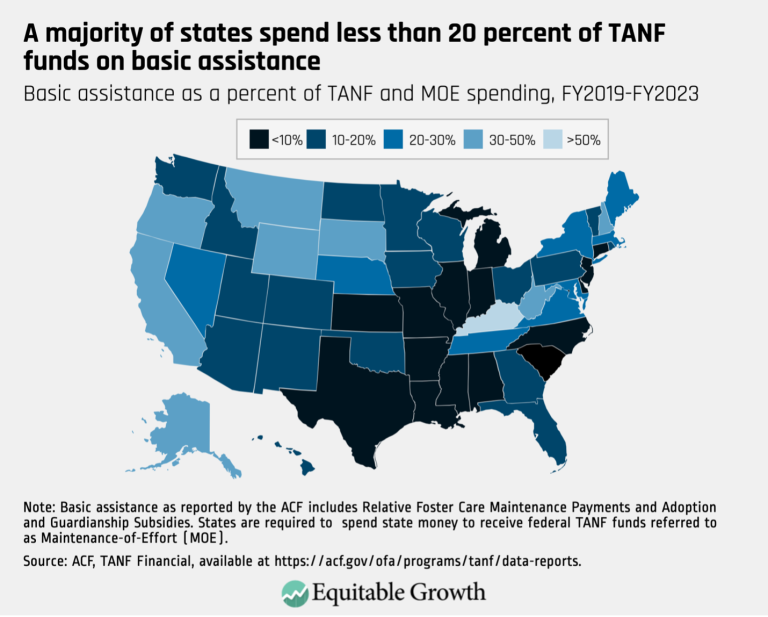
A majority of states spend less than 20 percent of TANF funds on basic assistance (opens in a new tab)
Visualizations Aug 26, 2025
 View Chart
(opens in a new tab)
View Chart
(opens in a new tab)
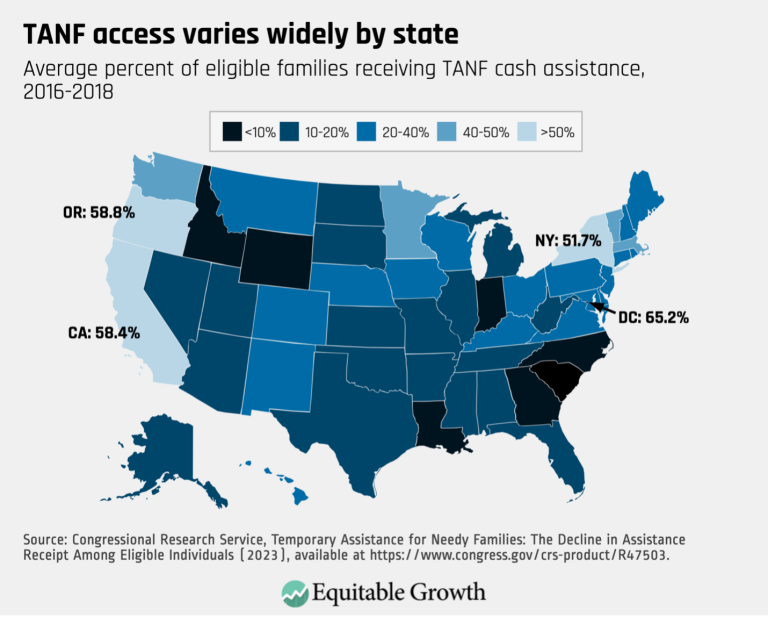
TANF access varies widely by state (opens in a new tab)
Visualizations Aug 26, 2025
 View Chart
(opens in a new tab)
View Chart
(opens in a new tab)
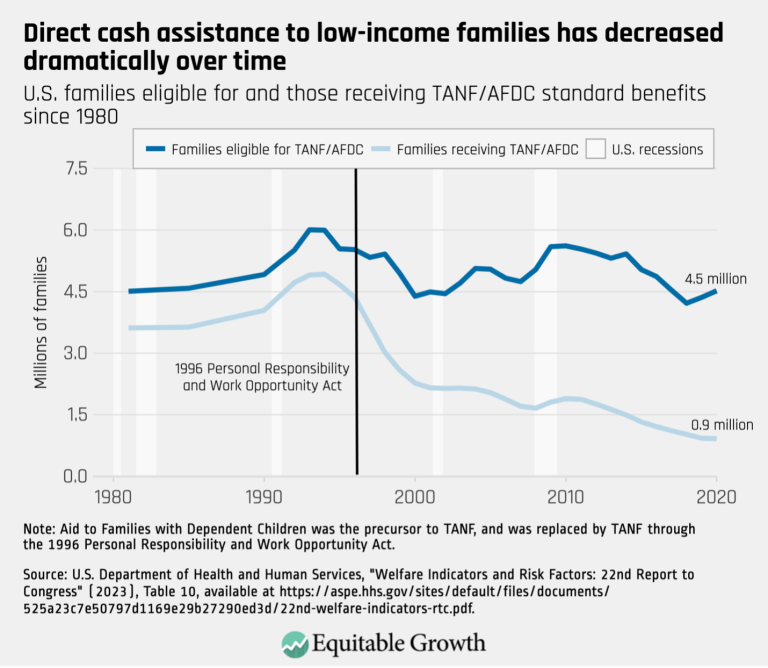
Direct cash assistance to low-income families has decreased dramatically over time (opens in a new tab)
Visualizations Aug 26, 2025
 View Chart
(opens in a new tab)
View Chart
(opens in a new tab)
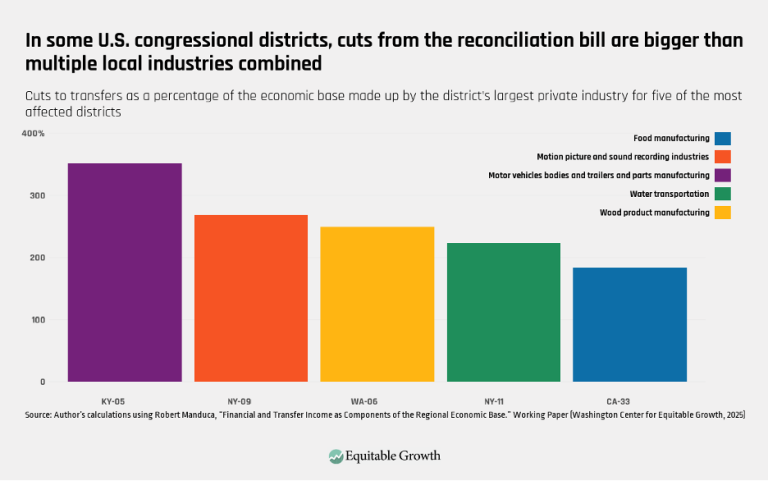
In some U.S. congressional districts, cuts from the reconciliation bill are bigger than multiple local industries combined (opens in a new tab)
Visualizations Jul 10, 2025
 View Chart
(opens in a new tab)
View Chart
(opens in a new tab)
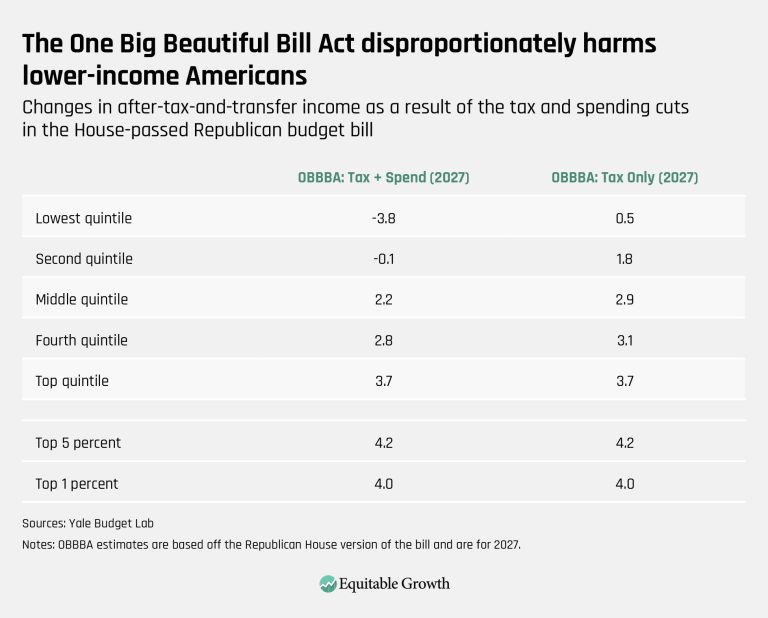
The One Big Beautiful Bill Act disproportionately harms lower-income Americans (opens in a new tab)
Visualizations Jul 3, 2025
 View Chart
(opens in a new tab)
View Chart
(opens in a new tab)
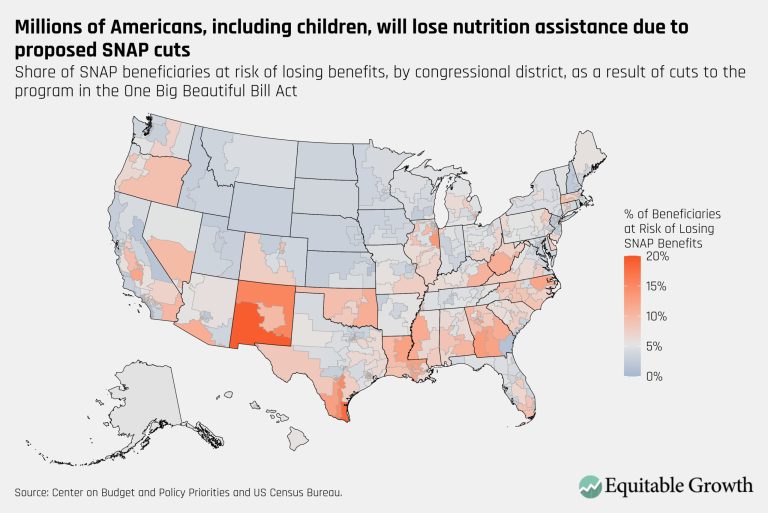
Millions of Americans, including children, will lose nutrition assistance due to proposed SNAP cuts – updated (opens in a new tab)
Visualizations Jun 24, 2025
 View Chart
(opens in a new tab)
View Chart
(opens in a new tab)
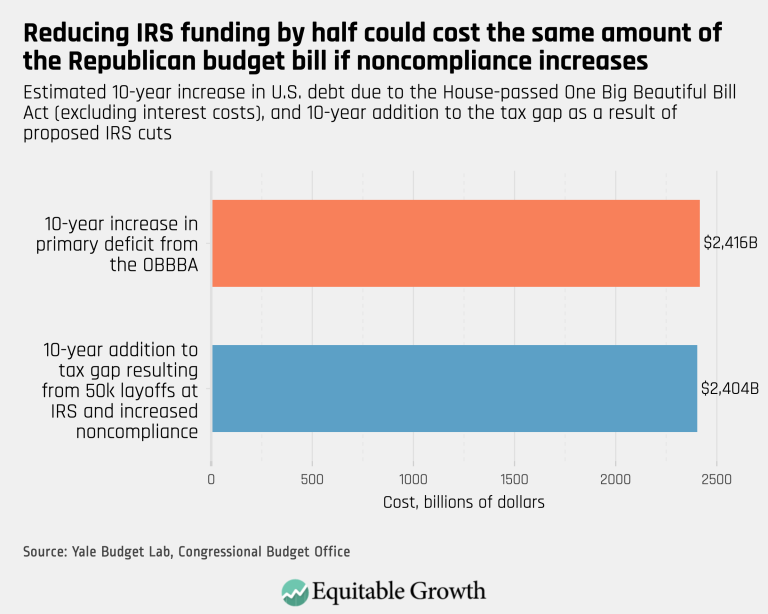
Reducing IRS funding by half could cost the same amount of the Republican budget bill in noncompliance increases (opens in a new tab)
Visualizations Jun 23, 2025
 View Chart
(opens in a new tab)
View Chart
(opens in a new tab)
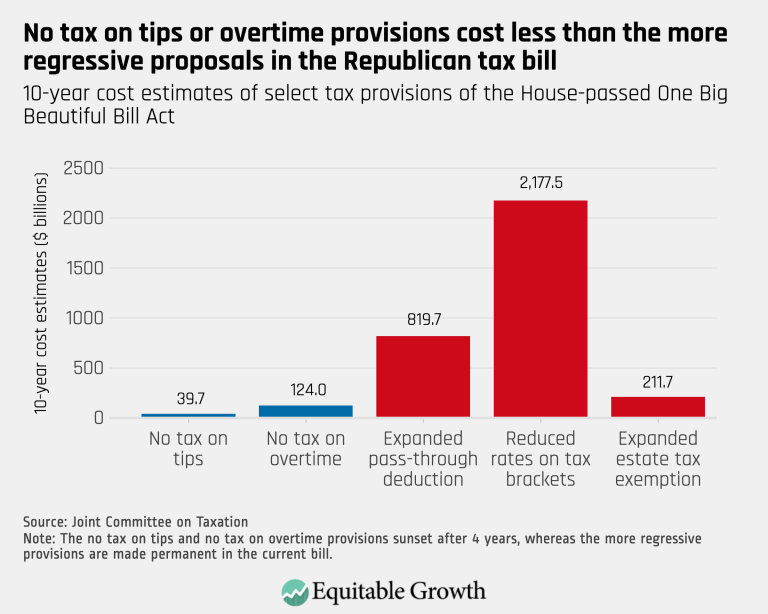
No tax on tips or overtime provisions cost less than the more regressive proposals in the Republican tax bill (opens in a new tab)
Visualizations Jun 23, 2025
 View Chart
(opens in a new tab)
View Chart
(opens in a new tab)
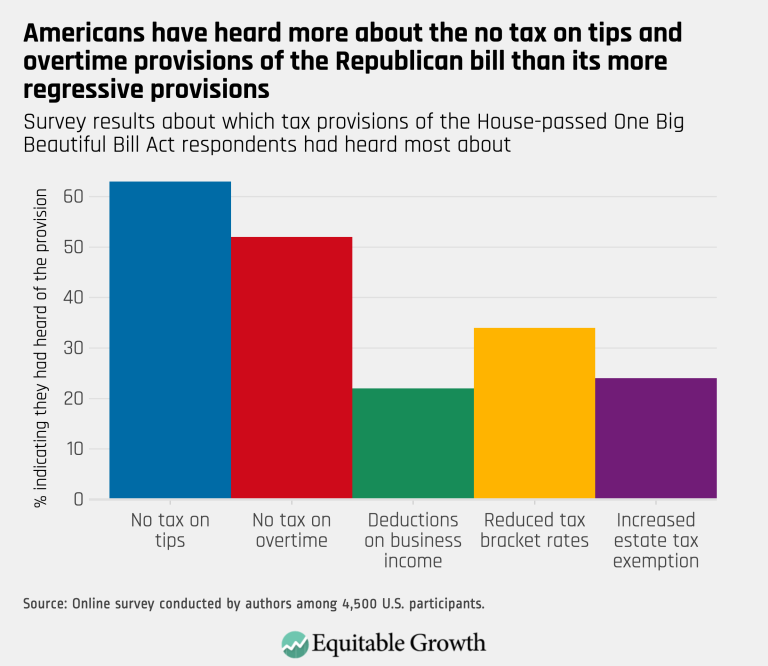
Americans have heard more about the no tax on tips and overtime provisions of the Republican bill than its more regressive provisions (opens in a new tab)
Visualizations Jun 23, 2025
 View Chart
(opens in a new tab)
View Chart
(opens in a new tab)
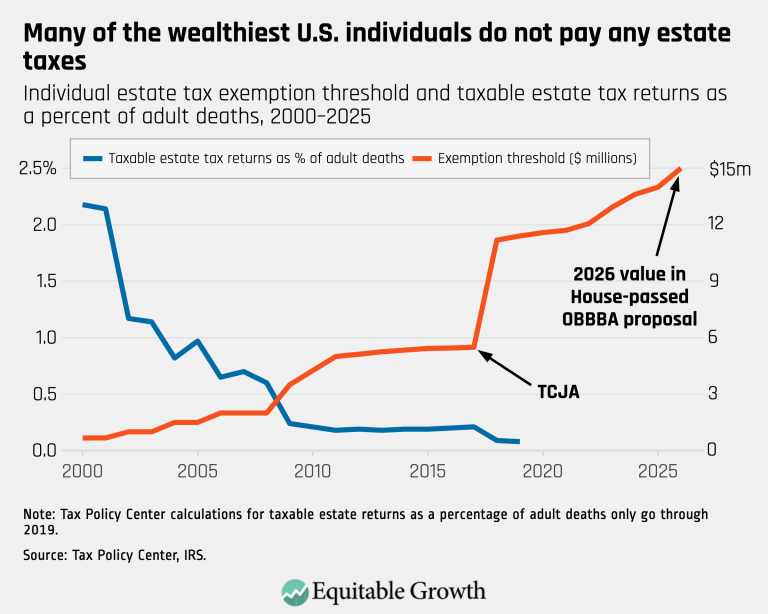
Many of the wealthiest U.S. individuals do not pay any estate taxes (opens in a new tab)
Visualizations Jun 23, 2025
 View Chart
(opens in a new tab)
View Chart
(opens in a new tab)
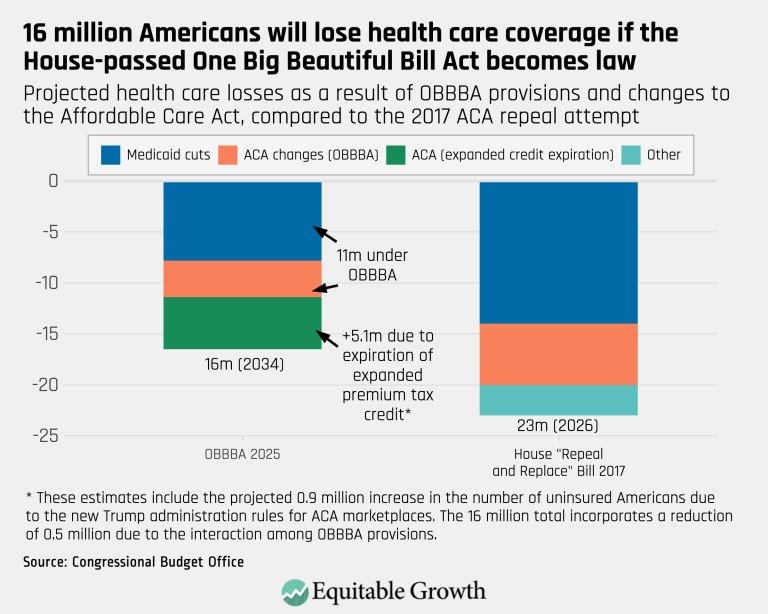
16 million Americans will lose health care coverage if the House-passed One Big Beautiful Bill Act becomes law (opens in a new tab)
Visualizations Jun 23, 2025
 View Chart
(opens in a new tab)
View Chart
(opens in a new tab)
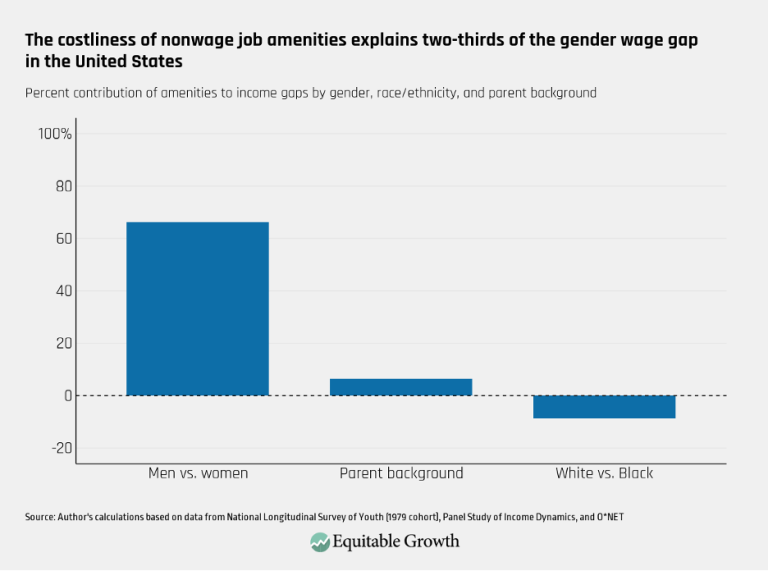
The costliness of nonwage job amenities explains two-thirds of the gender wage gap in the United States (opens in a new tab)
Visualizations Jun 10, 2025
 View Chart
(opens in a new tab)
View Chart
(opens in a new tab)
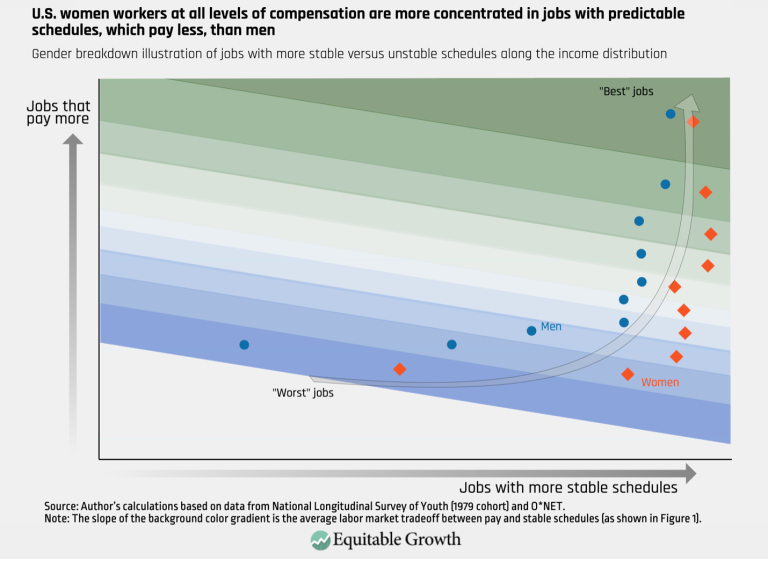
U.S. women workers at all levels of compensation are more concentrated in jobs with predictable schedules, which pay less, than men (opens in a new tab)
Visualizations Jun 10, 2025
 View Chart
(opens in a new tab)
View Chart
(opens in a new tab)
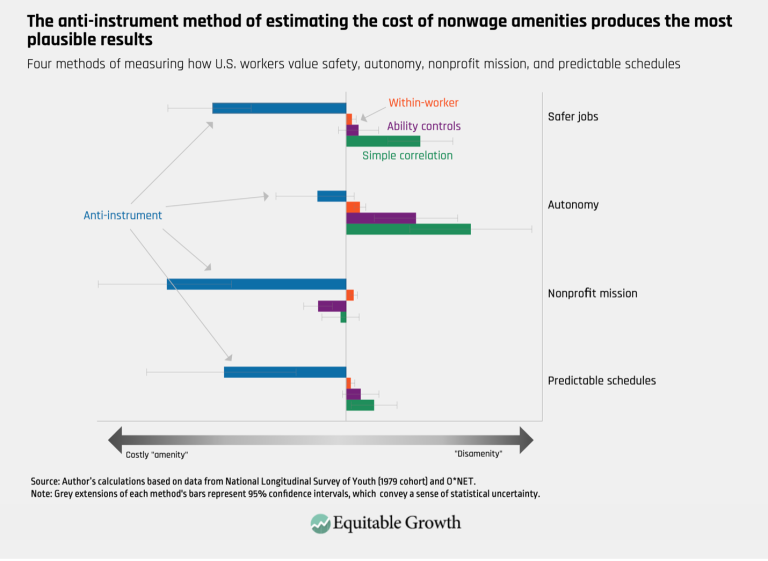
The anti-instrument method of estimating the cost of nonwage amenities produces the most plausible results (opens in a new tab)
Visualizations Jun 10, 2025
 View Chart
(opens in a new tab)
View Chart
(opens in a new tab)
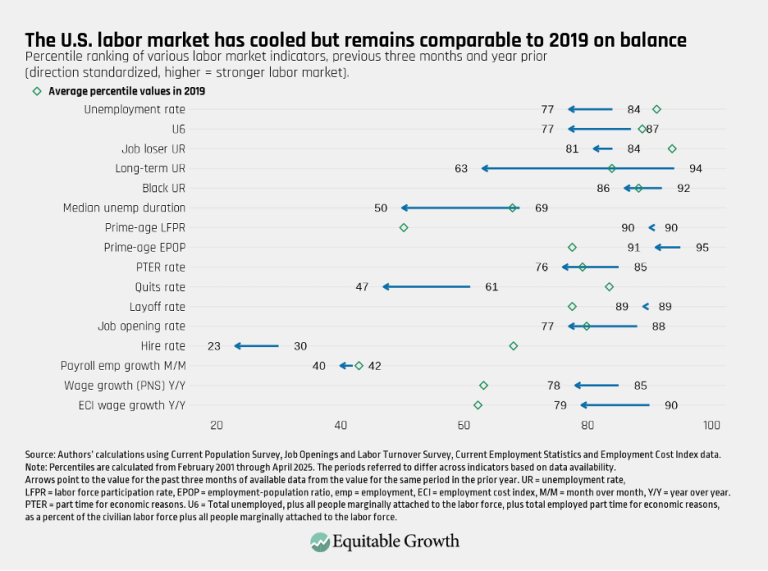
rinz fig 1 (opens in a new tab)
Visualizations May 9, 2025
 View Chart
(opens in a new tab)
View Chart
(opens in a new tab)
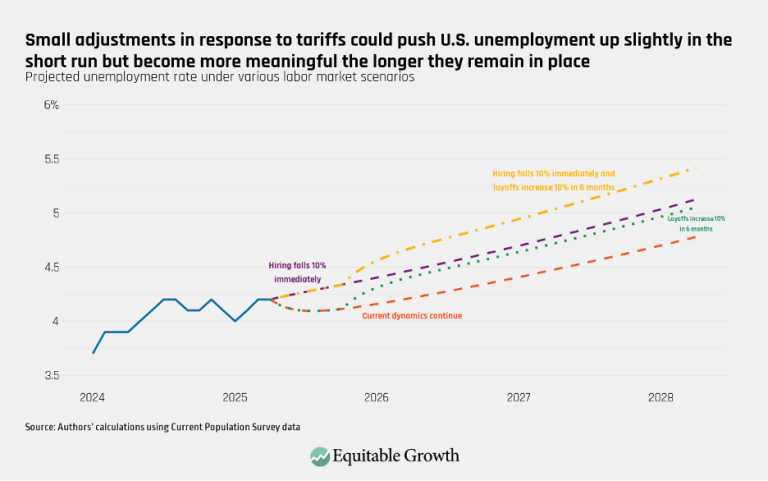
Small adjustments in response to tariffs could push U.S. unemployment up slightly in the short run but become more meaningful the longer they remain in place (opens in a new tab)
Visualizations May 9, 2025
 View Chart
(opens in a new tab)
View Chart
(opens in a new tab)
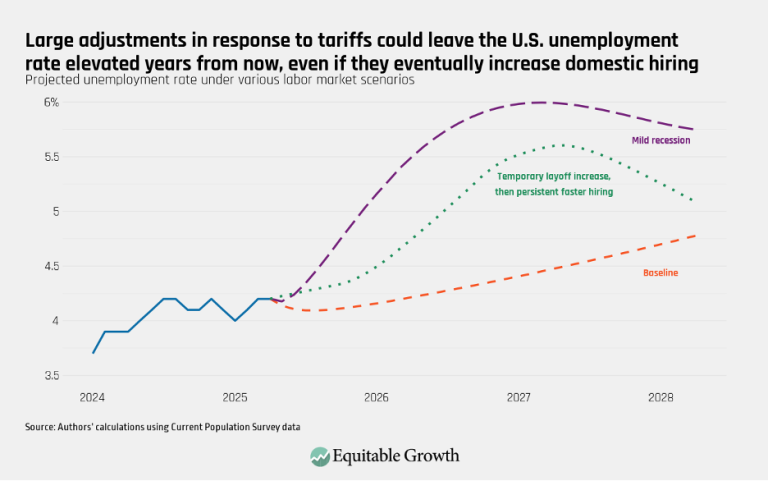
rinz fig 3 (opens in a new tab)
Visualizations May 9, 2025
 View Chart
(opens in a new tab)
View Chart
(opens in a new tab)
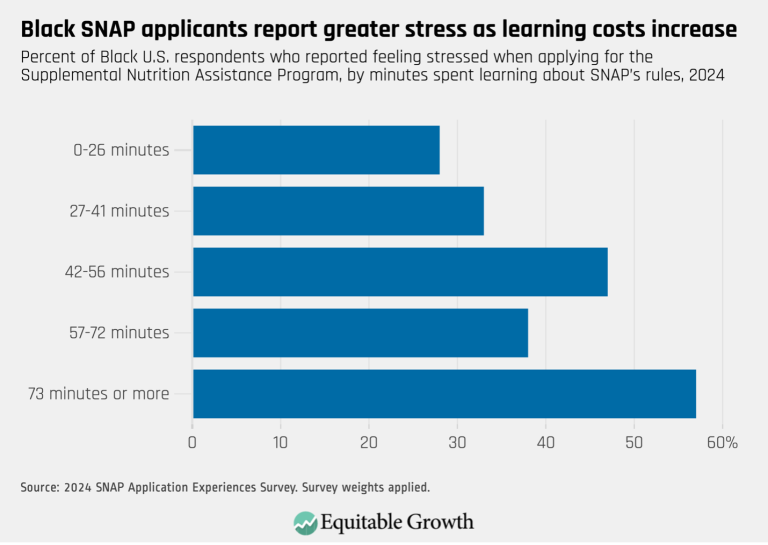
Black SNAP applicants report greater stress as learning costs increase (opens in a new tab)
Visualizations Apr 30, 2024
 View Chart
(opens in a new tab)
View Chart
(opens in a new tab)
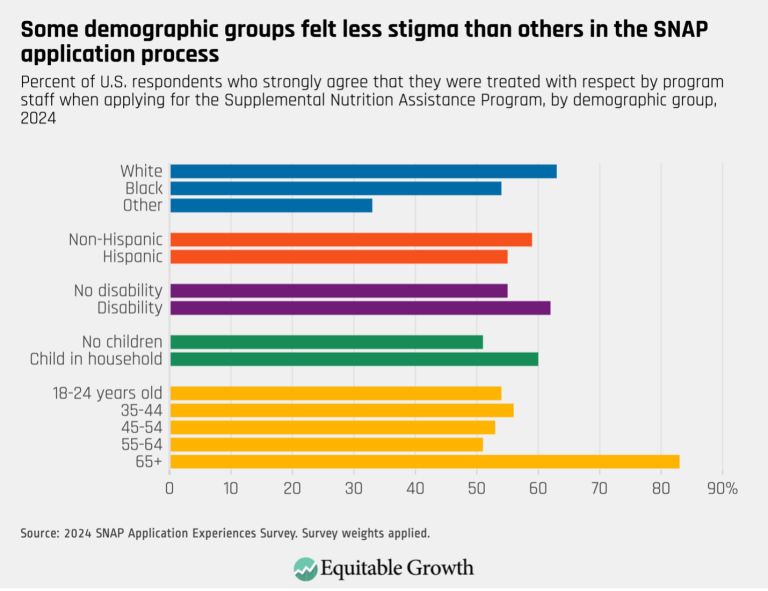
Some demographic groups felt less stigma than others in the SNAP application process (opens in a new tab)
Visualizations Apr 30, 2024
 View Chart
(opens in a new tab)
View Chart
(opens in a new tab)
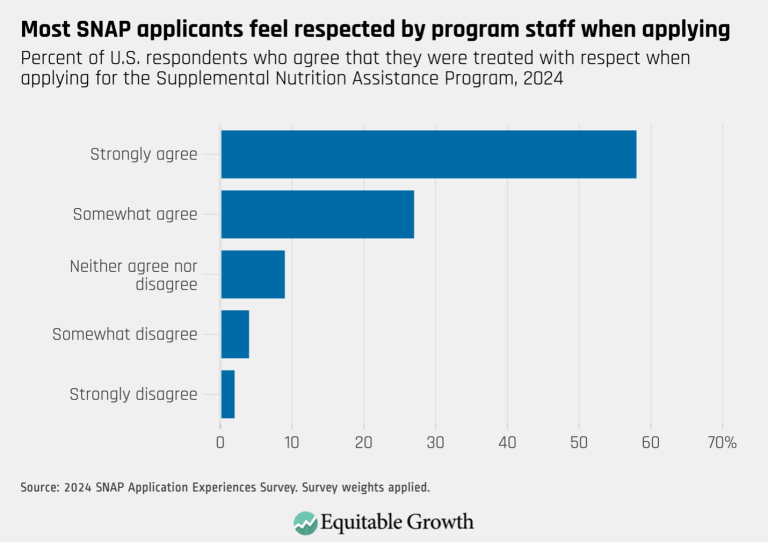
Most SNAP applicants feel respected by program staff when applying (opens in a new tab)
Visualizations Apr 30, 2024
 View Chart
(opens in a new tab)
View Chart
(opens in a new tab)
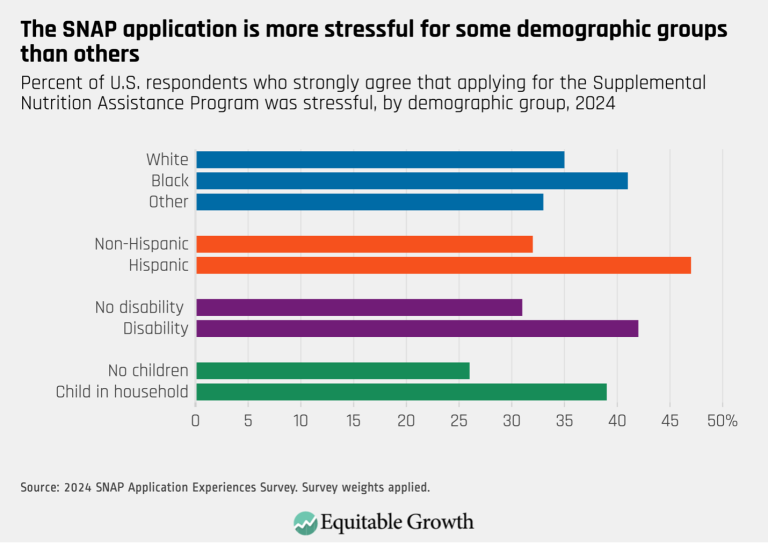
The SNAP application is more stressful for some demographic groups than others (opens in a new tab)
Visualizations Apr 30, 2024
 View Chart
(opens in a new tab)
View Chart
(opens in a new tab)
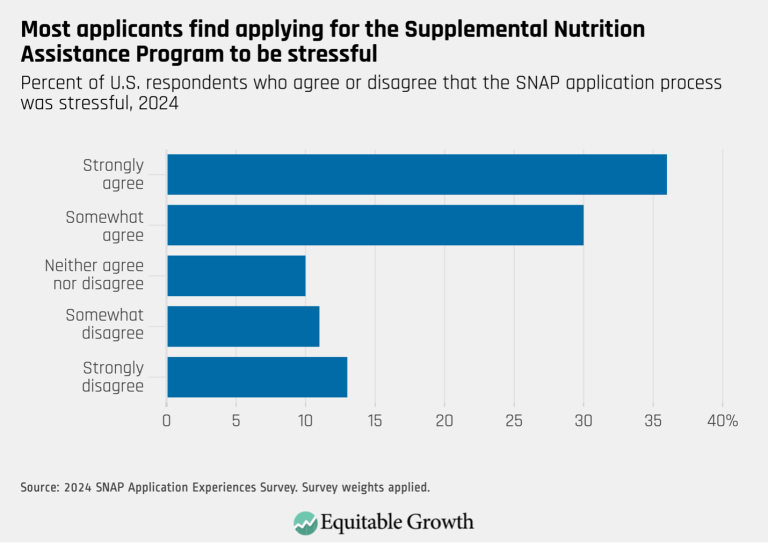
Most applicants find applying for the Supplemental Nutrition Assistance Program to be stressful (opens in a new tab)
Visualizations Apr 30, 2024
 View Chart
(opens in a new tab)
View Chart
(opens in a new tab)
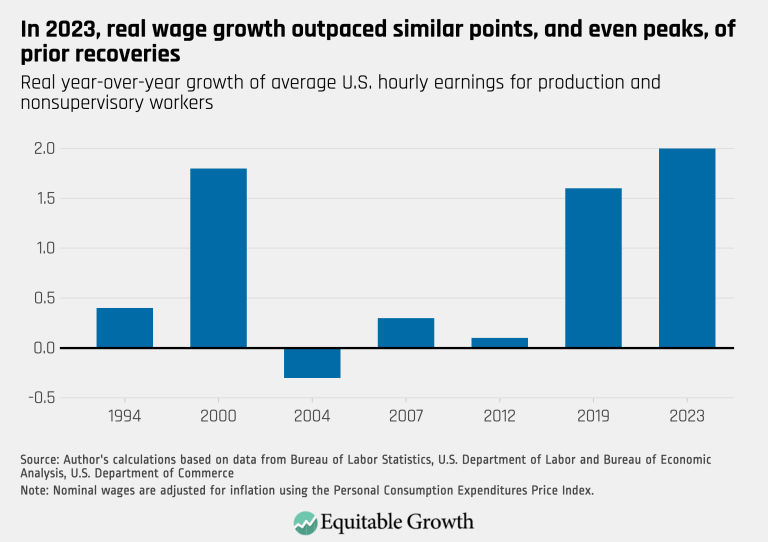
In 2023, real wage growth outpaces similar points, and even peaks, of prior recoveries (opens in a new tab)
Visualizations Mar 4, 2024
 View Chart
(opens in a new tab)
View Chart
(opens in a new tab)
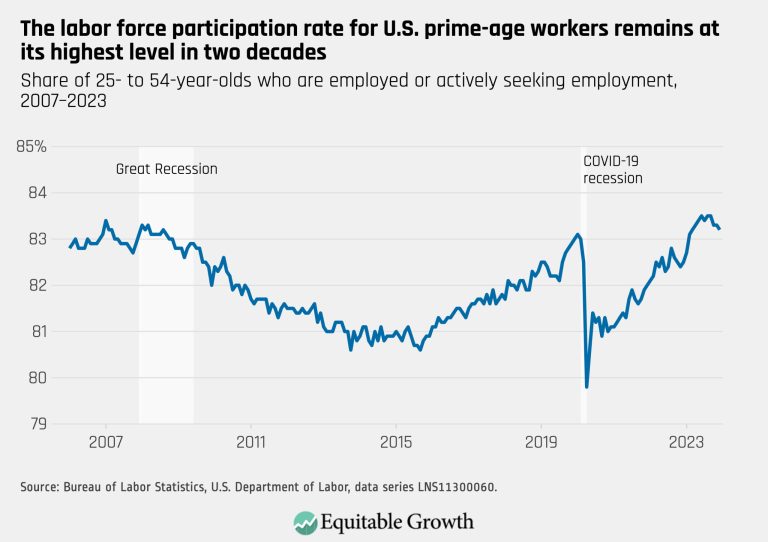
The labor force participation rate for U.S. prime-age workers remains at its highest level in two decades (opens in a new tab)
Visualizations Mar 4, 2024
 View Chart
(opens in a new tab)
View Chart
(opens in a new tab)
Personal loan delinquency is low or within normal levels for all major loan types (opens in a new tab)
Visualizations Feb 20, 2024
 View Chart
(opens in a new tab)
View Chart
(opens in a new tab)
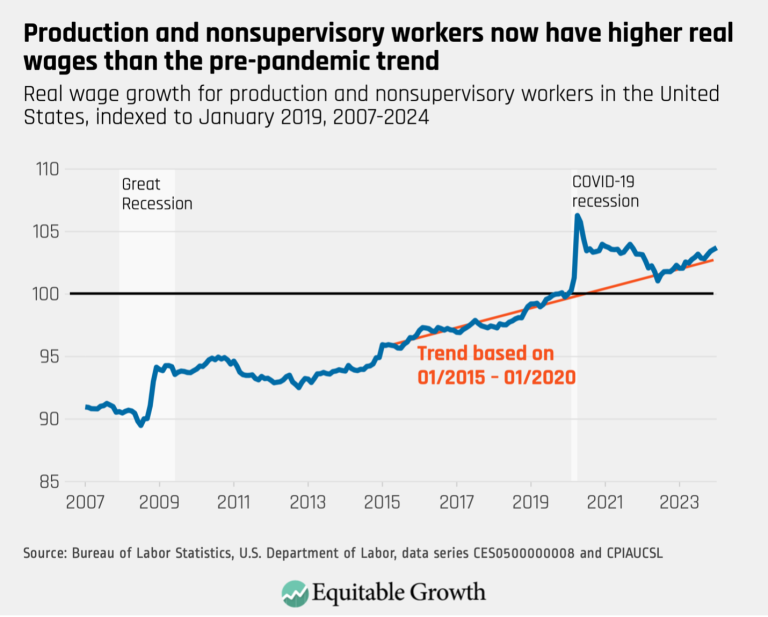
Production and nonsupervisory workers now have higher real wages than the pre-pandemic trend (opens in a new tab)
Visualizations Feb 20, 2024
 View Chart
(opens in a new tab)
View Chart
(opens in a new tab)
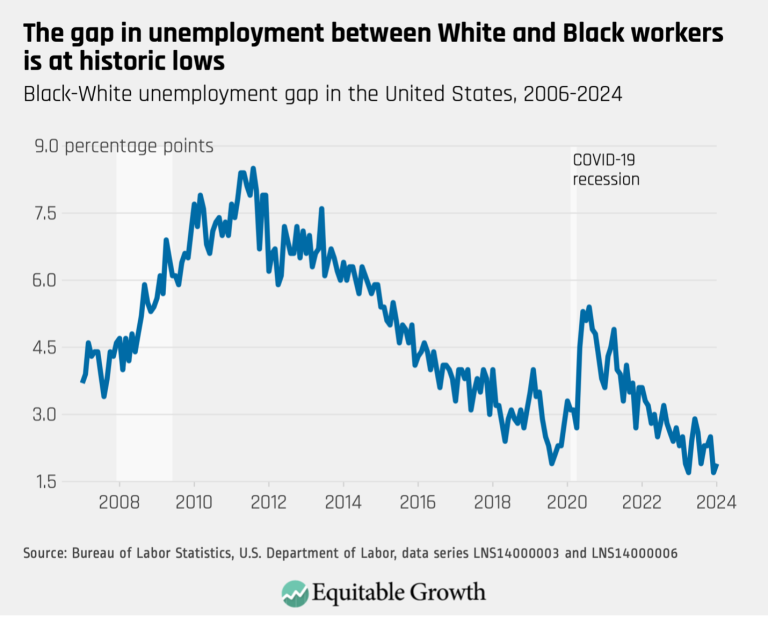
The gap in unemployment between White and Black workers is at historic lows (opens in a new tab)
Visualizations Feb 20, 2024
 View Chart
(opens in a new tab)
View Chart
(opens in a new tab)
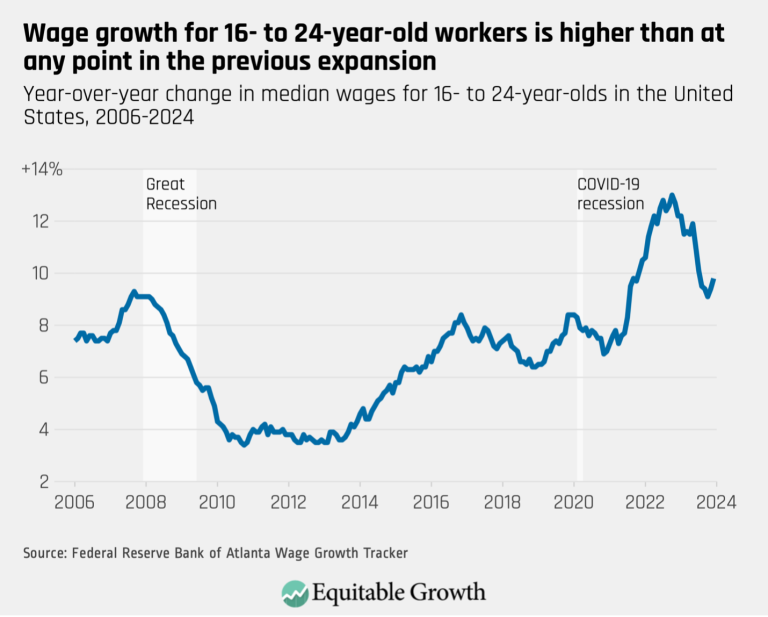
Wage growth for 16- to 24-year-old workers is higher than at any point in the previous expansion (opens in a new tab)
Visualizations Feb 20, 2024
 View Chart
(opens in a new tab)
View Chart
(opens in a new tab)
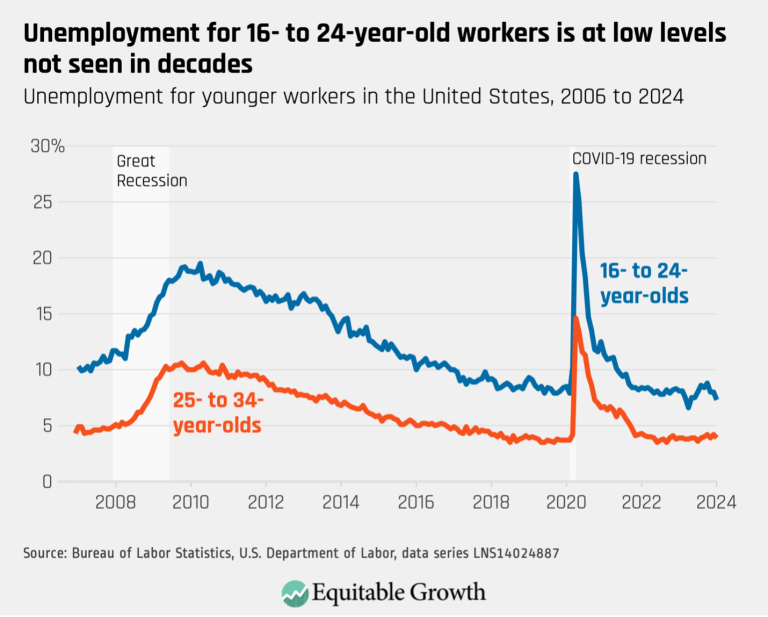
Unemployment for 16- to 24-year-old workers is at low levels not seen in decades (opens in a new tab)
Visualizations Feb 20, 2024
 View Chart
(opens in a new tab)
View Chart
(opens in a new tab)
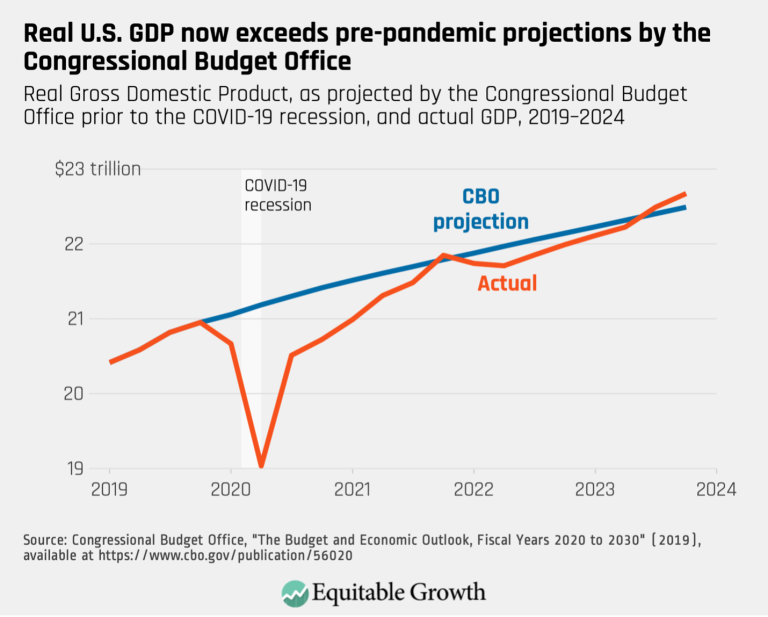
Real U.S. GDP now exceeds pre-pandemic projections by the Congressional budget Office (opens in a new tab)
Visualizations Feb 20, 2024
 View Chart
(opens in a new tab)
View Chart
(opens in a new tab)
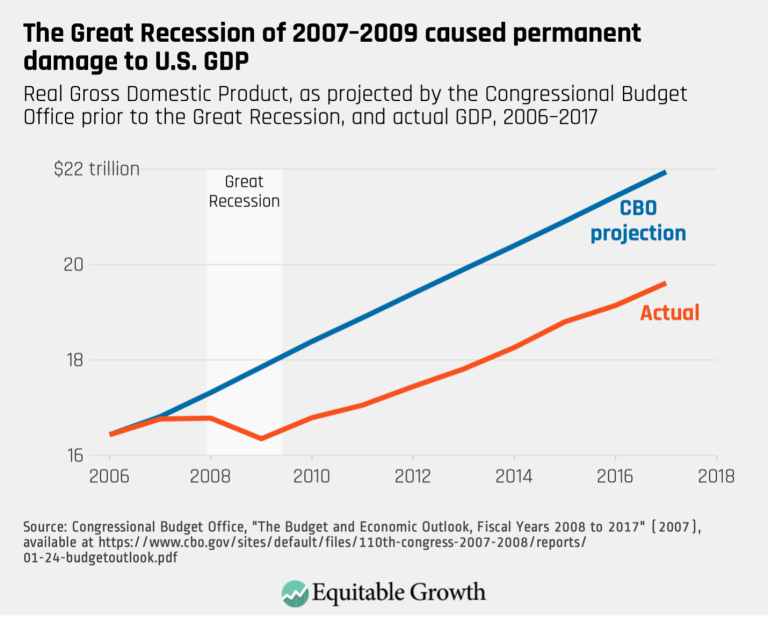
The Great Recession of 2007-2009 caused permanent damage to U.S. GDP (opens in a new tab)
Visualizations Feb 20, 2024
 View Chart
(opens in a new tab)
View Chart
(opens in a new tab)
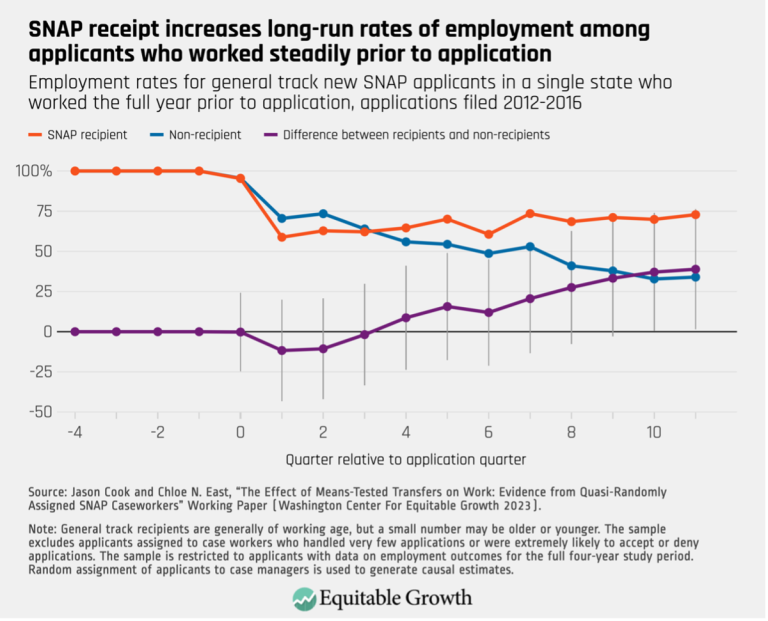
SNAP receipt increases long-run rates of employment among applicants who worked steadily prior to application (opens in a new tab)
Visualizations Nov 8, 2023
 View Chart
(opens in a new tab)
View Chart
(opens in a new tab)
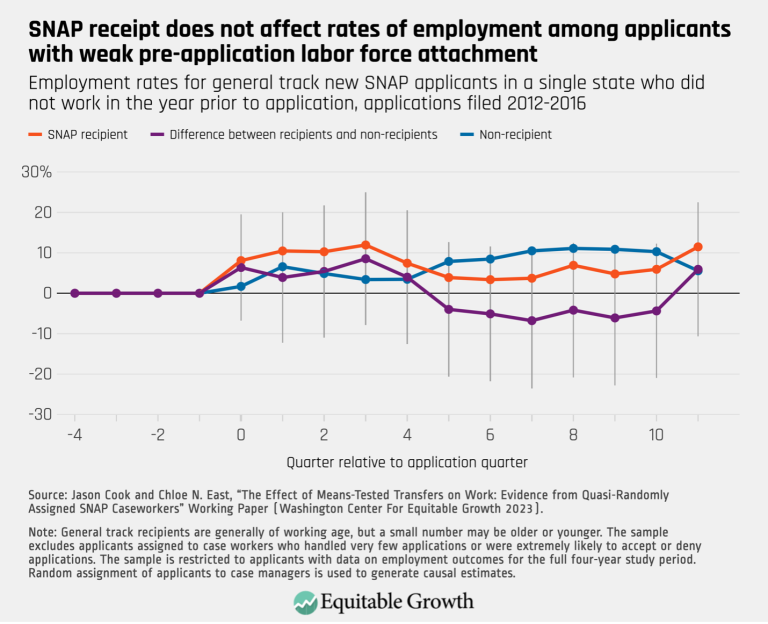
SNAP receipt does not affect rates of employment among applicants with weak pre-application labor force attachment (opens in a new tab)
Visualizations Nov 8, 2023
 View Chart
(opens in a new tab)
View Chart
(opens in a new tab)
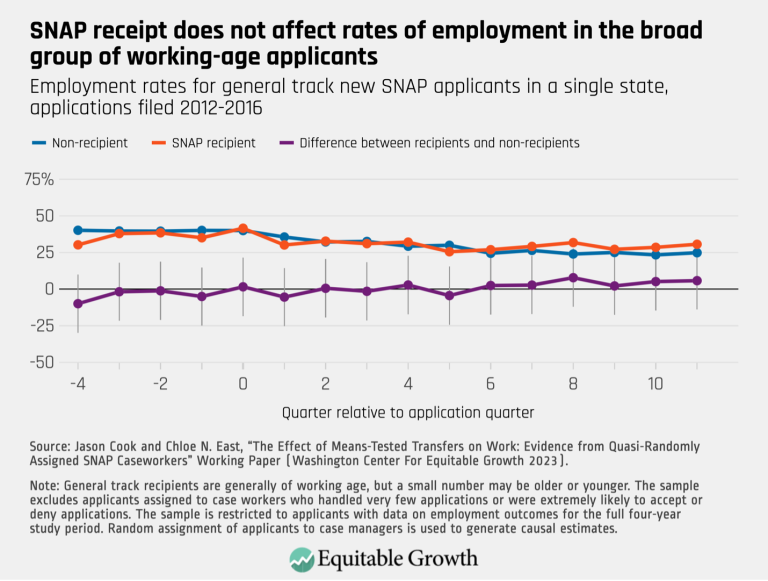
SNAP receipt does not affect rates of employment in the broad group of working-age applicant (opens in a new tab)
Visualizations Nov 8, 2023
 View Chart
(opens in a new tab)
View Chart
(opens in a new tab)
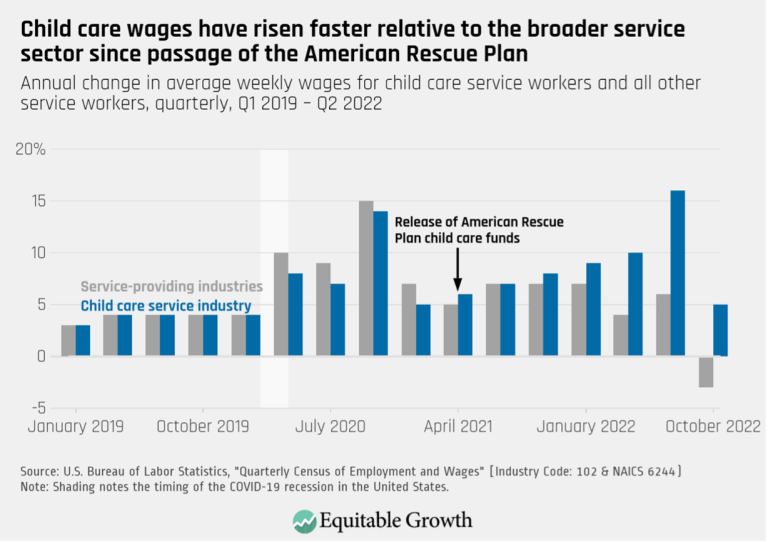
Child care wages have risen faster relative to the broader service sector since passage of the American Rescue Plan (opens in a new tab)
Visualizations Oct 31, 2023
 View Chart
(opens in a new tab)
View Chart
(opens in a new tab)
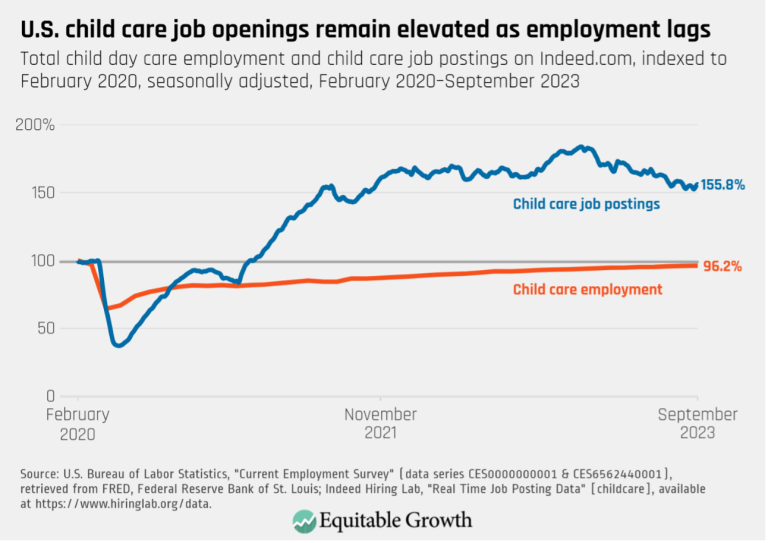
U.S. child care job openings remain elevated as employment lags (opens in a new tab)
Visualizations Oct 31, 2023
 View Chart
(opens in a new tab)
View Chart
(opens in a new tab)
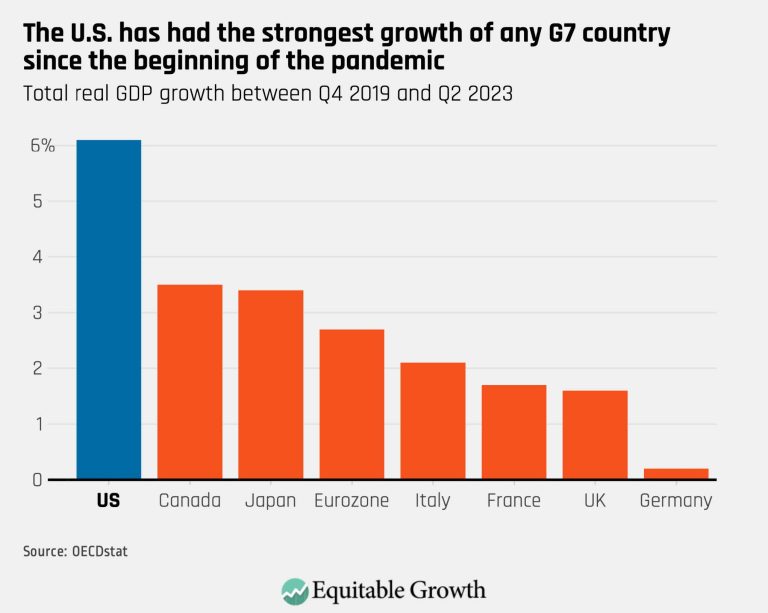
The U.S. has had the strongest growth of any G7 country since the beginning of the pandemic (opens in a new tab)
Visualizations Sep 20, 2023
 View Chart
(opens in a new tab)
View Chart
(opens in a new tab)
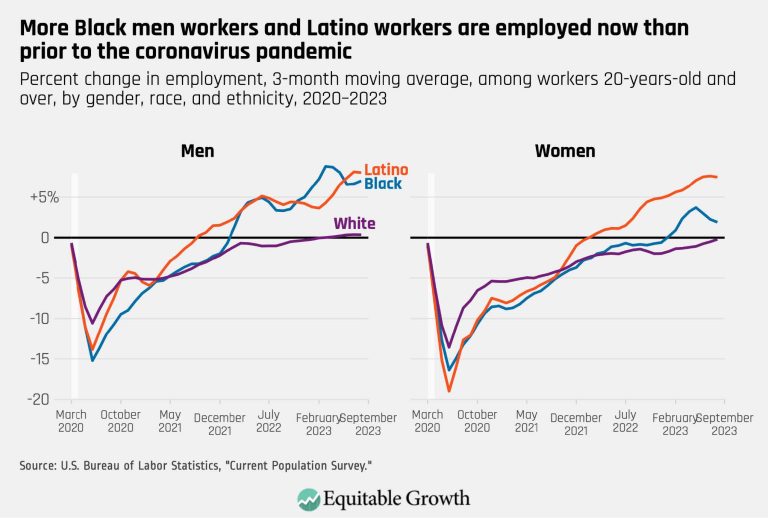
More Black men workers and Latino workers are employed now than prior to the coronavirus pandemic (opens in a new tab)
Visualizations Sep 20, 2023
 View Chart
(opens in a new tab)
View Chart
(opens in a new tab)
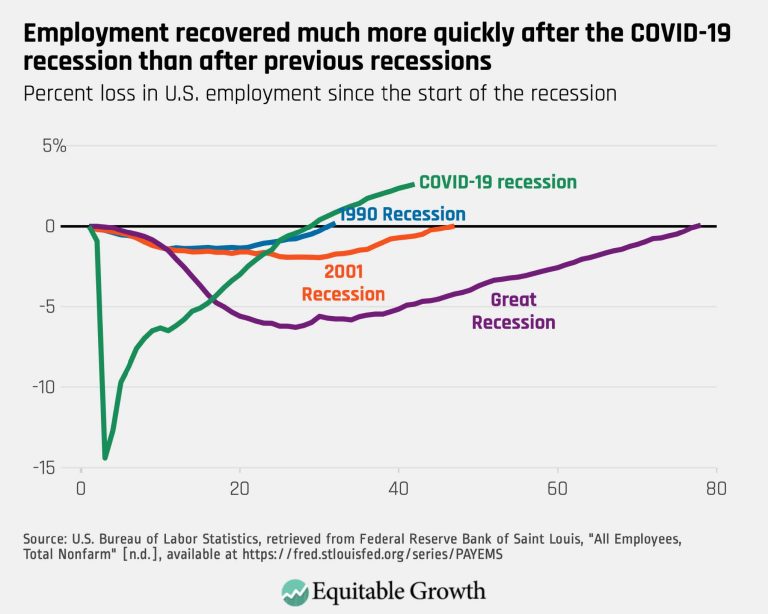
Employment recovered much more quickly after the COVID-19 recession than after previous recessions (opens in a new tab)
Visualizations Sep 20, 2023
 View Chart
(opens in a new tab)
View Chart
(opens in a new tab)
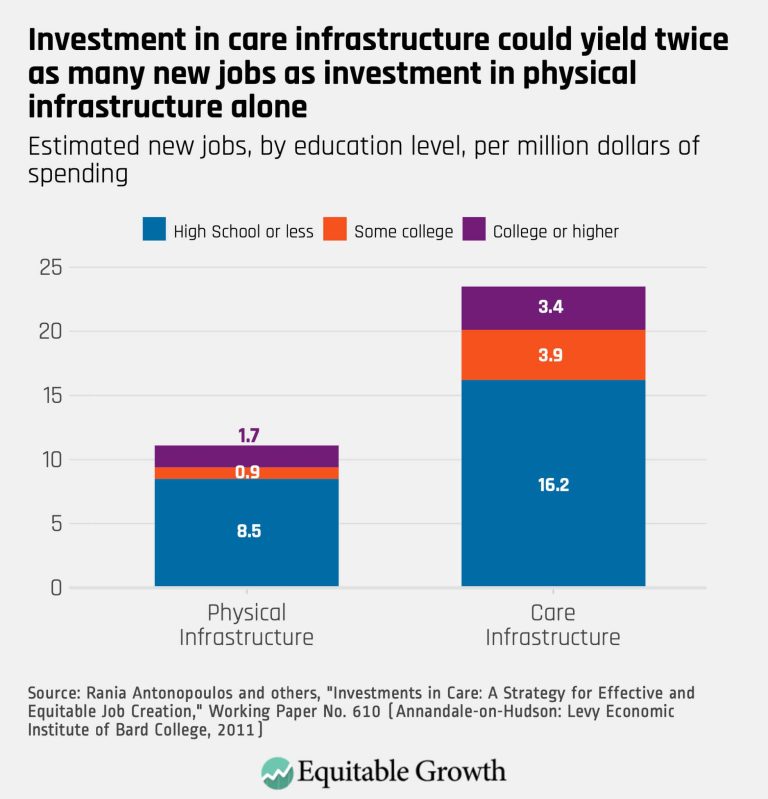
Investment in care infrastructure could yield twice as many new jobs as investment in physical infrastructure alone (opens in a new tab)
Visualizations Sep 19, 2023
 View Chart
(opens in a new tab)
View Chart
(opens in a new tab)
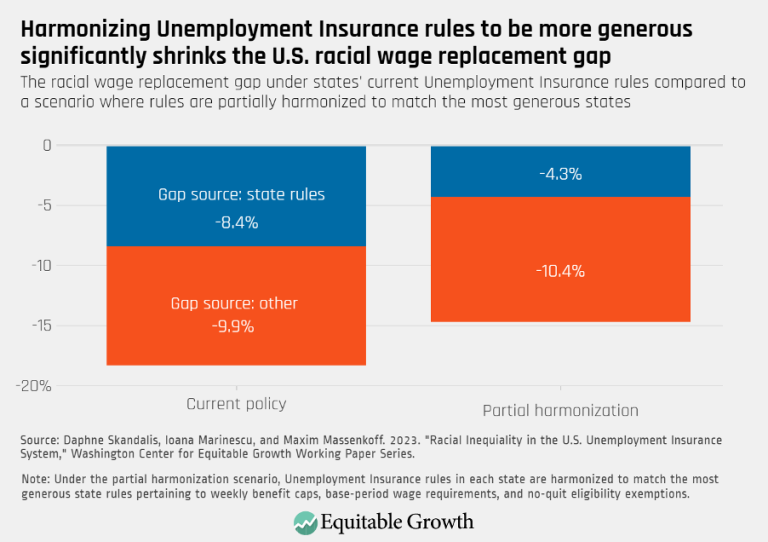
Harmonizing Unemployment Insurance rules to be more generous significantly shrinks the U.S. racial wage replacement gap (opens in a new tab)
Visualizations Jul 19, 2023
 View Chart
(opens in a new tab)
View Chart
(opens in a new tab)
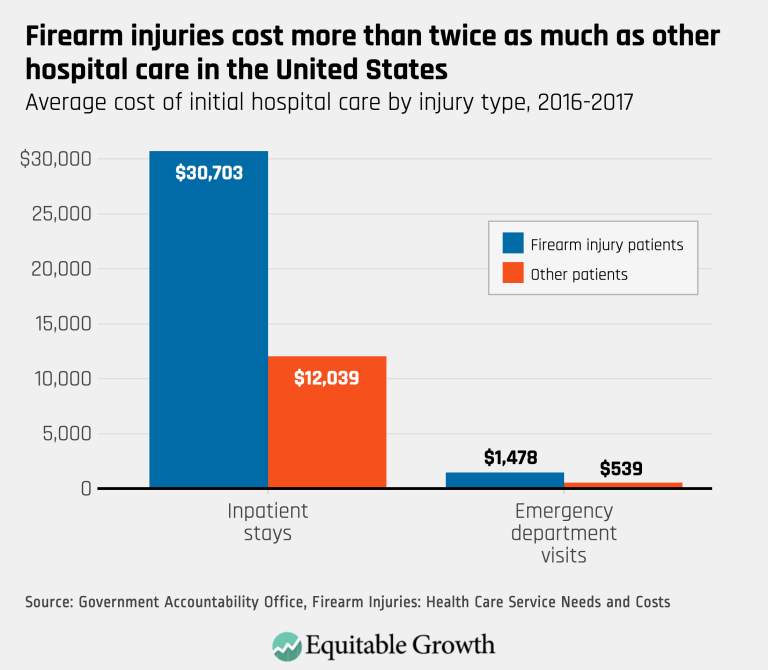
Firearm injuries cost more than twice as much as other hospital care in the United States (opens in a new tab)
Visualizations Jul 13, 2023
 View Chart
(opens in a new tab)
View Chart
(opens in a new tab)
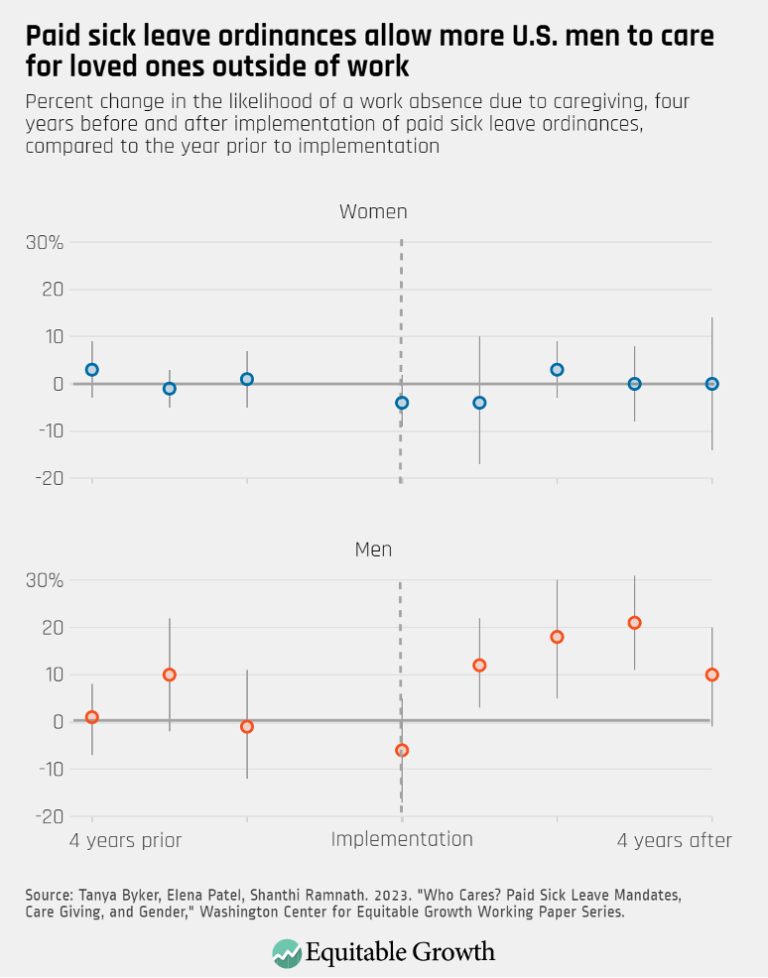
Paid sick leave ordinances allow more U.S. men to care for loved ones outside of work (opens in a new tab)
Visualizations Jun 15, 2023
 View Chart
(opens in a new tab)
View Chart
(opens in a new tab)
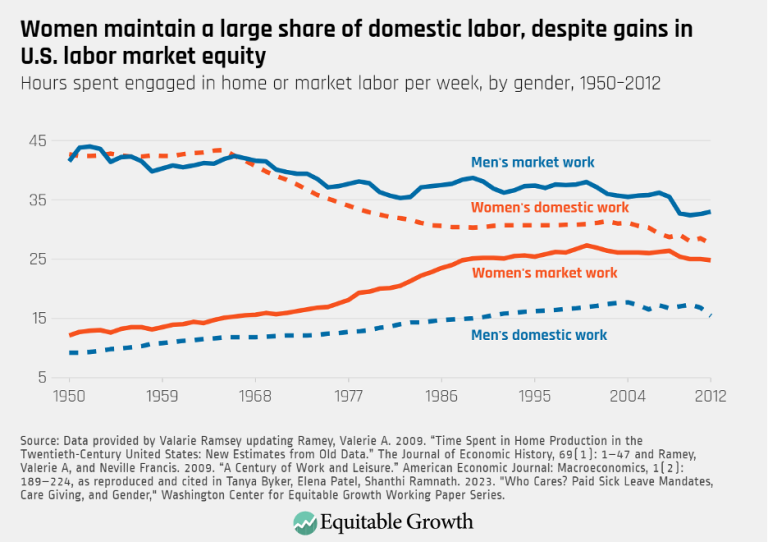
Women maintain a large share of domestic labor, despite gains in U.S. labor market equity (opens in a new tab)
Visualizations Jun 15, 2023
 View Chart
(opens in a new tab)
View Chart
(opens in a new tab)
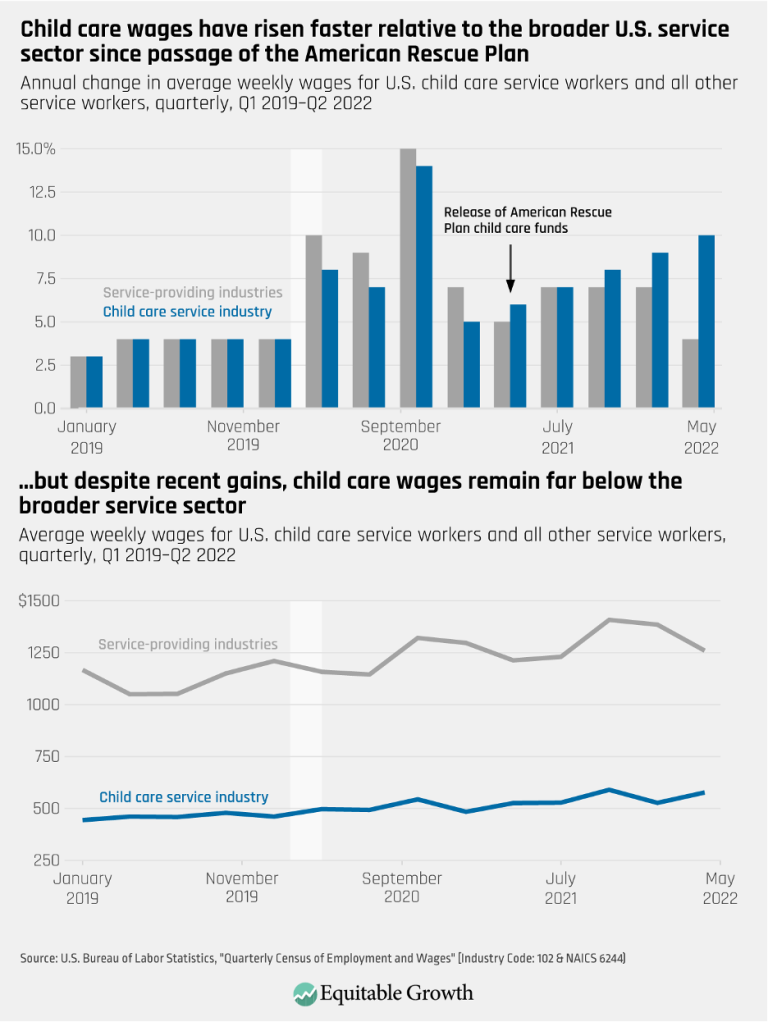
Child care wages have risen faster relative to the broader U.S. service sector since passage of the American Rescue Plan (opens in a new tab)
Visualizations Apr 27, 2023
 View Chart
(opens in a new tab)
View Chart
(opens in a new tab)
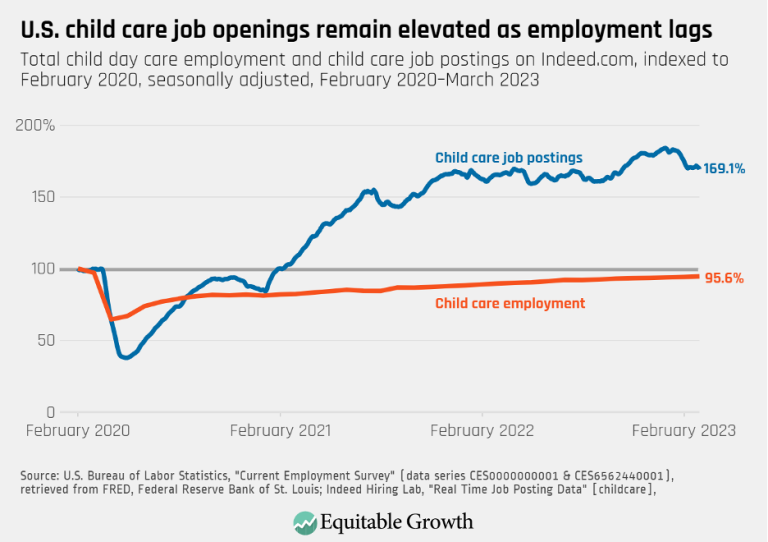
U.S. child care job openings remain elevated as employment lags (opens in a new tab)
Visualizations Apr 27, 2023
 View Chart
(opens in a new tab)
View Chart
(opens in a new tab)
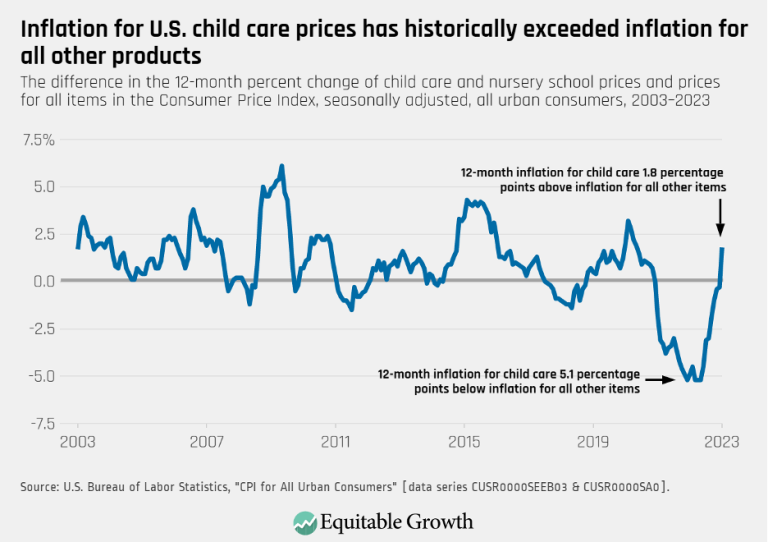
Inflation for U.S. child care prices has historically exceeded inflation for all other products (opens in a new tab)
Visualizations Apr 27, 2023
 View Chart
(opens in a new tab)
View Chart
(opens in a new tab)
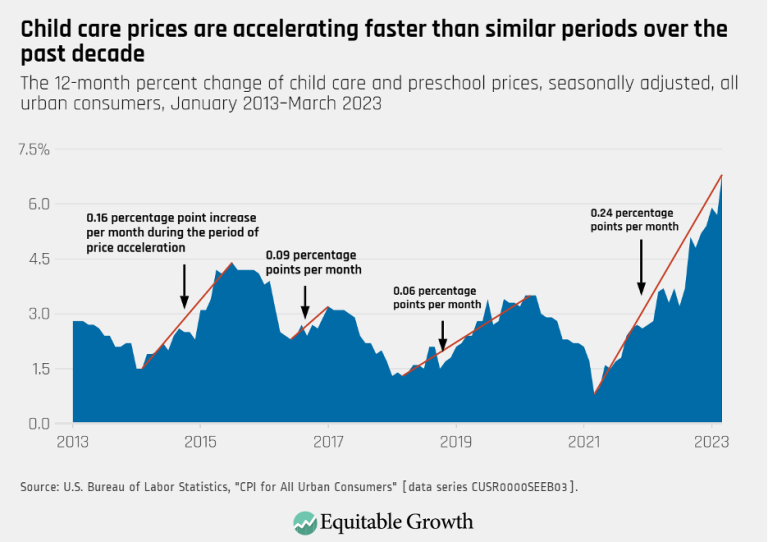
Child care prices are accelerating faster than similar periods over the past decade (opens in a new tab)
Visualizations Apr 27, 2023
 View Chart
(opens in a new tab)
View Chart
(opens in a new tab)
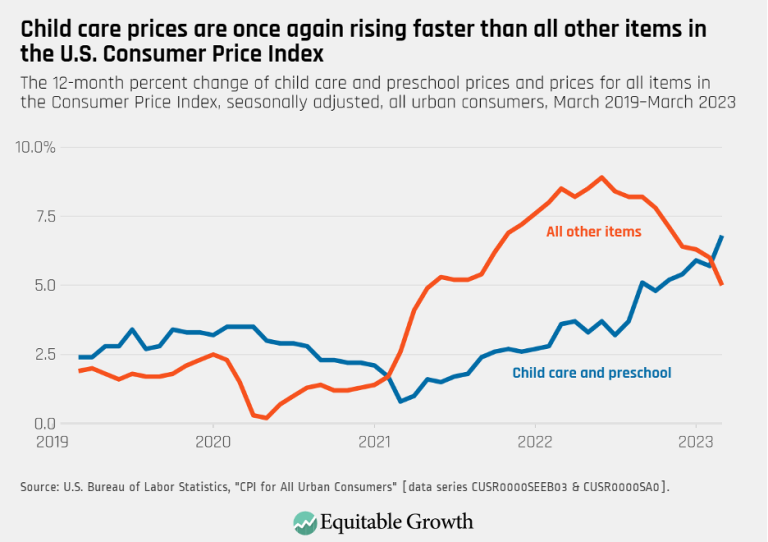
Child care prices are once again rising faster than all other items in the U.S. Consumer Price Index (opens in a new tab)
Visualizations Apr 27, 2023
 View Chart
(opens in a new tab)
View Chart
(opens in a new tab)
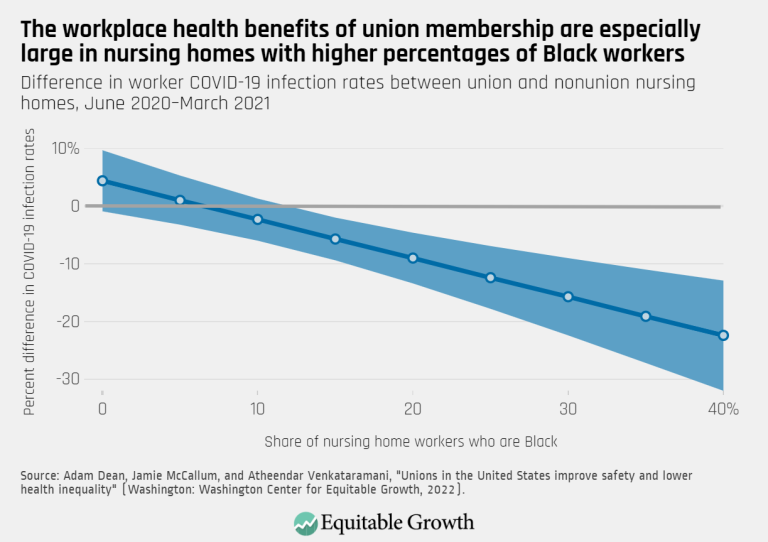
The workplace health benefits of union membership are especially large in nursing homes with higher percentages of Black workers (opens in a new tab)
Visualizations Nov 29, 2022
 View Chart
(opens in a new tab)
View Chart
(opens in a new tab)
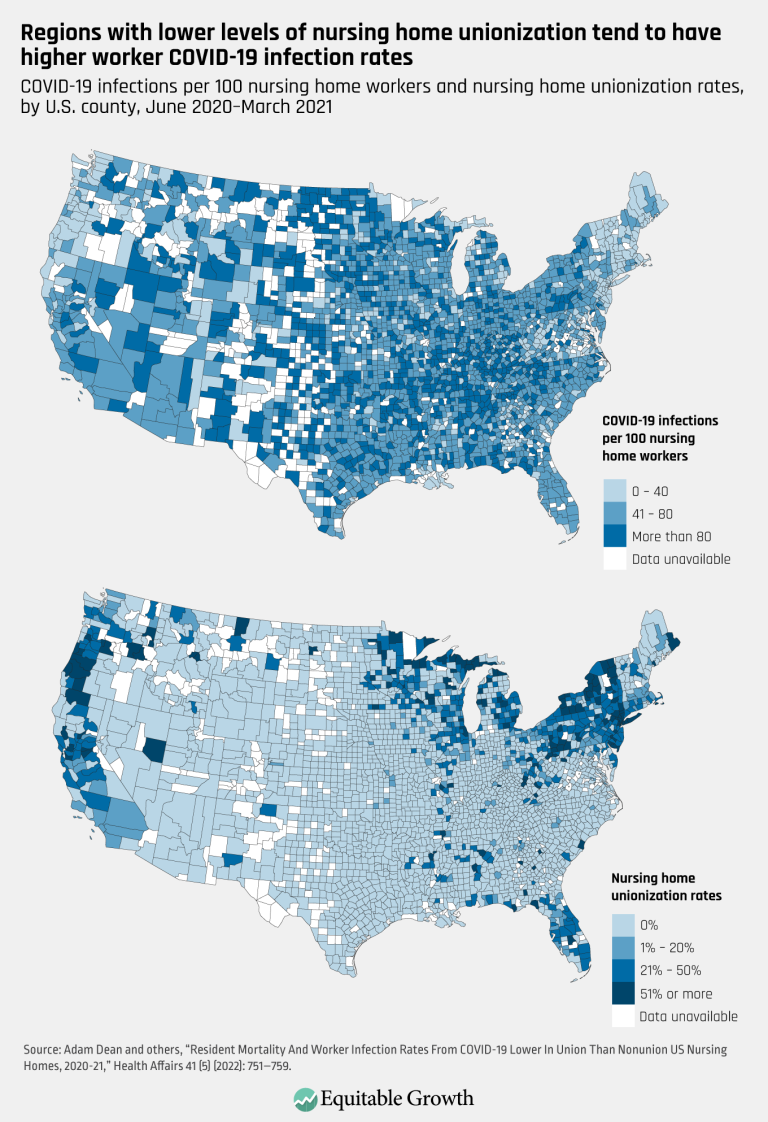
Regions with lower levels of nursing home unionization tend to have higher worker COVID-19 infection rates (opens in a new tab)
Visualizations Nov 29, 2022
 View Chart
(opens in a new tab)
View Chart
(opens in a new tab)
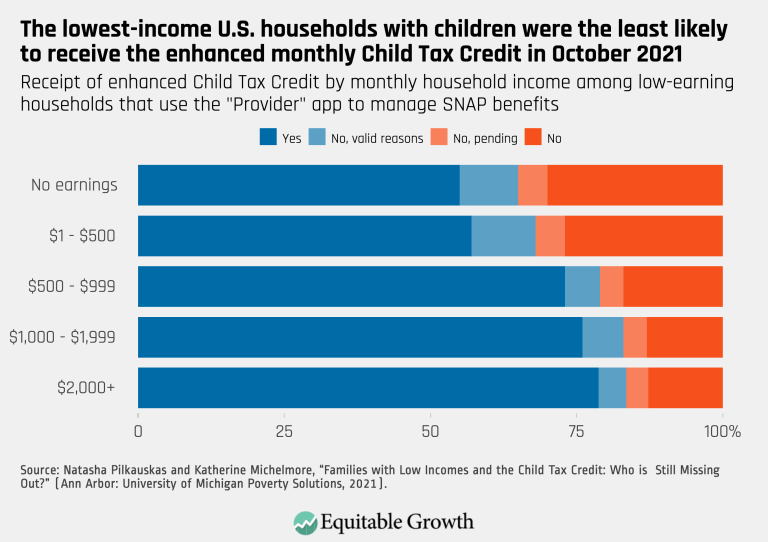
The lowest-income U.S. households with children were the least likely to receive the enhanced monthly Child Tax Credit in October 2021 (opens in a new tab)
Visualizations Nov 28, 2022
 View Chart
(opens in a new tab)
View Chart
(opens in a new tab)
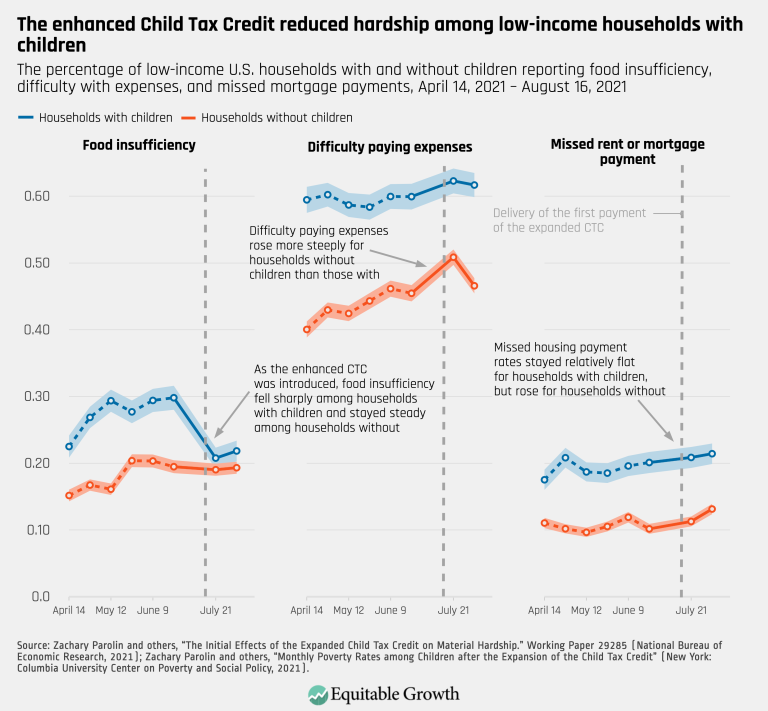
The enhanced Child Tax Credit reduced hardship among low-income households with children (opens in a new tab)
Visualizations Nov 28, 2022
 View Chart
(opens in a new tab)
View Chart
(opens in a new tab)
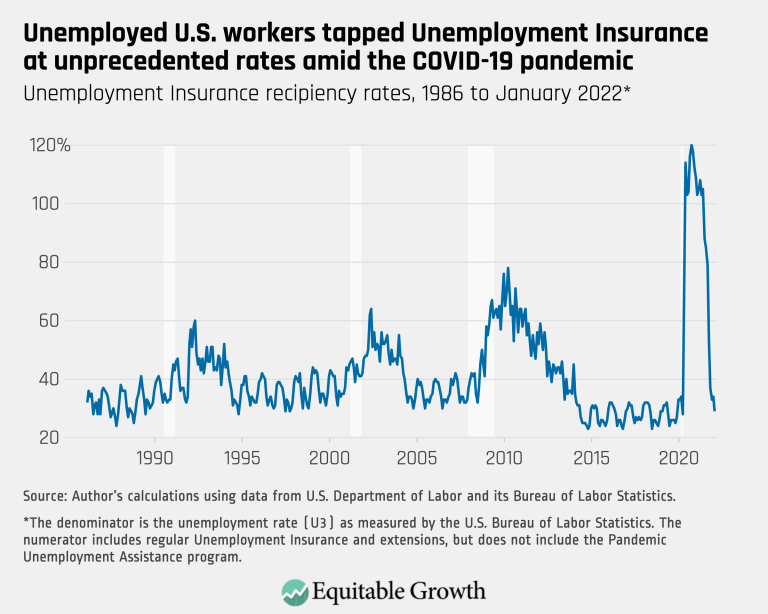
Unemployed U.S. workers tapped Unemployment Insurance at unprecedented rates amid the COVID-19 pandemic (opens in a new tab)
Visualizations Nov 17, 2022
 View Chart
(opens in a new tab)
View Chart
(opens in a new tab)
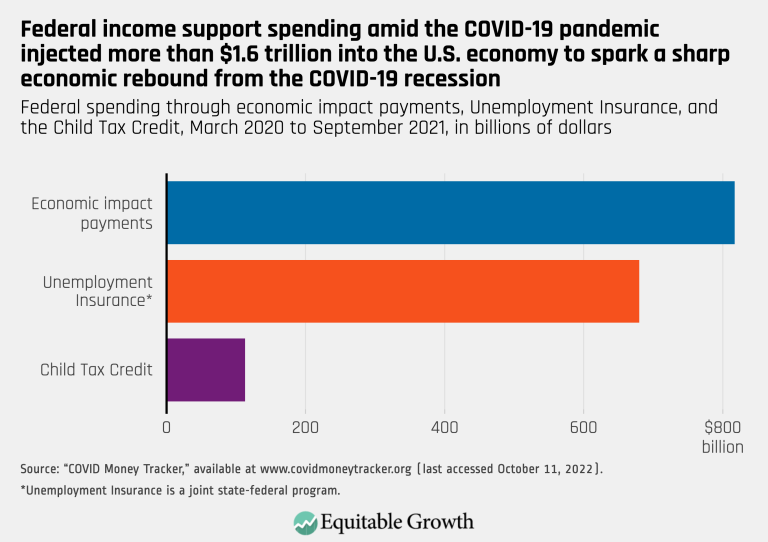
Federal income support spending amid the COVID-19 pandemic injected more than $1.6 trillion into the U.S. economy to spark a sharp economic rebound from the COVID-19 recession (opens in a new tab)
Visualizations Nov 14, 2022
 View Chart
(opens in a new tab)
View Chart
(opens in a new tab)
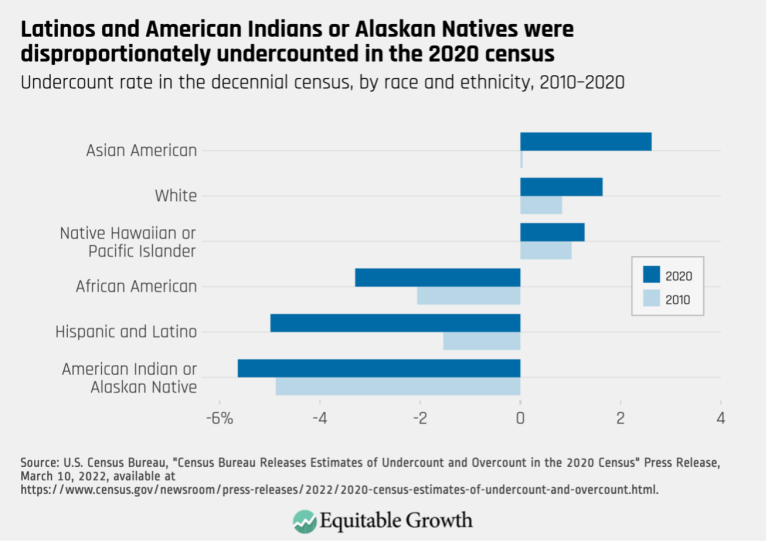
Latinos and American Indians or Alaskan Natives were disproportionately undercounted in the 2020 census (opens in a new tab)
Visualizations Oct 14, 2022
 View Chart
(opens in a new tab)
View Chart
(opens in a new tab)
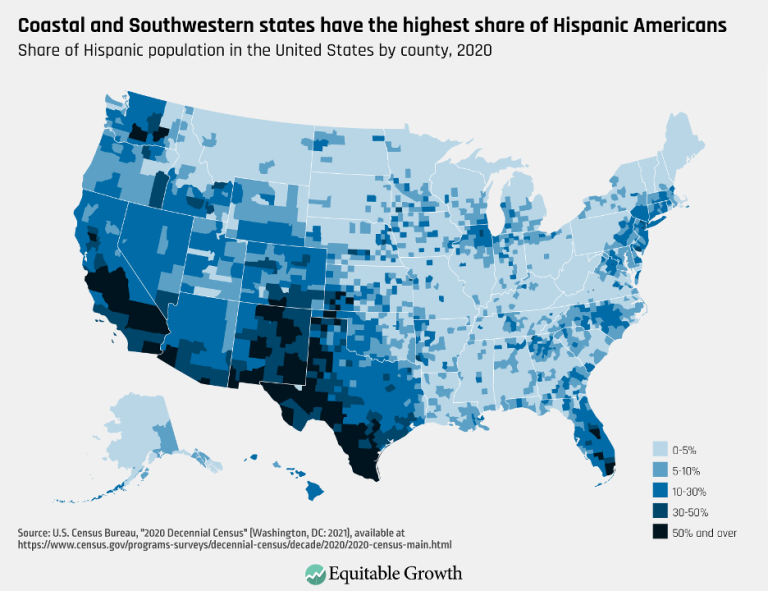
Coastal and Southwestern states have the highest share of Hispanic Americans (opens in a new tab)
Visualizations Oct 14, 2022
 View Chart
(opens in a new tab)
View Chart
(opens in a new tab)
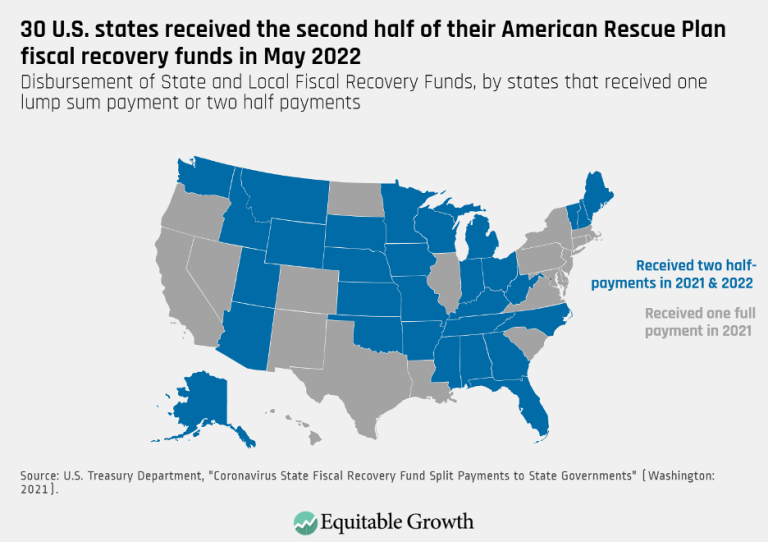
30 U.S. states received the second half of their American Rescue plan fiscal recovery funds in May 2022 (opens in a new tab)
Visualizations Sep 19, 2022
 View Chart
(opens in a new tab)
View Chart
(opens in a new tab)
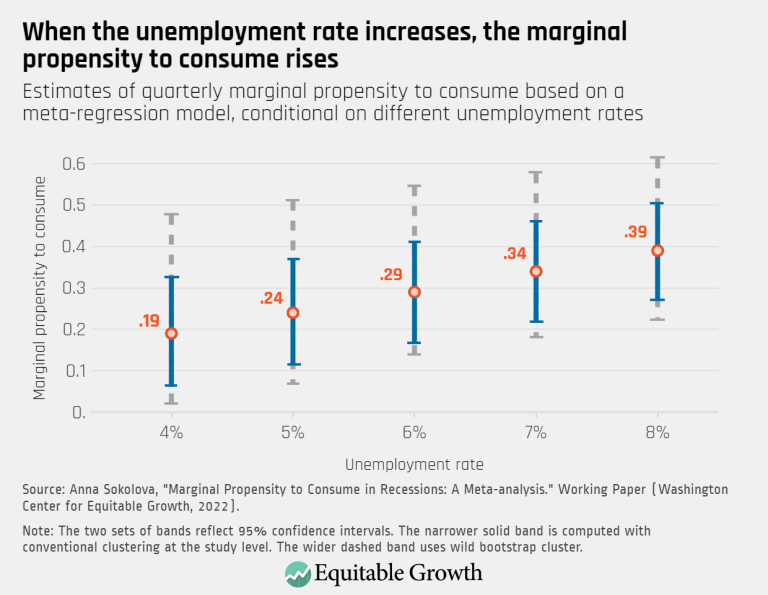
When the unemployment rate increases, the marginal propensity to consume rises (opens in a new tab)
Visualizations Sep 8, 2022
 View Chart
(opens in a new tab)
View Chart
(opens in a new tab)
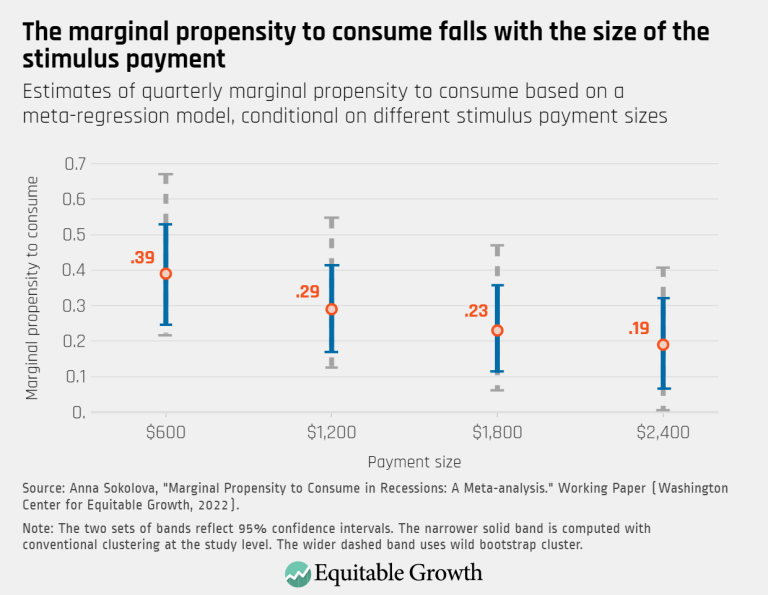
The marginal propensity to consume falls with the size of the stimulus payment (opens in a new tab)
Visualizations Sep 8, 2022
 View Chart
(opens in a new tab)
View Chart
(opens in a new tab)
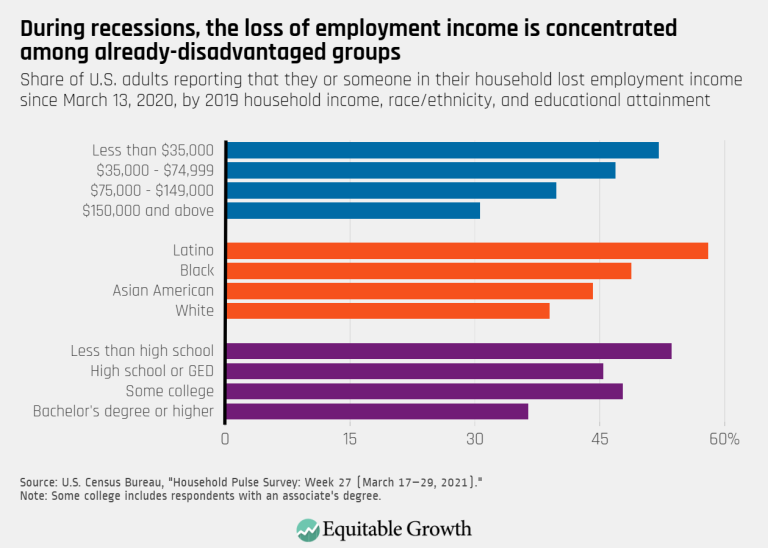
During recessions, the loss of employment income is concentrated among already-disadvantaged groups (opens in a new tab)
Visualizations Aug 12, 2022
 View Chart
(opens in a new tab)
View Chart
(opens in a new tab)
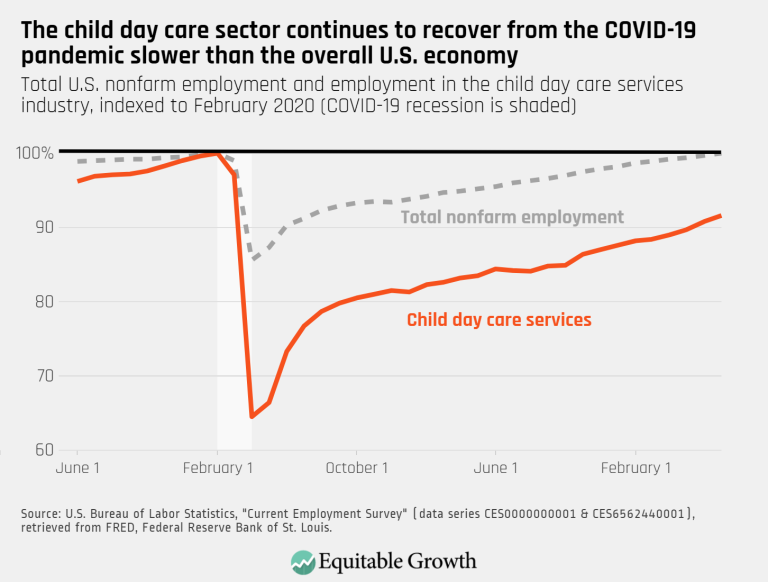
The child day care sector continues to recover from the COVID-19 pandemic slower than the overall U.S. economy (opens in a new tab)
Visualizations Aug 9, 2022
 View Chart
(opens in a new tab)
View Chart
(opens in a new tab)
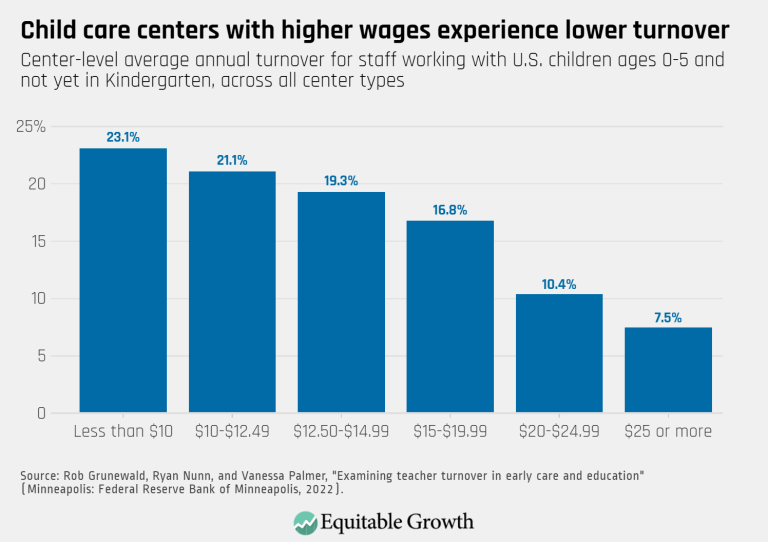
Child care centers with higher wages experience lower turnover (opens in a new tab)
Visualizations Aug 9, 2022
 View Chart
(opens in a new tab)
View Chart
(opens in a new tab)
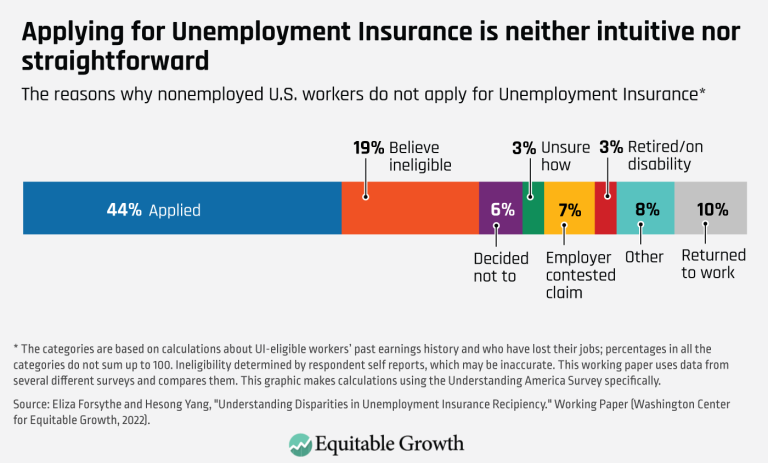
Applying for Unemployment Insurance is neither intuitive nor straightforward (opens in a new tab)
Visualizations Jul 12, 2022
 View Chart
(opens in a new tab)
View Chart
(opens in a new tab)
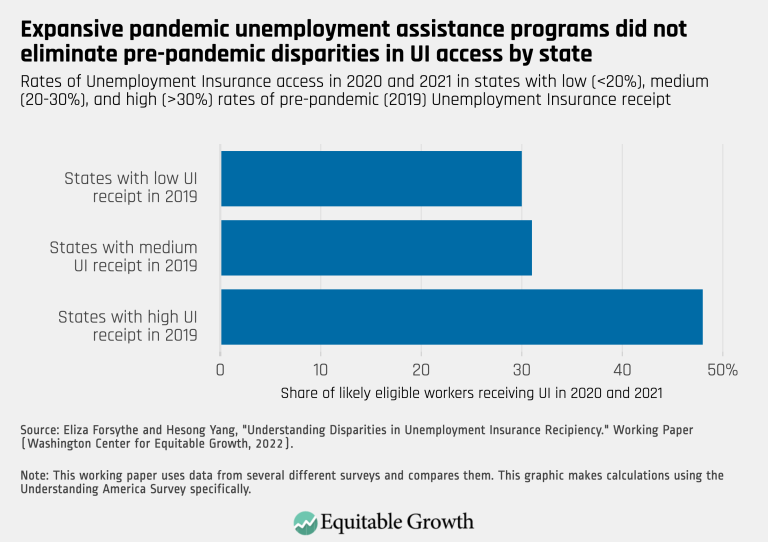
Expansive pandemic unemployment assistance programs did not eliminate pre-pandemic disparities in UI access by state (opens in a new tab)
Visualizations Jul 12, 2022
 View Chart
(opens in a new tab)
View Chart
(opens in a new tab)
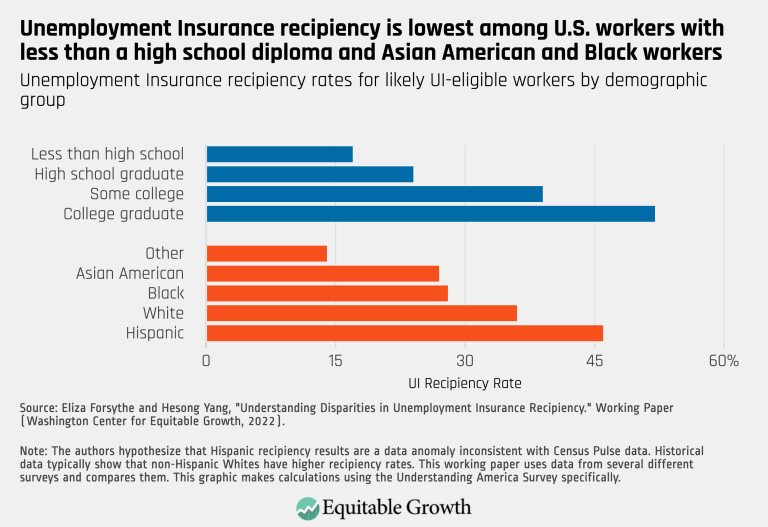
Unemployment Insurance recipiency is lowest among U.S. workers with less than a high school diploma and Asian American and Black workers (opens in a new tab)
Visualizations Jul 12, 2022
 View Chart
(opens in a new tab)
View Chart
(opens in a new tab)
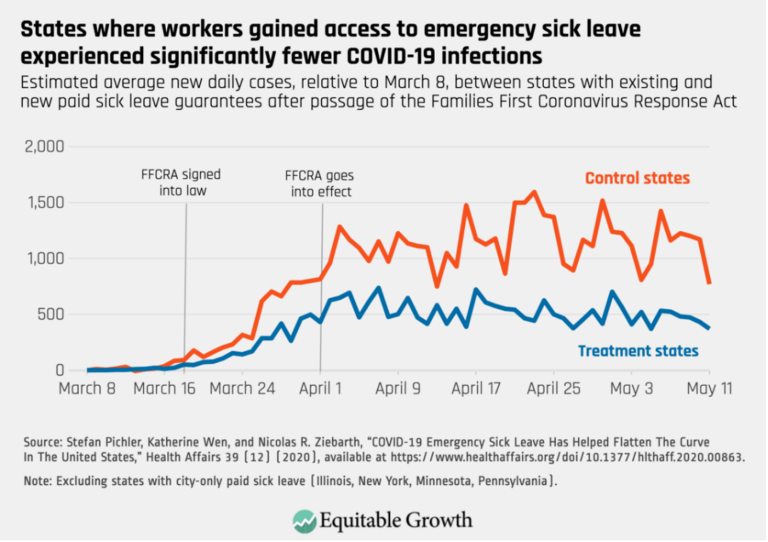
States where workers gained access to emergency sick leave experienced significantly fewer COVID-19 infections (opens in a new tab)
Visualizations Jun 30, 2022
 View Chart
(opens in a new tab)
View Chart
(opens in a new tab)
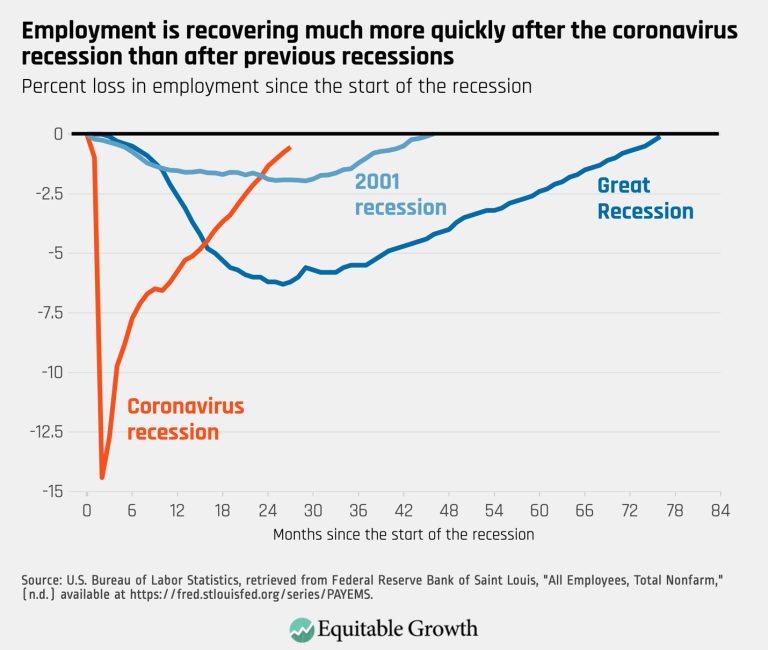
Employment is recovering much more quickly after the coronavirus recession than after previous recessions (opens in a new tab)
Visualizations Jun 3, 2022
 View Chart
(opens in a new tab)
View Chart
(opens in a new tab)
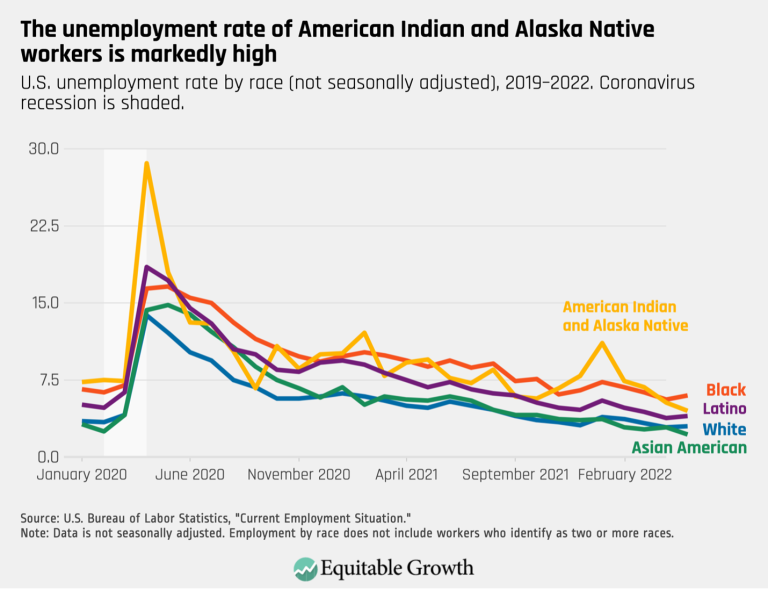
The unemployment rate of American Indian and Alaska Native workers is markedly high (opens in a new tab)
Visualizations Jun 3, 2022
 View Chart
(opens in a new tab)
View Chart
(opens in a new tab)
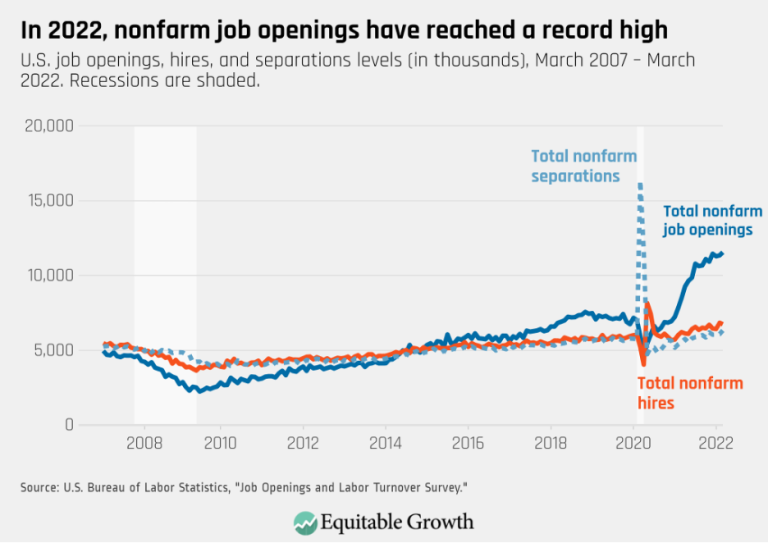
In 2022, nonfarm job openings have reached a record high (opens in a new tab)
Visualizations May 31, 2022
 View Chart
(opens in a new tab)
View Chart
(opens in a new tab)
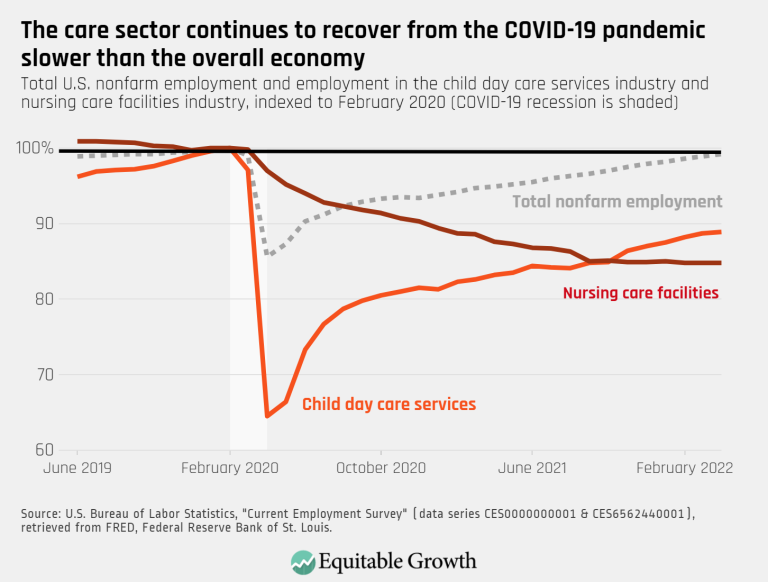
The care sector continues to recovery from the COVID-19 pandemic slower than the overall economy (opens in a new tab)
Visualizations May 24, 2022
 View Chart
(opens in a new tab)
View Chart
(opens in a new tab)
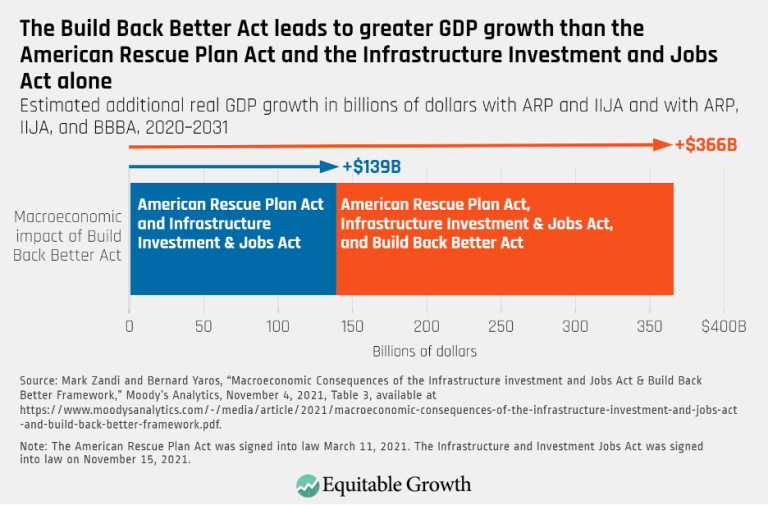
The Build Back Better Act leads to greater GDP growth than the American Rescue Plan Act and the Infrastructure Investment and Jobs Act alone (opens in a new tab)
Visualizations May 23, 2022
 View Chart
(opens in a new tab)
View Chart
(opens in a new tab)
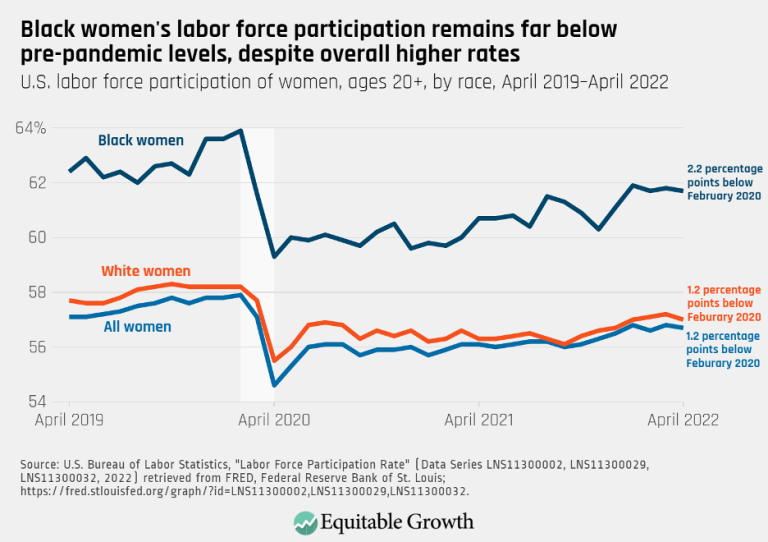
Black women’s labor force participation remains far below pre-pandemic levels, despite overall higher rates (opens in a new tab)
Visualizations May 23, 2022
 View Chart
(opens in a new tab)
View Chart
(opens in a new tab)
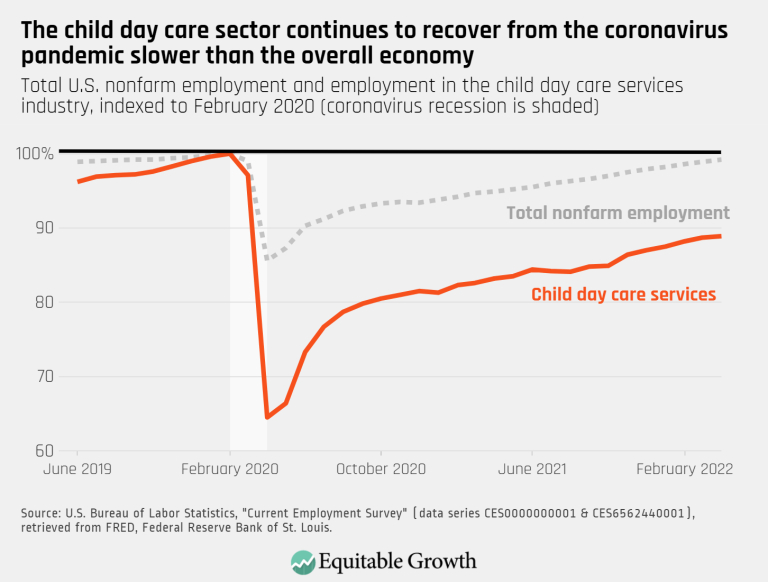
The child day care sector continues to recover from the COVID-19 pandemic slower than the overall economy (opens in a new tab)
Visualizations May 20, 2022
 View Chart
(opens in a new tab)
View Chart
(opens in a new tab)
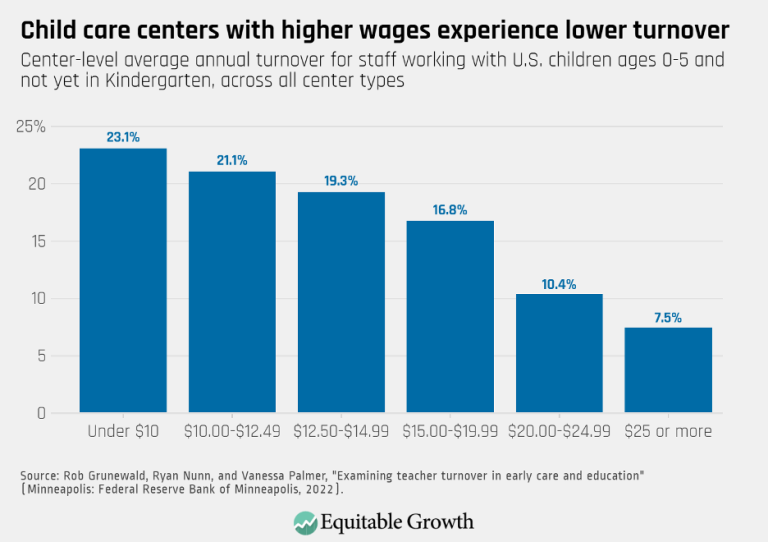
Child care centers with higher wages experience lower turnover (opens in a new tab)
Visualizations May 18, 2022
 View Chart
(opens in a new tab)
View Chart
(opens in a new tab)
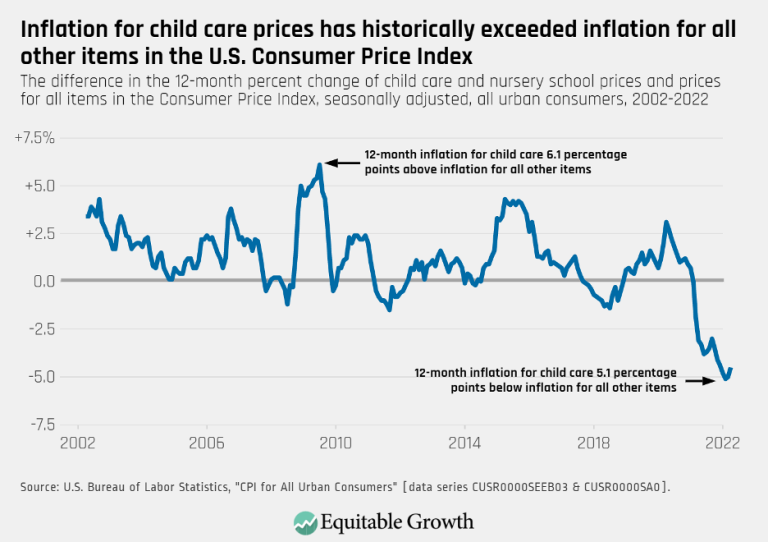
Inflation for child care prices has historically exceeded inflation for all other items in the U.S. Consumer Price Index (opens in a new tab)
Visualizations May 18, 2022
 View Chart
(opens in a new tab)
View Chart
(opens in a new tab)
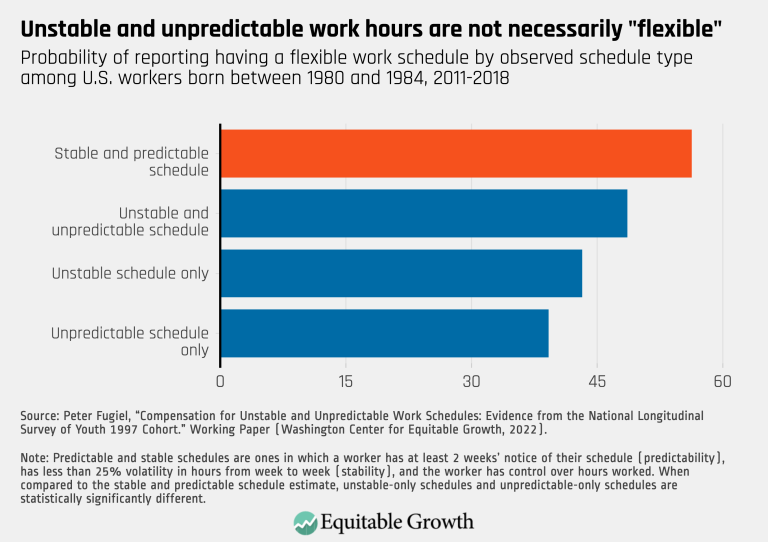
Unstable and unpredictable work hours are not necessarily “flexible” (opens in a new tab)
Visualizations Apr 13, 2022
 View Chart
(opens in a new tab)
View Chart
(opens in a new tab)
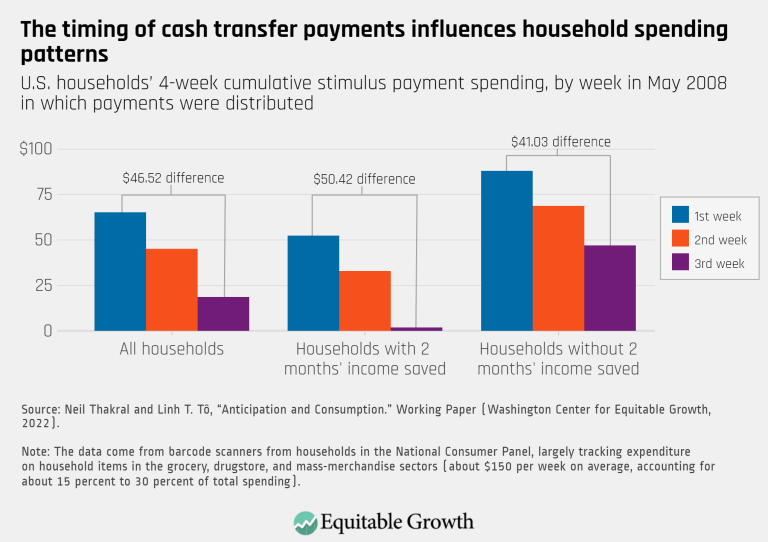
The timing of cash transfer payments influences household spending patterns (opens in a new tab)
Visualizations Feb 9, 2022
 View Chart
(opens in a new tab)
View Chart
(opens in a new tab)
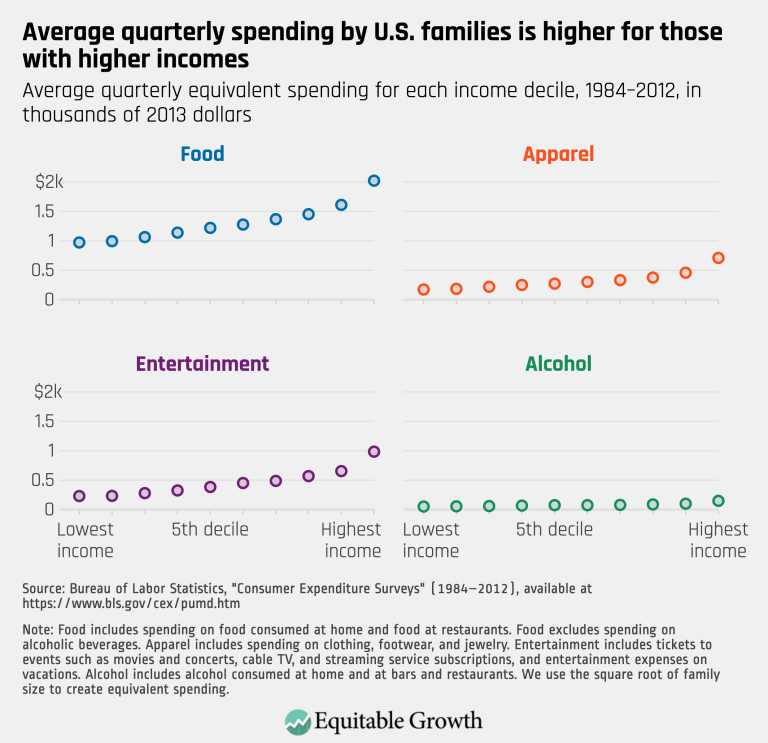
Average quarterly spending by U.S. families is higher for those with higher income (opens in a new tab)
Visualizations Feb 2, 2022
 View Chart
(opens in a new tab)
View Chart
(opens in a new tab)
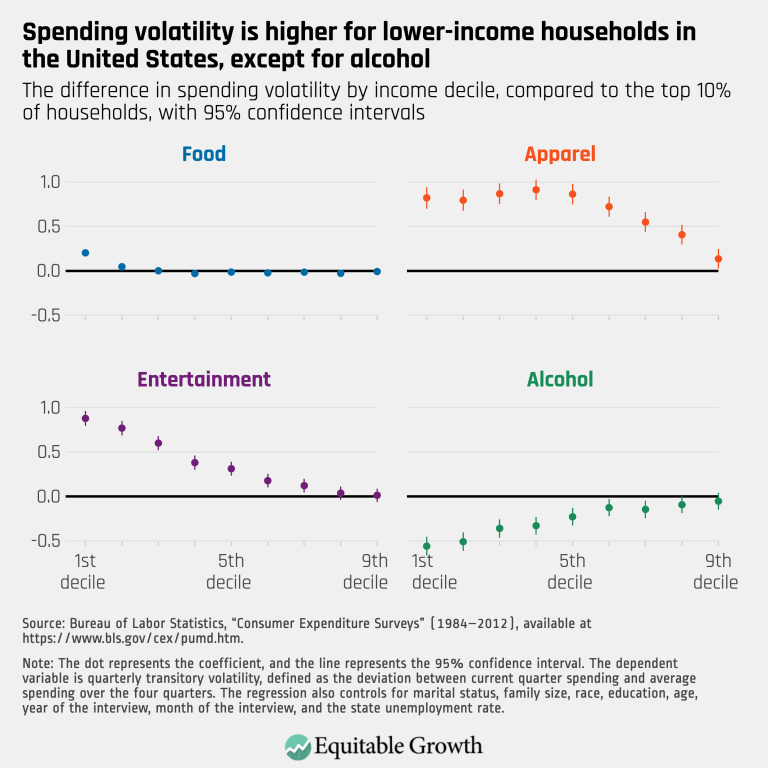
Spending volatility is higher for lower-income households in the United States, except for alcohol (opens in a new tab)
Visualizations Feb 2, 2022
 View Chart
(opens in a new tab)
View Chart
(opens in a new tab)
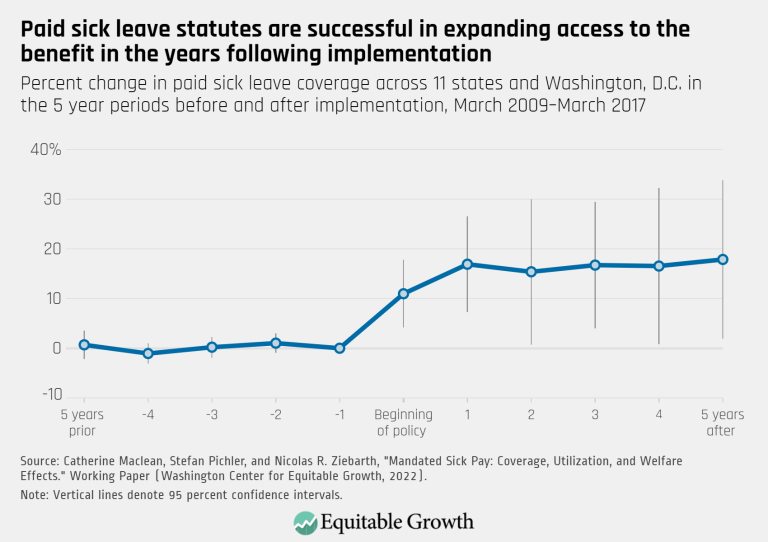
Paid sick leave statutes are successful in expanding access to the benefit in the years following implementation (opens in a new tab)
Visualizations Jan 11, 2022
 View Chart
(opens in a new tab)
View Chart
(opens in a new tab)
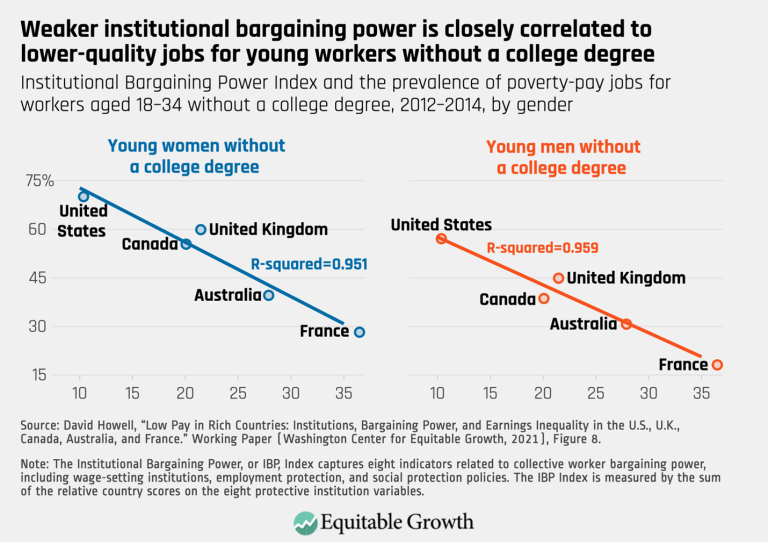
Weaker institutional bargaining power is closely correlated to lower-quality jobs for young workers without a college degree (opens in a new tab)
Visualizations Dec 9, 2021
 View Chart
(opens in a new tab)
View Chart
(opens in a new tab)
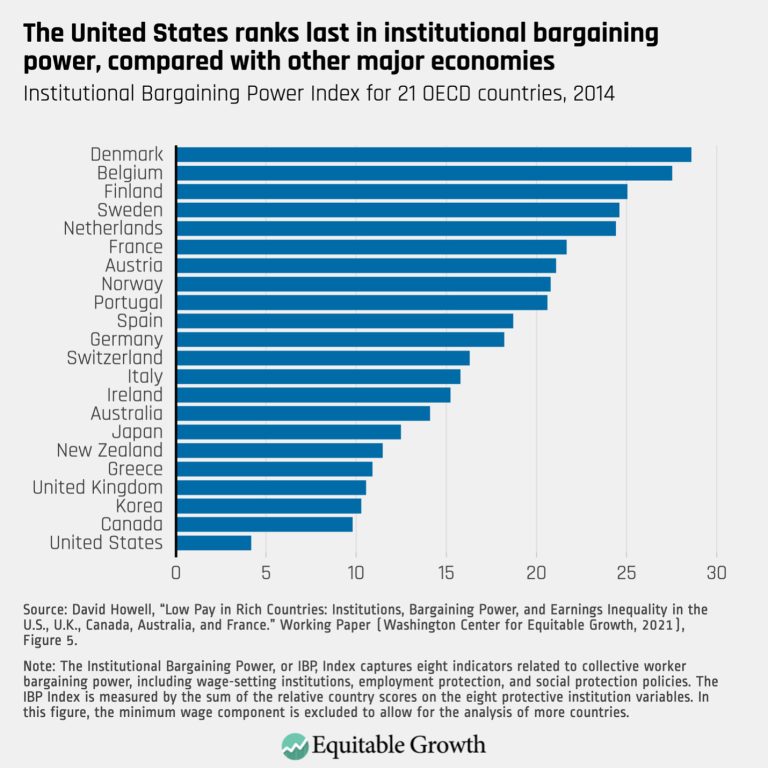
The United States ranks last in institutional bargaining power, compared with other major economies (opens in a new tab)
Visualizations Dec 9, 2021
 View Chart
(opens in a new tab)
View Chart
(opens in a new tab)
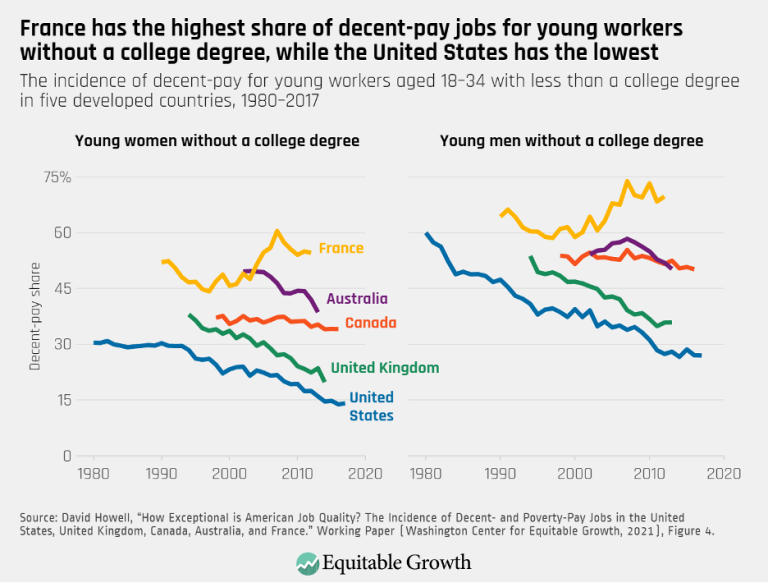
France has the highest share of decent-pay jobs for young workers without a college degree, while the United States has the lowest (opens in a new tab)
Visualizations Dec 9, 2021
 View Chart
(opens in a new tab)
View Chart
(opens in a new tab)
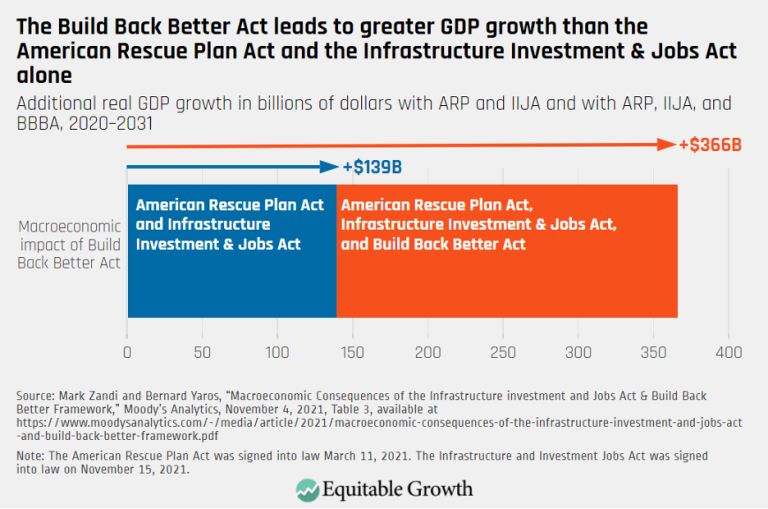
The Build Back Better Act leads to greater GDP growth than the American Rescue Plan Act and the Infrastructure Investment & Jobs Act alone (opens in a new tab)
Visualizations Nov 24, 2021
 View Chart
(opens in a new tab)
View Chart
(opens in a new tab)
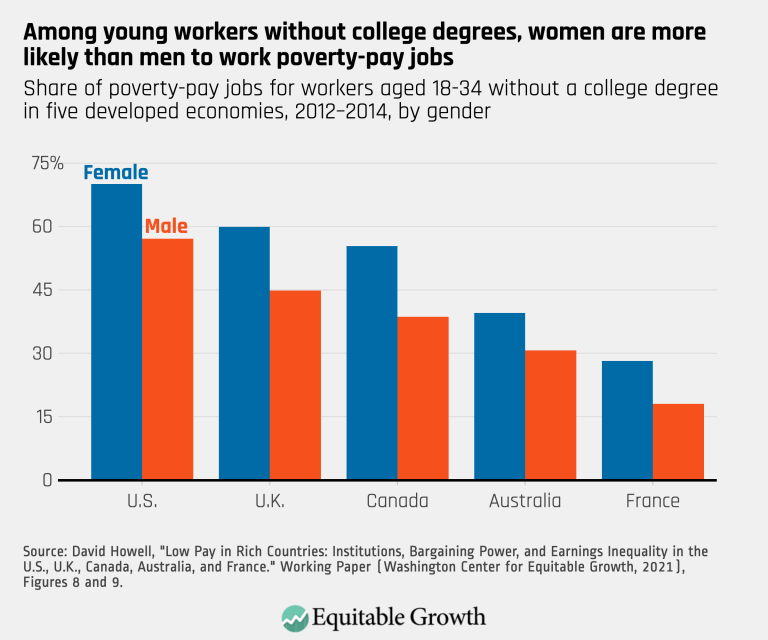
Among young workers without college degrees, women are more likely than men to work poverty-pay jobs (opens in a new tab)
Visualizations Nov 8, 2021
 View Chart
(opens in a new tab)
View Chart
(opens in a new tab)
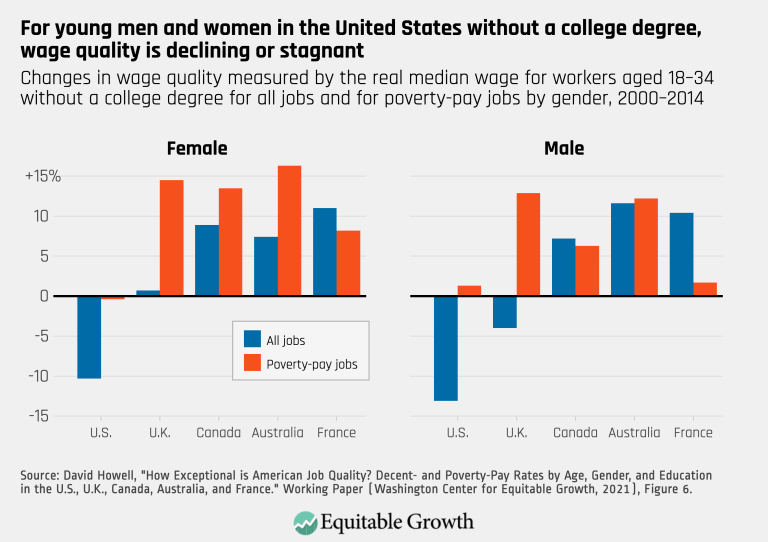
For young men and women in the United States without a college degree, wage quality is declining or stagnant (opens in a new tab)
Visualizations Nov 8, 2021
 View Chart
(opens in a new tab)
View Chart
(opens in a new tab)
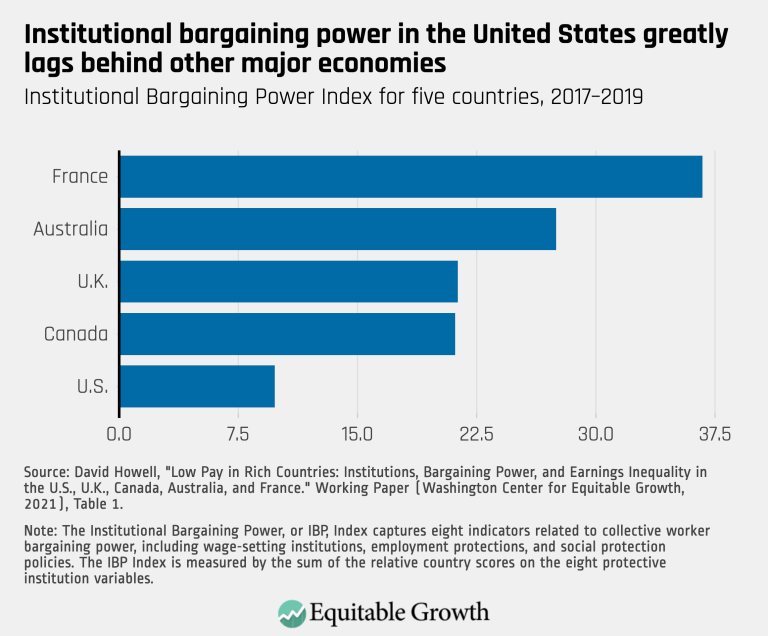
Institutional bargaining power in the United States greatly lags behind other major economies (opens in a new tab)
Visualizations Nov 8, 2021
 View Chart
(opens in a new tab)
View Chart
(opens in a new tab)
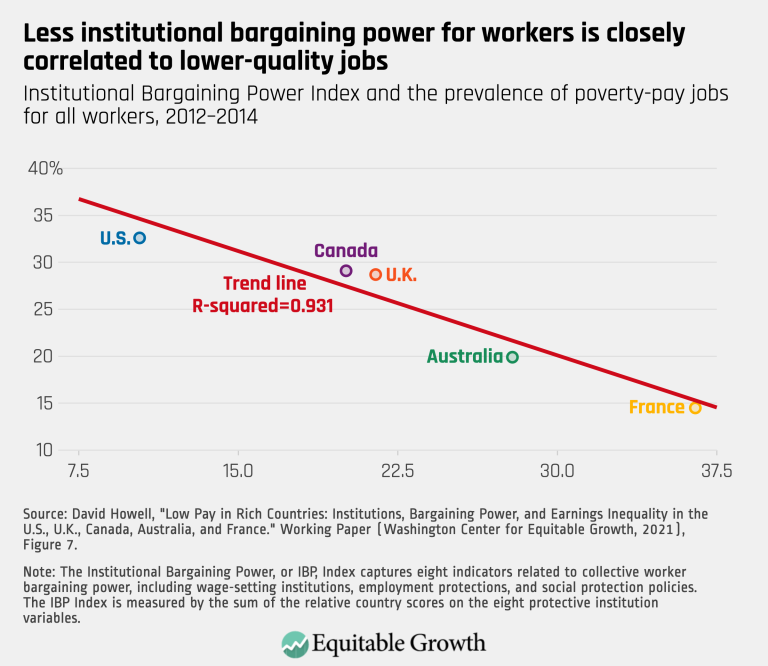
Less institutional bargaining power for workers is closely correlated to lower-quality jobs (opens in a new tab)
Visualizations Nov 8, 2021
 View Chart
(opens in a new tab)
View Chart
(opens in a new tab)
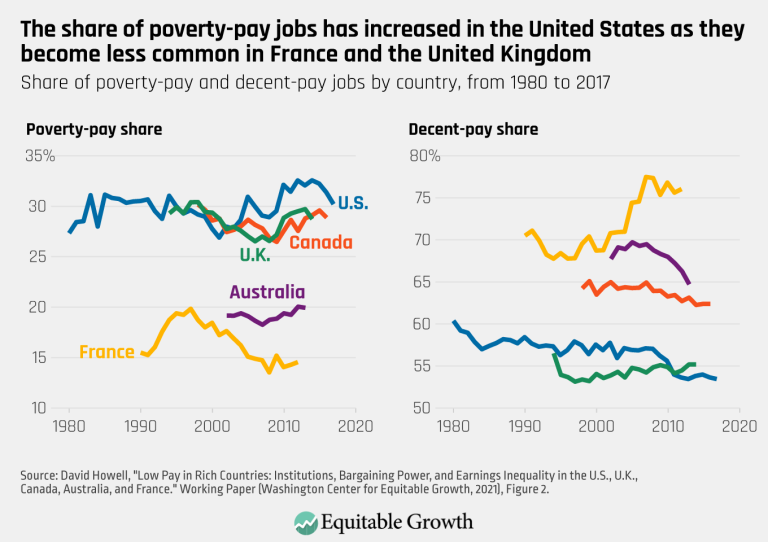
The share of poverty-pay jobs has increased in the United States as they become less common in France and the United Kingdom (opens in a new tab)
Visualizations Nov 8, 2021
 View Chart
(opens in a new tab)
View Chart
(opens in a new tab)
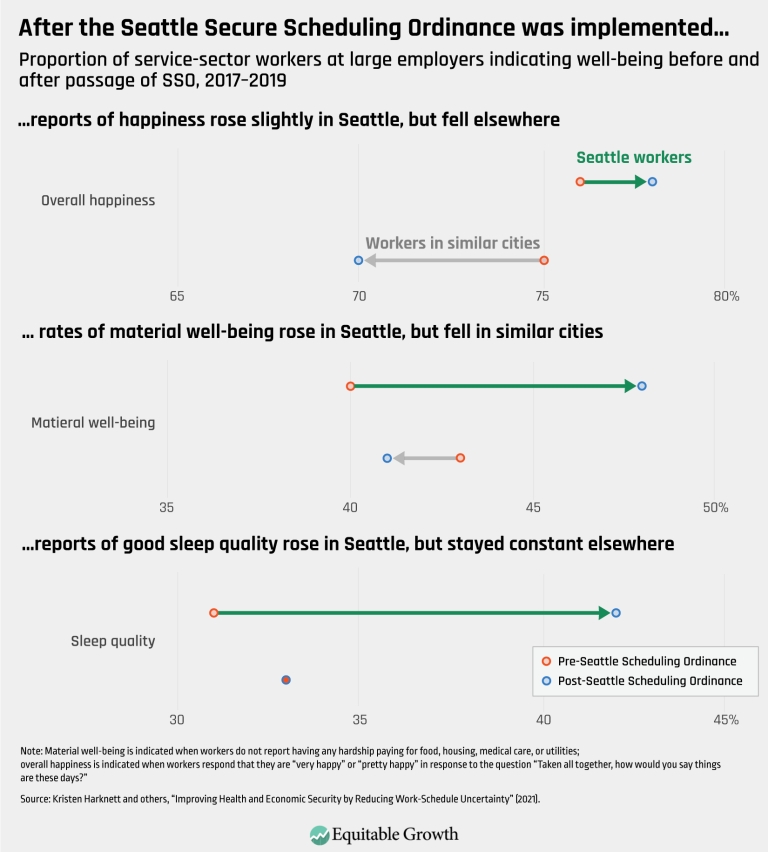
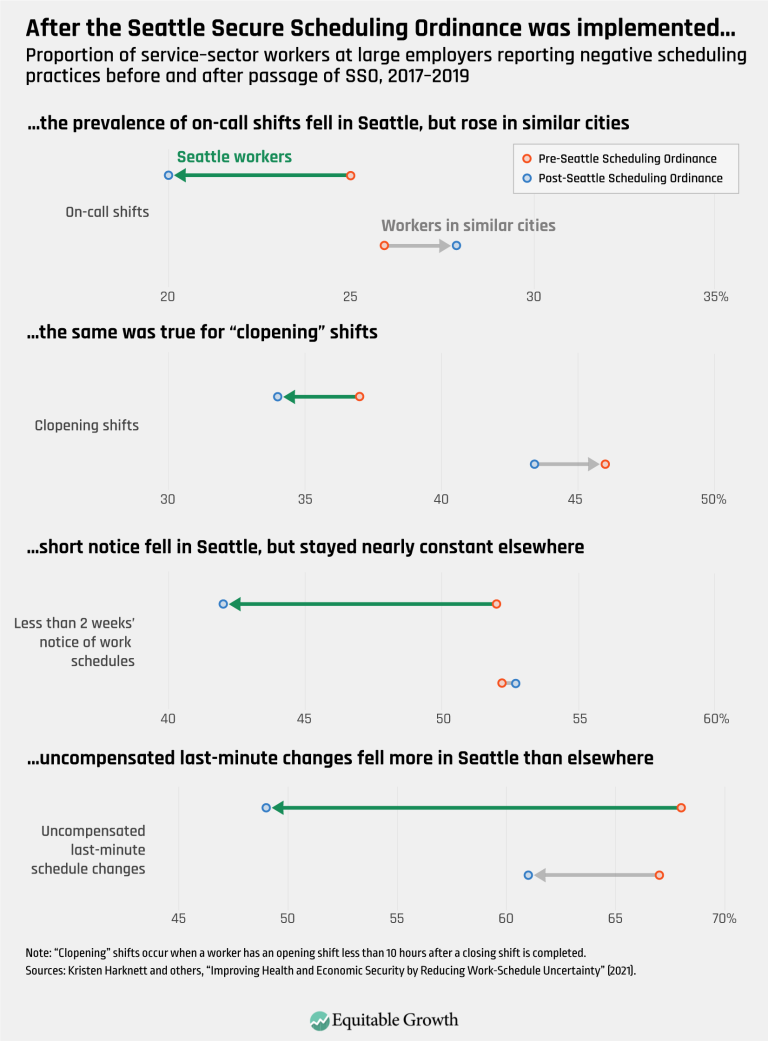
After the Seattle Secure Scheduling Ordinance was implemented… 2 (opens in a new tab)
Visualizations Oct 4, 2021
 View Chart
(opens in a new tab)
View Chart
(opens in a new tab)
After the Seattle Secure Scheduling Ordinance was implemented… (opens in a new tab)
Visualizations Oct 4, 2021
 View Chart
(opens in a new tab)
View Chart
(opens in a new tab)
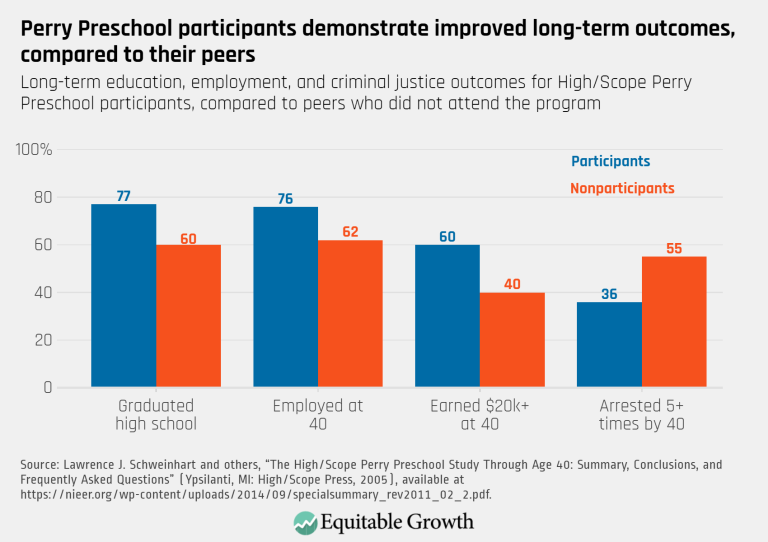
Perry Preschool participants demonstrate improved long-term outcomes, compared to their peers (opens in a new tab)
Visualizations Sep 9, 2021
 View Chart
(opens in a new tab)
View Chart
(opens in a new tab)
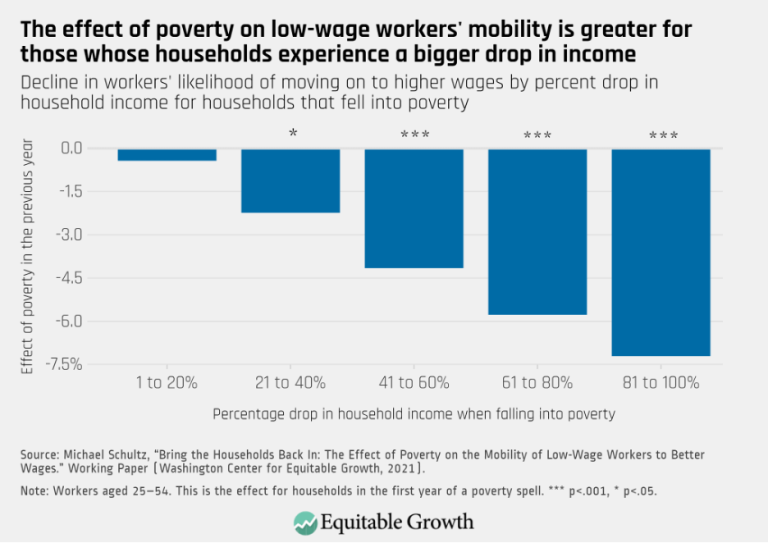
The effect of poverty on low-wage workers’ mobility is greater for those whose households experience a bigger drop in income (opens in a new tab)
Visualizations Aug 25, 2021
 View Chart
(opens in a new tab)
View Chart
(opens in a new tab)
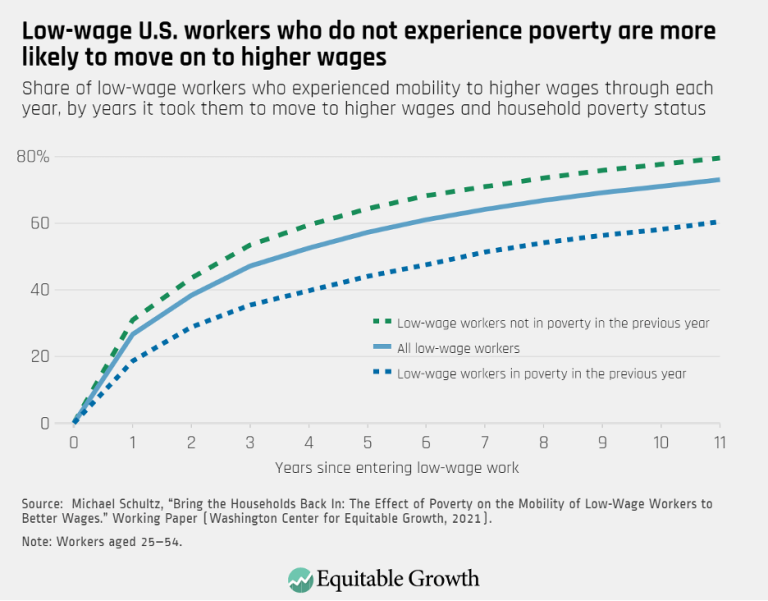
Low-wage U.S. workers who do not experience poverty are more likely to move on to higher wages (opens in a new tab)
Visualizations Aug 25, 2021
 View Chart
(opens in a new tab)
View Chart
(opens in a new tab)
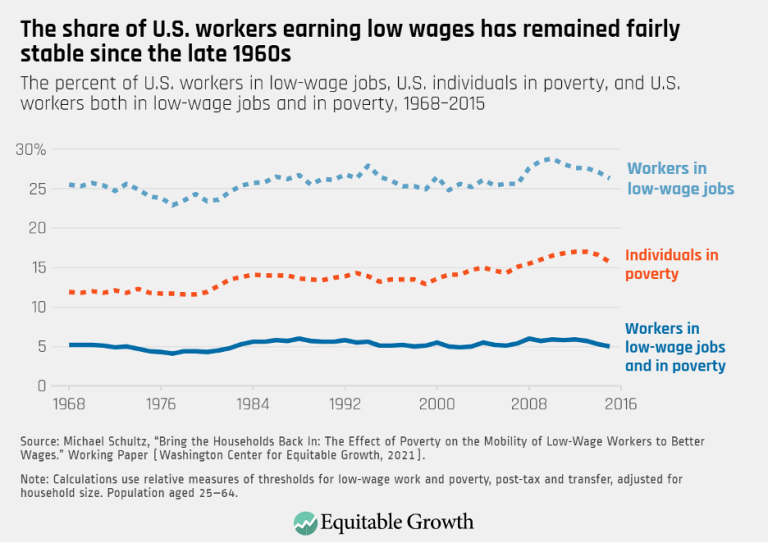
The share of U.S. workers earning low wages has remained fairly stable since the late 1960s (opens in a new tab)
Visualizations Aug 25, 2021
 View Chart
(opens in a new tab)
View Chart
(opens in a new tab)
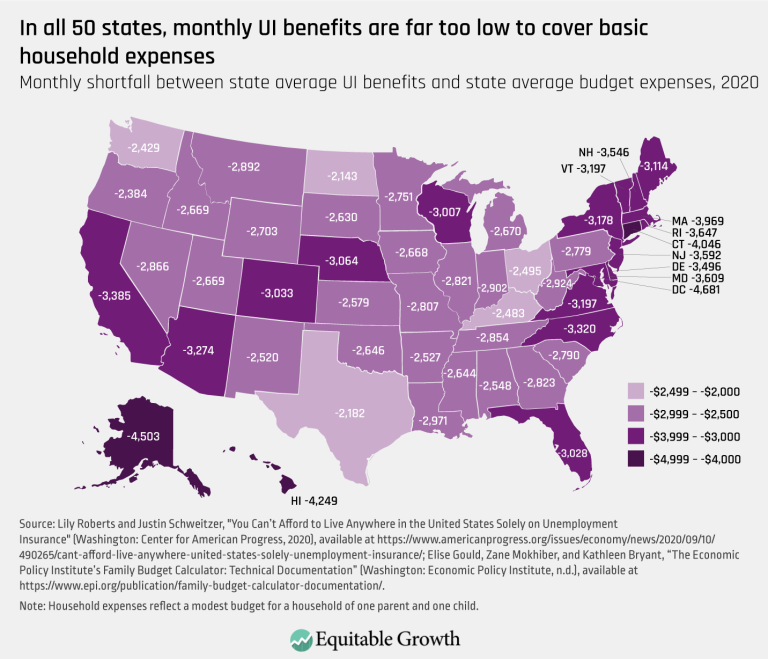
In all 50 states, monthly UI benefits are far too low to cover basic household expenses (opens in a new tab)
Visualizations Aug 4, 2021
 View Chart
(opens in a new tab)
View Chart
(opens in a new tab)
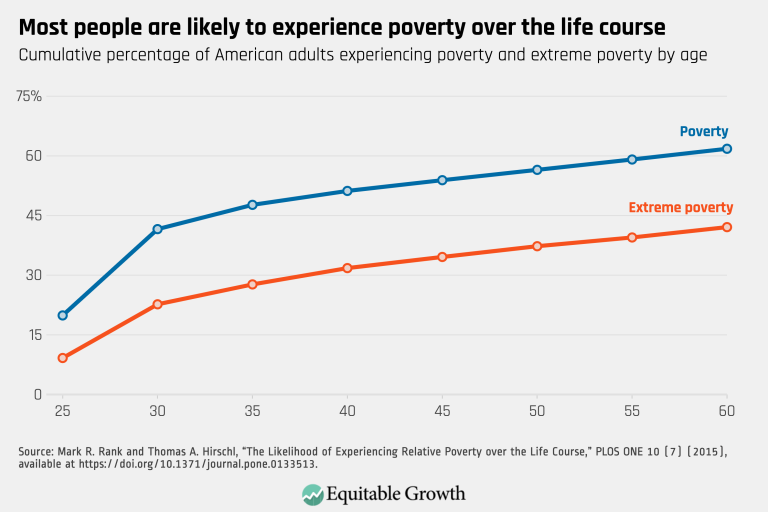
Most people are likely to experience poverty over the life course (opens in a new tab)
Visualizations Aug 4, 2021
 View Chart
(opens in a new tab)
View Chart
(opens in a new tab)
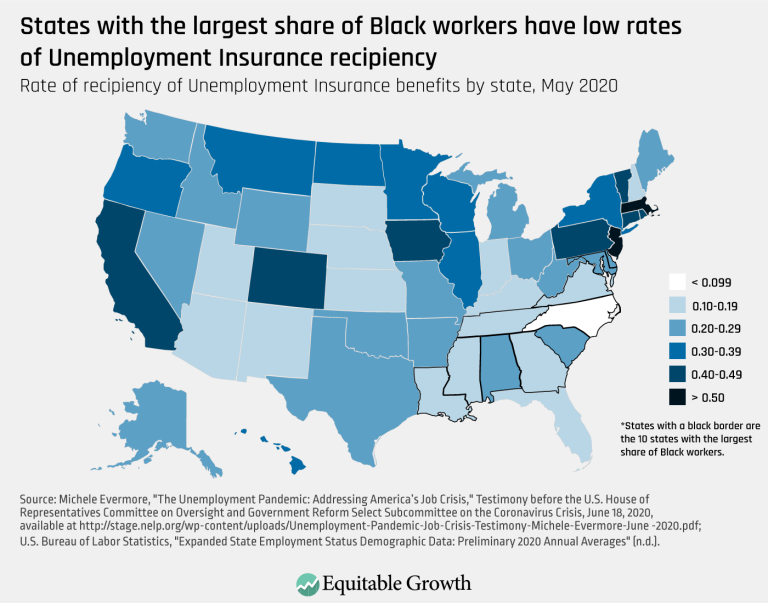
States with the largest share of Black workers have low rates of Unemployment Insurance recipiency (opens in a new tab)
Visualizations Aug 4, 2021
 View Chart
(opens in a new tab)
View Chart
(opens in a new tab)
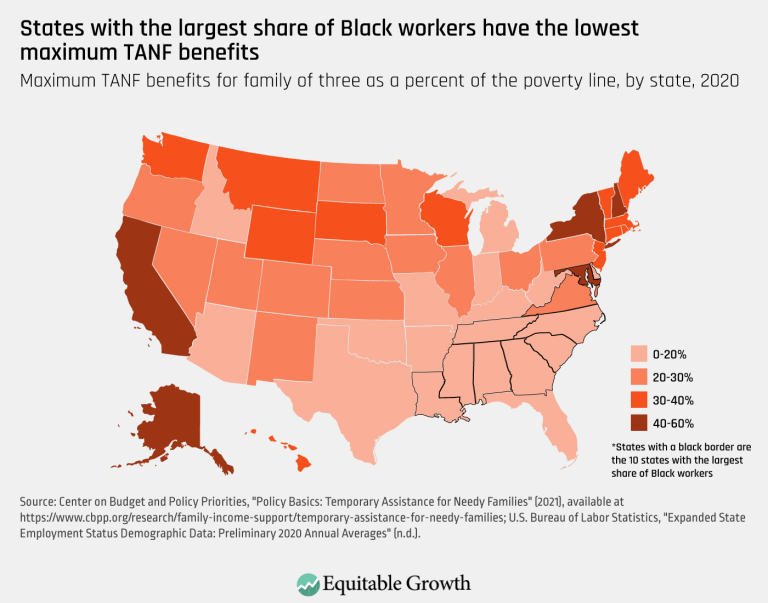
States with the largest share of Black workers have the lowest maximum TANF benefits (opens in a new tab)
Visualizations Aug 4, 2021
 View Chart
(opens in a new tab)
View Chart
(opens in a new tab)
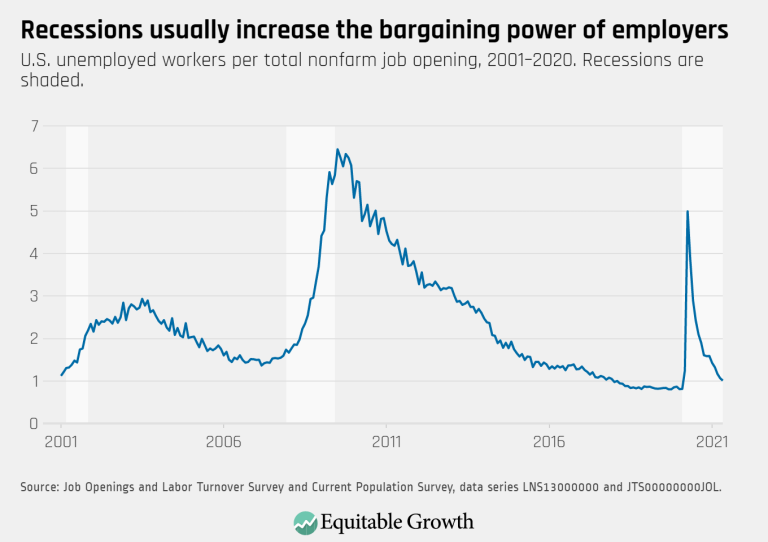
Recessions usually increase the bargaining power of employers (opens in a new tab)
Visualizations Jul 12, 2021
 View Chart
(opens in a new tab)
View Chart
(opens in a new tab)
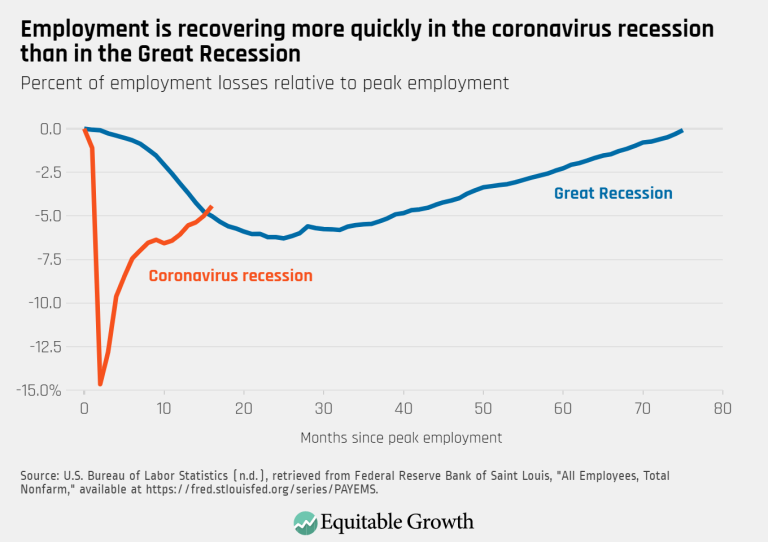
Employment is recovering more quickly in the coronavirus recession than in the Great Recession (opens in a new tab)
Visualizations Jul 12, 2021
 View Chart
(opens in a new tab)
View Chart
(opens in a new tab)
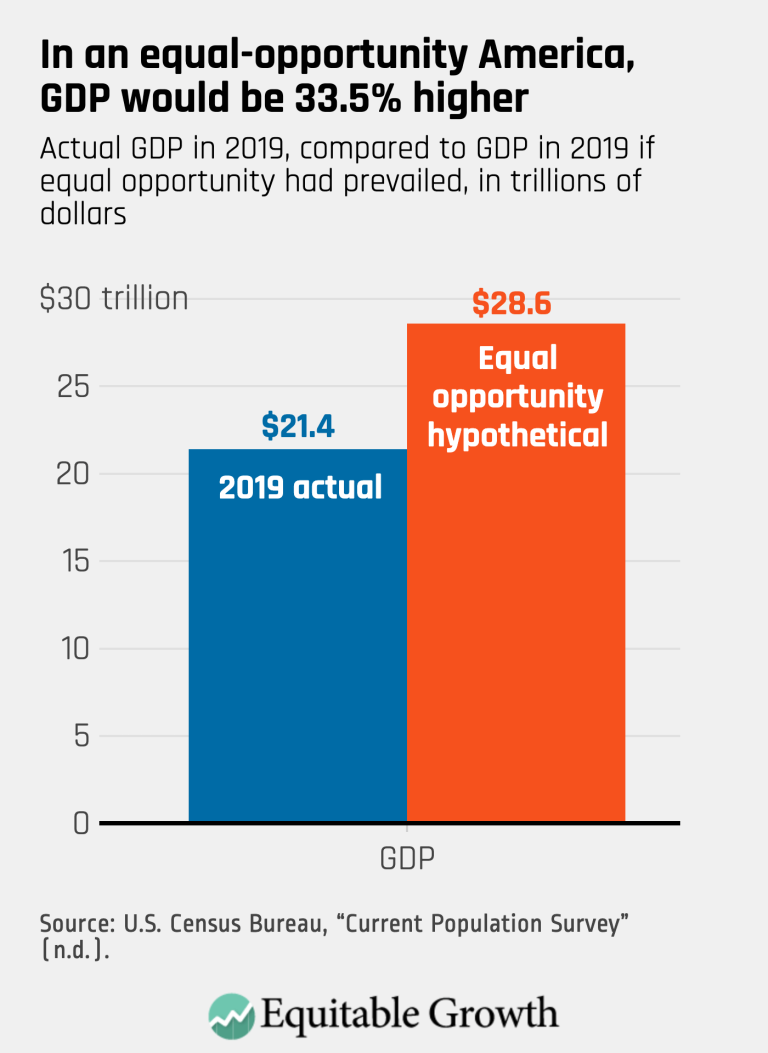
In an equal-opportunity America, GDP would be 33.5% higher (opens in a new tab)
Visualizations Jul 2, 2021
 View Chart
(opens in a new tab)
View Chart
(opens in a new tab)
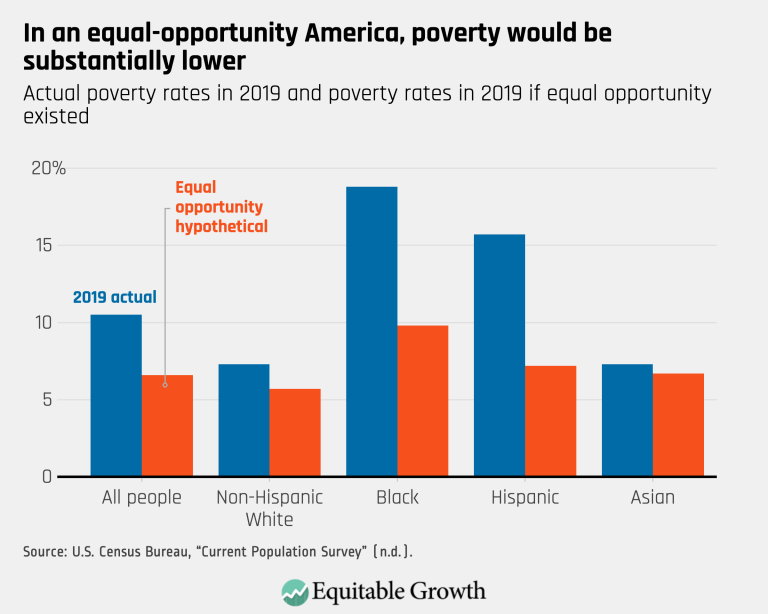
In an equal-opportunity America, poverty would be substantially lower (opens in a new tab)
Visualizations Jul 2, 2021
 View Chart
(opens in a new tab)
View Chart
(opens in a new tab)
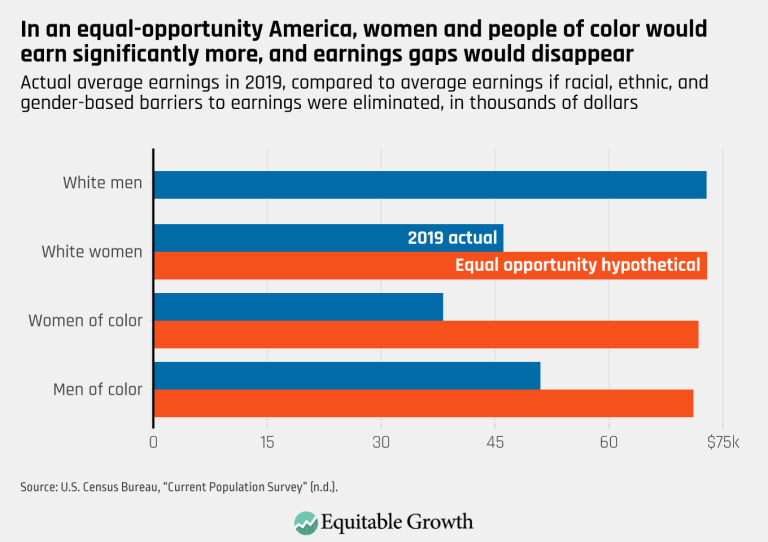
In an equal-opportunity America, women and people of color would earn significantly more, and earnings gaps would disappear (opens in a new tab)
Visualizations Jul 2, 2021
 View Chart
(opens in a new tab)
View Chart
(opens in a new tab)
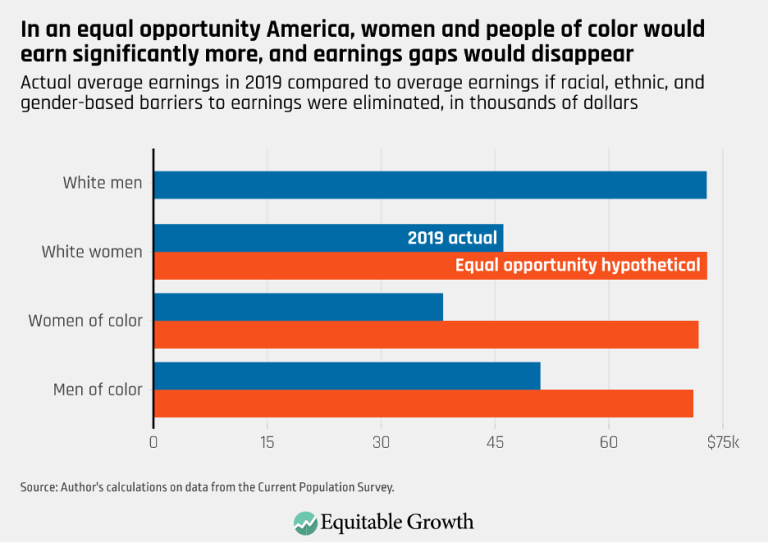
In an equal opportunity America, women and people of color would earn significantly more, and earnings gaps would disappear (opens in a new tab)
Visualizations Jun 7, 2021
 View Chart
(opens in a new tab)
View Chart
(opens in a new tab)
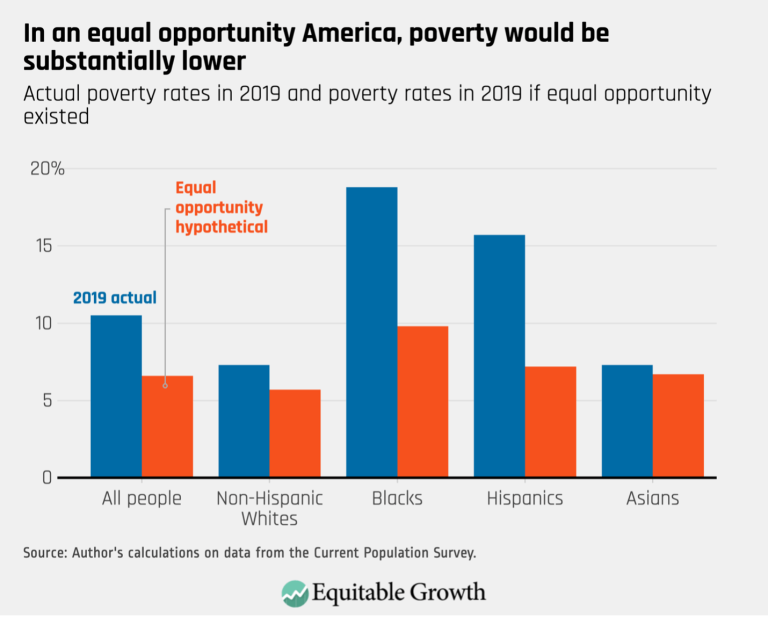
In an equal opportunity America, poverty would be substantially lower (opens in a new tab)
Visualizations Jun 7, 2021
 View Chart
(opens in a new tab)
View Chart
(opens in a new tab)
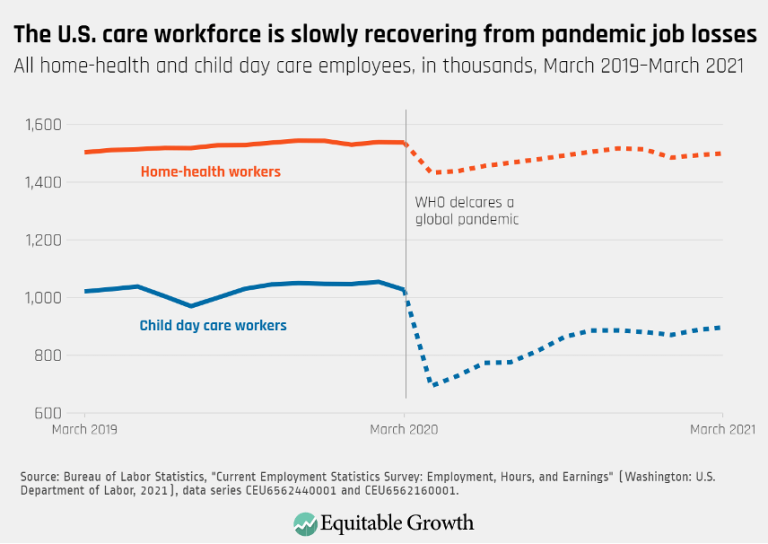
The U.S. care workforce is slowly recovering from pandemic job losses (opens in a new tab)
Visualizations Apr 15, 2021
 View Chart
(opens in a new tab)
View Chart
(opens in a new tab)
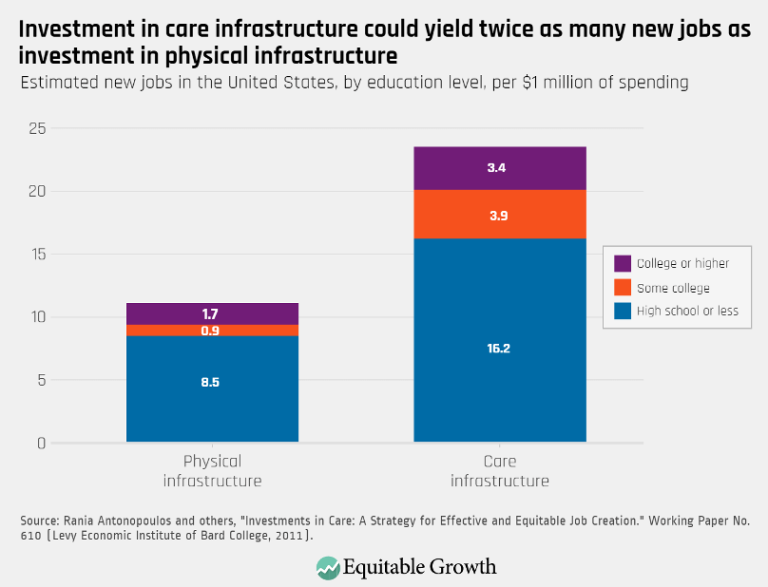
Investment in care infrastructure could yield twice as many new jobs as investment in physical infrastructure (opens in a new tab)
Visualizations Apr 15, 2021
 View Chart
(opens in a new tab)
View Chart
(opens in a new tab)
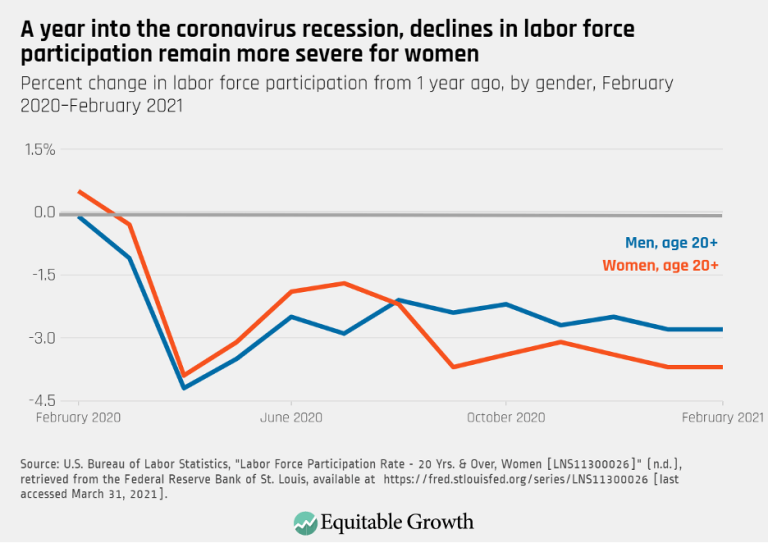
A year into the coronavirus recession, declines in labor force participation remain more severe for women (opens in a new tab)
Visualizations Apr 9, 2021
 View Chart
(opens in a new tab)
View Chart
(opens in a new tab)
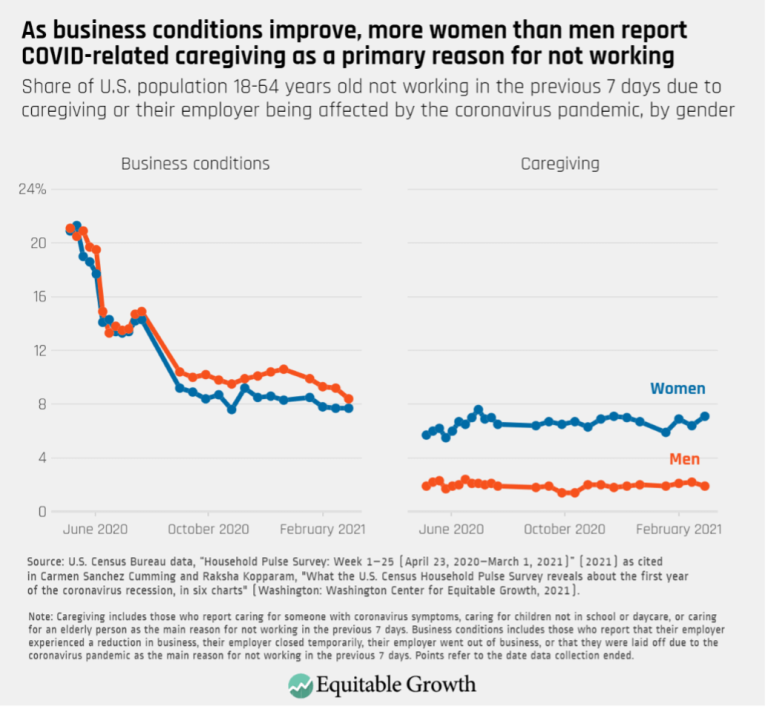
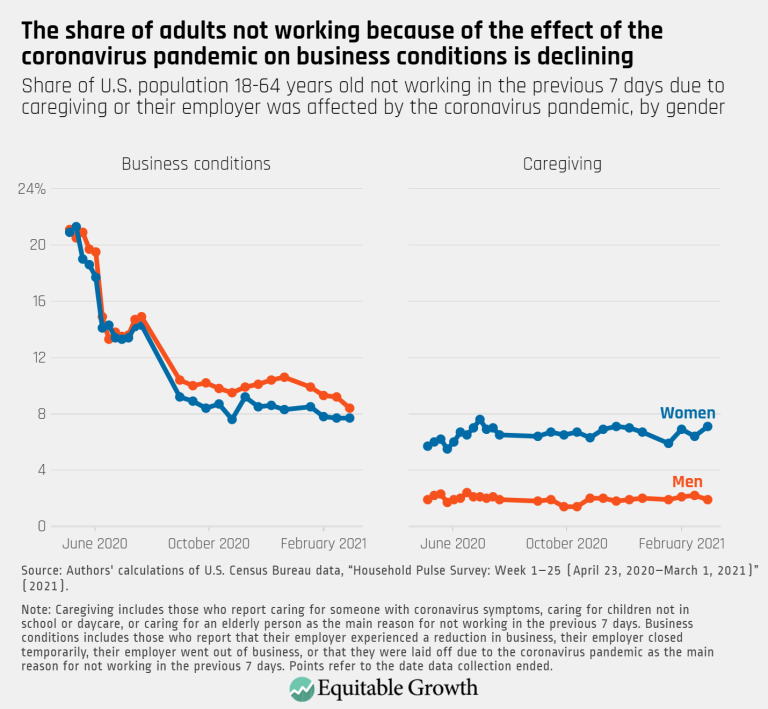
As business conditions improve, more women than men report COVID-related caregiving as a primary reason for not working (opens in a new tab)
Visualizations Apr 9, 2021
 View Chart
(opens in a new tab)
View Chart
(opens in a new tab)
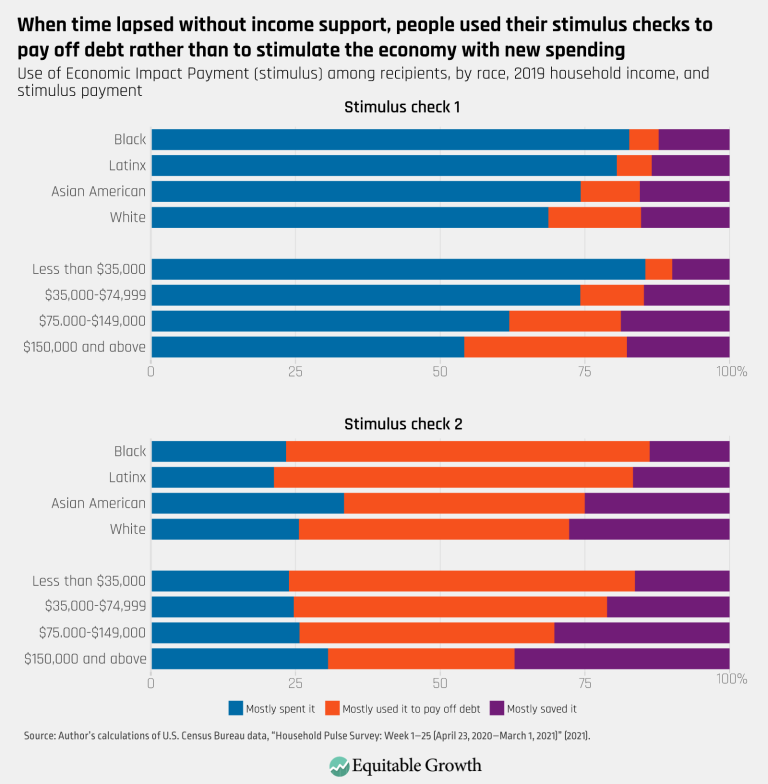
When time lapsed without income support, people used their stimulus checks to pay off debt rather than to stimulate the economy with new spending (opens in a new tab)
Visualizations Apr 1, 2021
 View Chart
(opens in a new tab)
View Chart
(opens in a new tab)
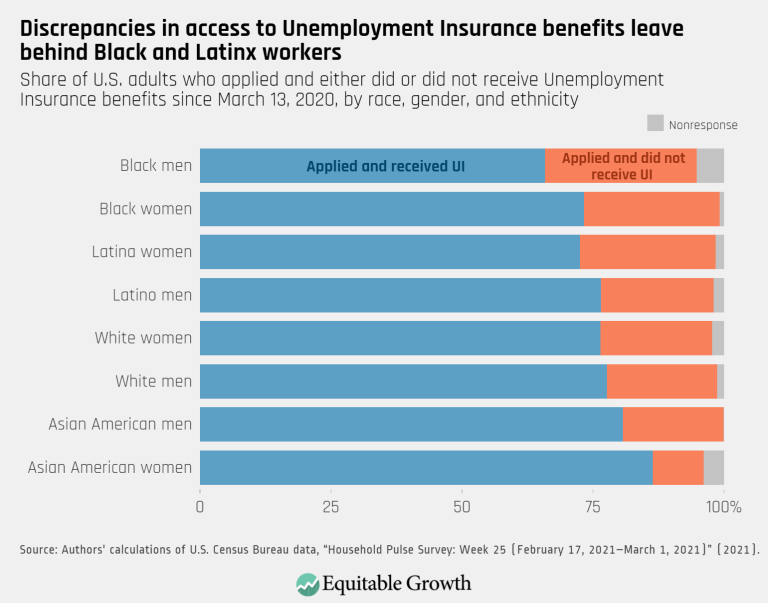
Discrepancies in access to Unemployment Insurance benefits leave behind Black and Latinx workers (opens in a new tab)
Visualizations Apr 1, 2021
 View Chart
(opens in a new tab)
View Chart
(opens in a new tab)
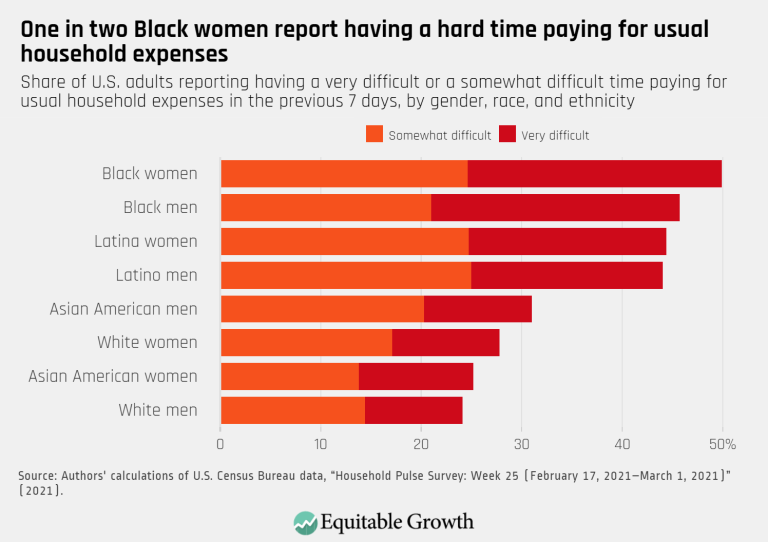
One in two Black women report having a hard time paying for usual household expenses (opens in a new tab)
Visualizations Apr 1, 2021
 View Chart
(opens in a new tab)
View Chart
(opens in a new tab)
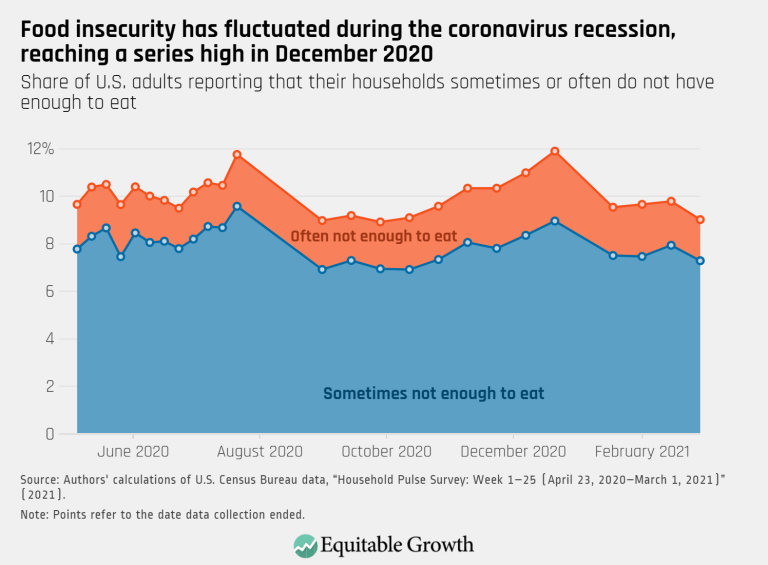
Food insecurity has fluctuated during the coronavirus recession, reaching a series high in December 2020 (opens in a new tab)
Visualizations Apr 1, 2021
 View Chart
(opens in a new tab)
View Chart
(opens in a new tab)
The share of adults not working because of the effect of the coronavirus pandemic on business conditions is declining (opens in a new tab)
Visualizations Apr 1, 2021
 View Chart
(opens in a new tab)
View Chart
(opens in a new tab)
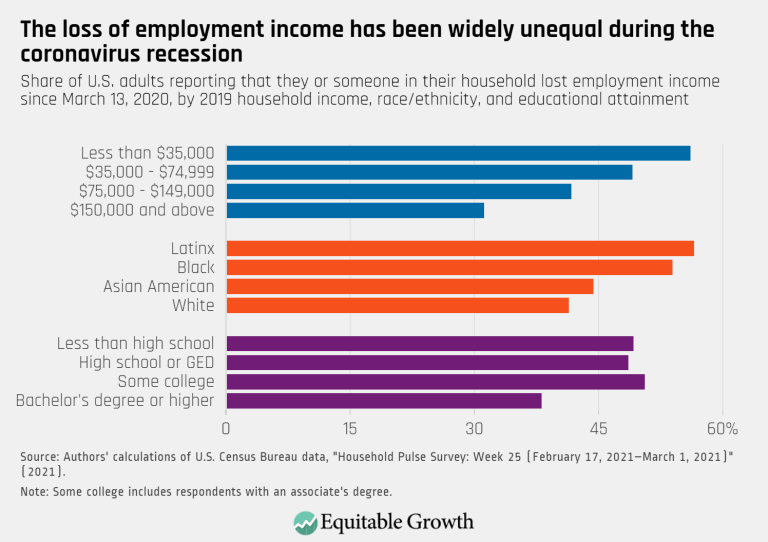
The loss of employment income has been widely unequal during the coronavirus recession (opens in a new tab)
Visualizations Apr 1, 2021
 View Chart
(opens in a new tab)
View Chart
(opens in a new tab)
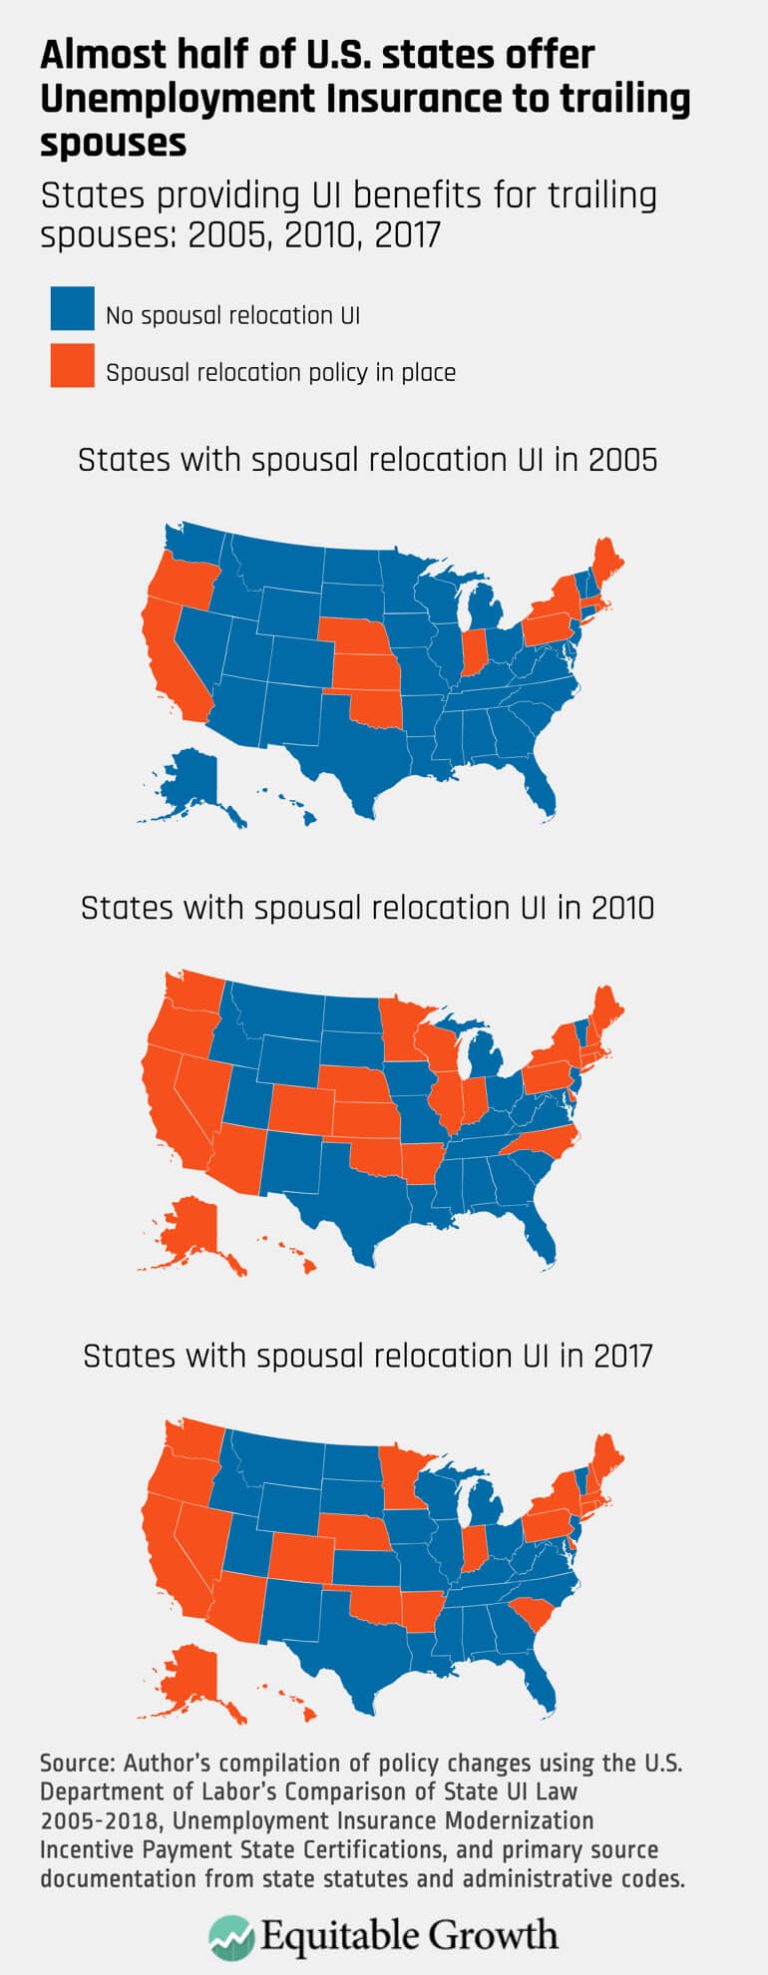
Almost half of U.S. states offer Unemployment Insurance to trailing spouses (opens in a new tab)
Visualizations Mar 15, 2021
 View Chart
(opens in a new tab)
View Chart
(opens in a new tab)
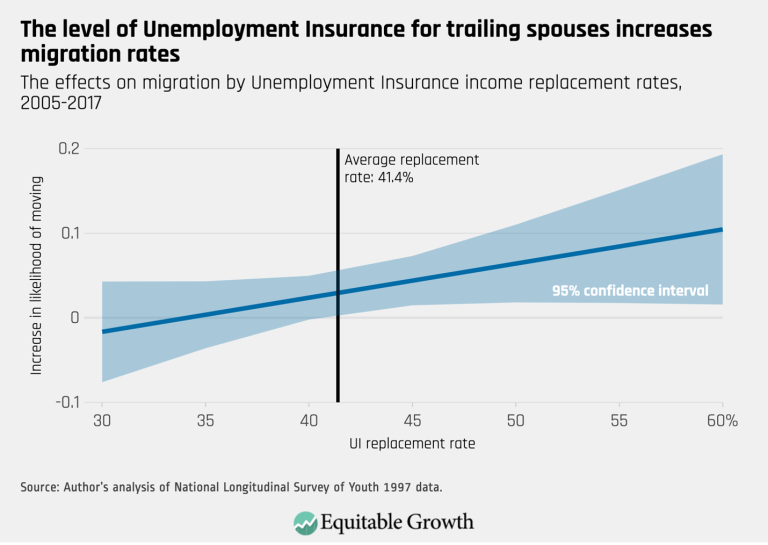
The level of Unemployment Insurance for trailing spouses increases migration rates (opens in a new tab)
Visualizations Mar 15, 2021
 View Chart
(opens in a new tab)
View Chart
(opens in a new tab)
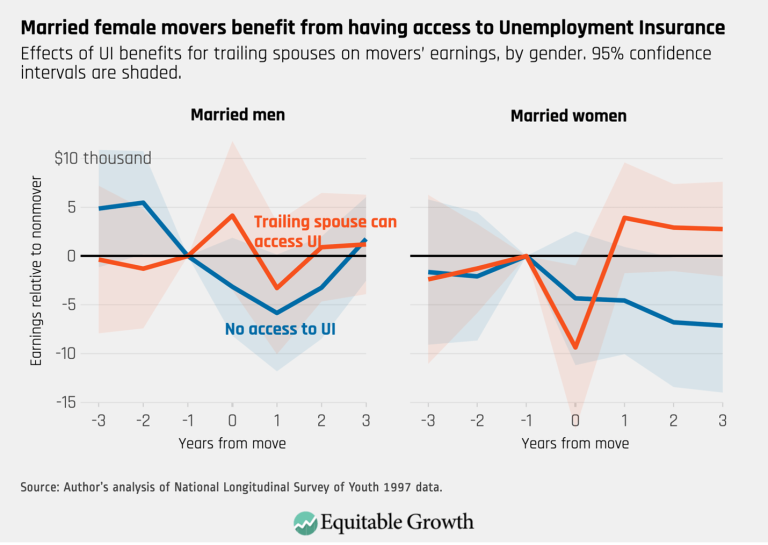
Married female movers benefit from having access to Unemployment Insurance (opens in a new tab)
Visualizations Mar 15, 2021
 View Chart
(opens in a new tab)
View Chart
(opens in a new tab)
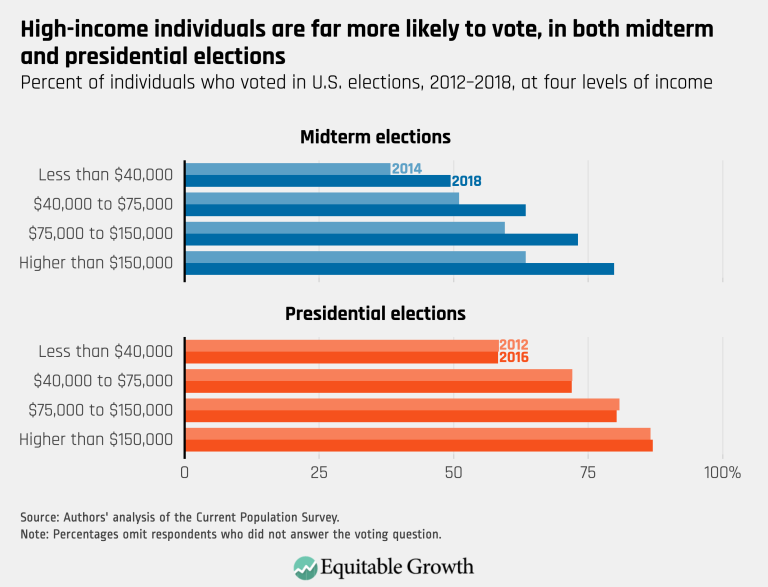
High-income individuals are far more likely to vote, in both midterm and presidential elections (opens in a new tab)
Visualizations Feb 5, 2021
 View Chart
(opens in a new tab)
View Chart
(opens in a new tab)
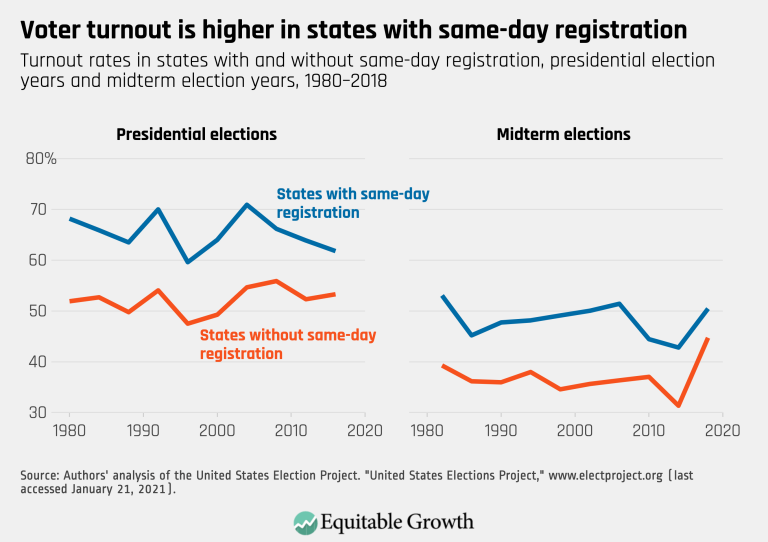
Voter turnout is higher in states with same-day registration (opens in a new tab)
Visualizations Jan 29, 2021
 View Chart
(opens in a new tab)
View Chart
(opens in a new tab)
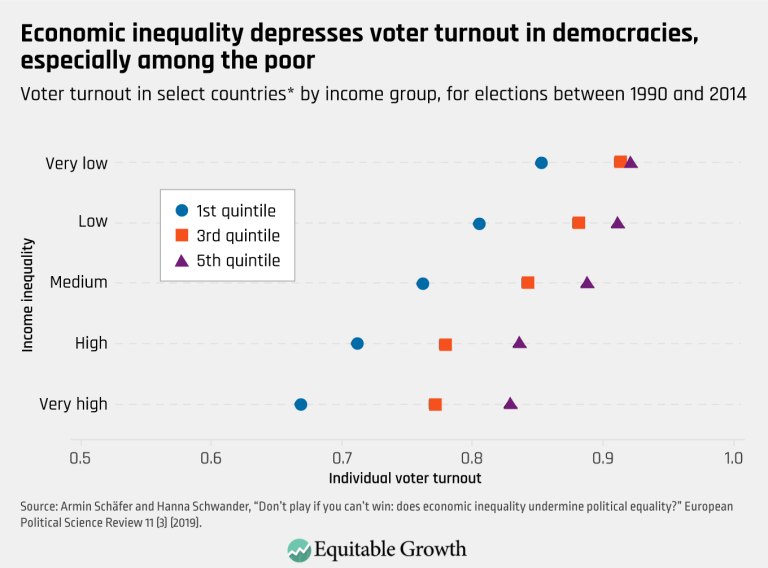
Economic inequality depresses voter turnout in democracies, especially among the poor (opens in a new tab)
Visualizations Jan 29, 2021
 View Chart
(opens in a new tab)
View Chart
(opens in a new tab)
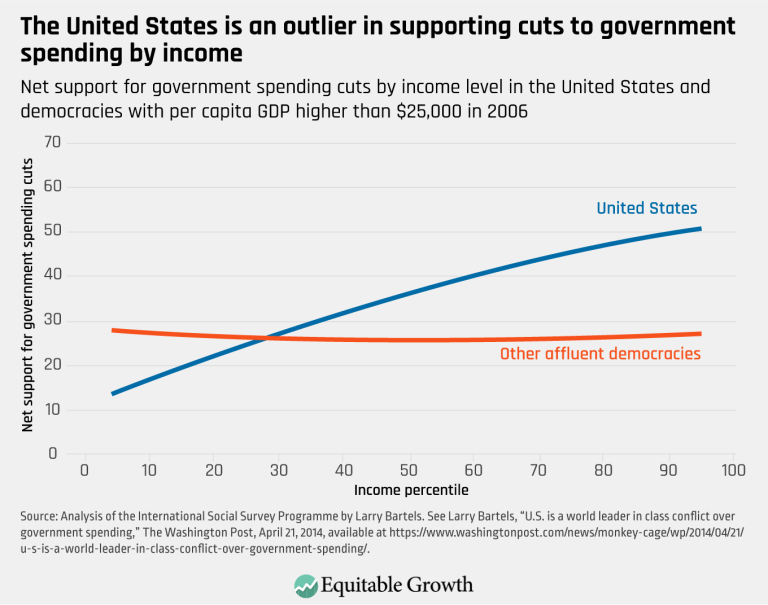
The United States is an outlier in supporting cuts to government spending by income (opens in a new tab)
Visualizations Jan 29, 2021
 View Chart
(opens in a new tab)
View Chart
(opens in a new tab)
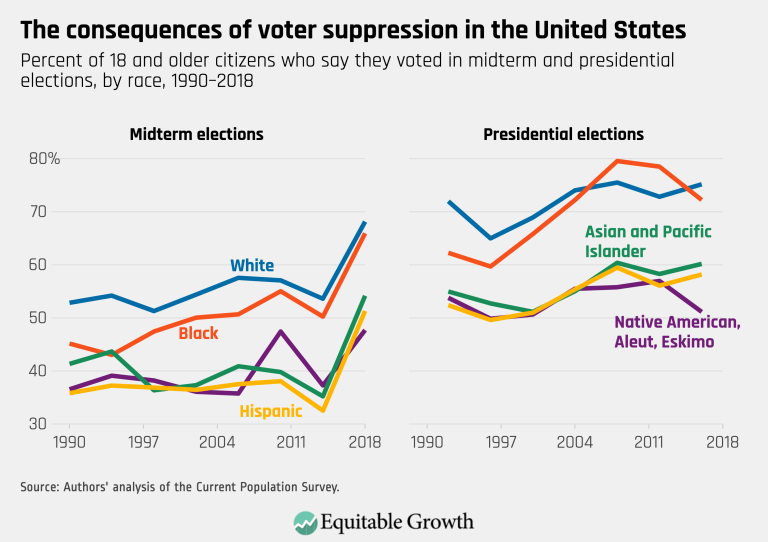
The consequences of voter suppression in the United States (opens in a new tab)
Visualizations Jan 29, 2021
 View Chart
(opens in a new tab)
View Chart
(opens in a new tab)
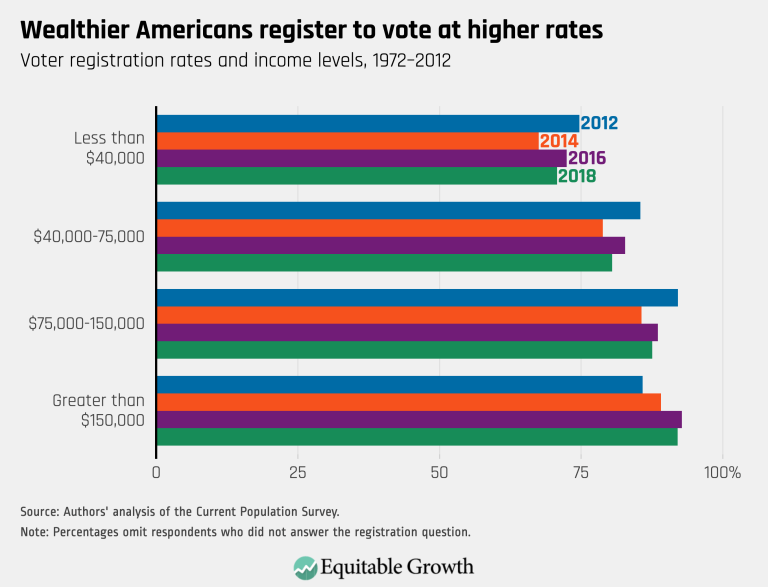
Wealthier Americans register to vote at higher rates (opens in a new tab)
Visualizations Jan 29, 2021
 View Chart
(opens in a new tab)
View Chart
(opens in a new tab)
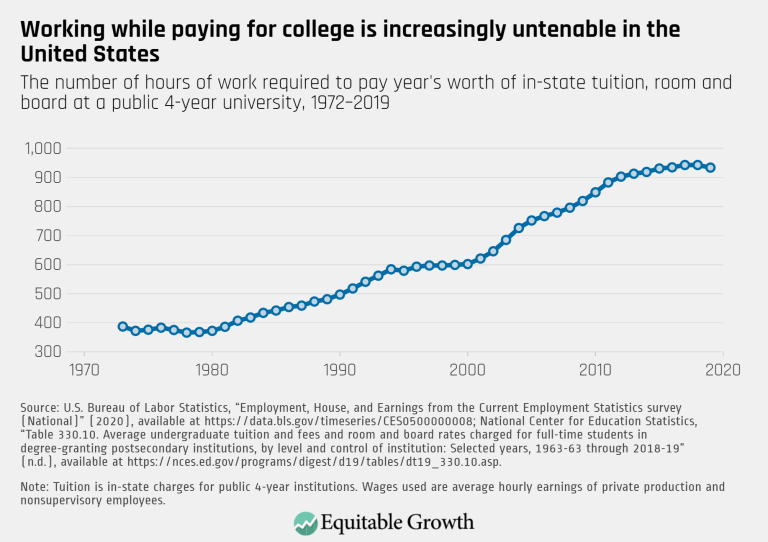
Working while paying for college is increasingly untenable in the United States (opens in a new tab)
Visualizations Jan 5, 2021
 View Chart
(opens in a new tab)
View Chart
(opens in a new tab)
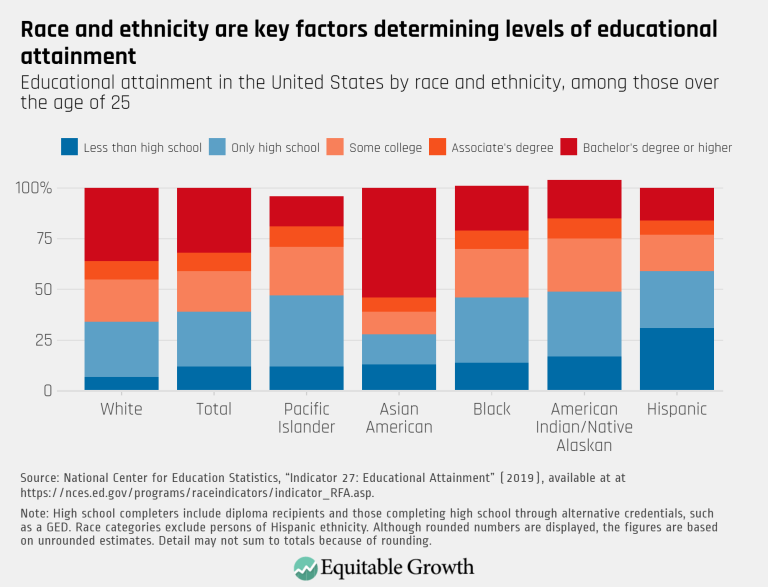
Race and ethnicity are key factors determining levels of educational attainment (opens in a new tab)
Visualizations Jan 5, 2021
 View Chart
(opens in a new tab)
View Chart
(opens in a new tab)
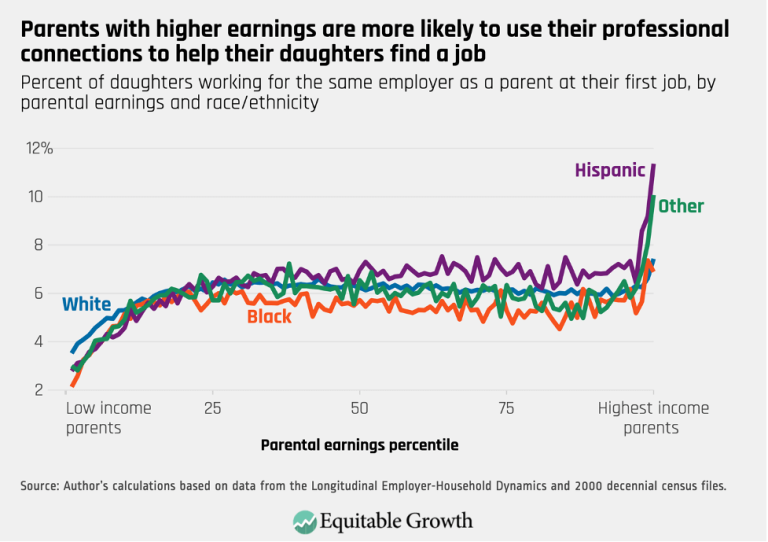
Parents with higher earnings are more likely to user their professional connections to help their daughters find a job (opens in a new tab)
Visualizations Dec 3, 2020
 View Chart
(opens in a new tab)
View Chart
(opens in a new tab)
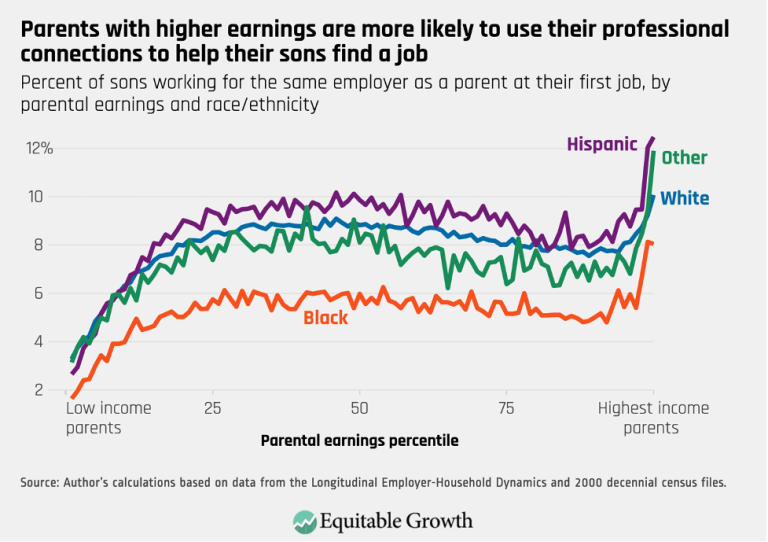
Parents with higher earnings are more likely to user their professional connections to help their sons find a job (opens in a new tab)
Visualizations Dec 3, 2020
 View Chart
(opens in a new tab)
View Chart
(opens in a new tab)
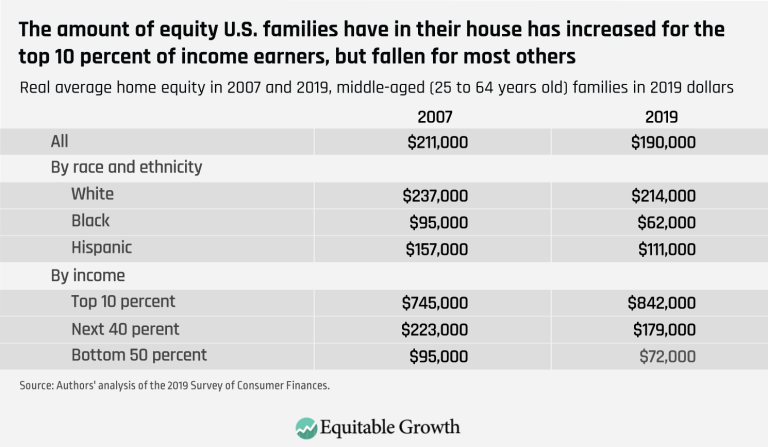
The amount of equity U.S. families have in their house has increased for the top 10 percent of income earners, but fallen for most others (opens in a new tab)
Visualizations Oct 13, 2020
 View Chart
(opens in a new tab)
View Chart
(opens in a new tab)
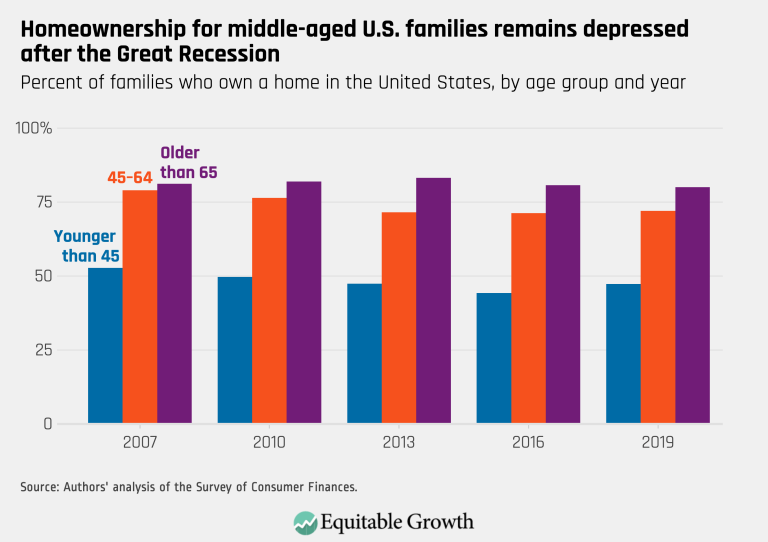
Homeownership for middle-aged U.S. families remains depressed after the Great Recession (opens in a new tab)
Visualizations Oct 9, 2020
 View Chart
(opens in a new tab)
View Chart
(opens in a new tab)
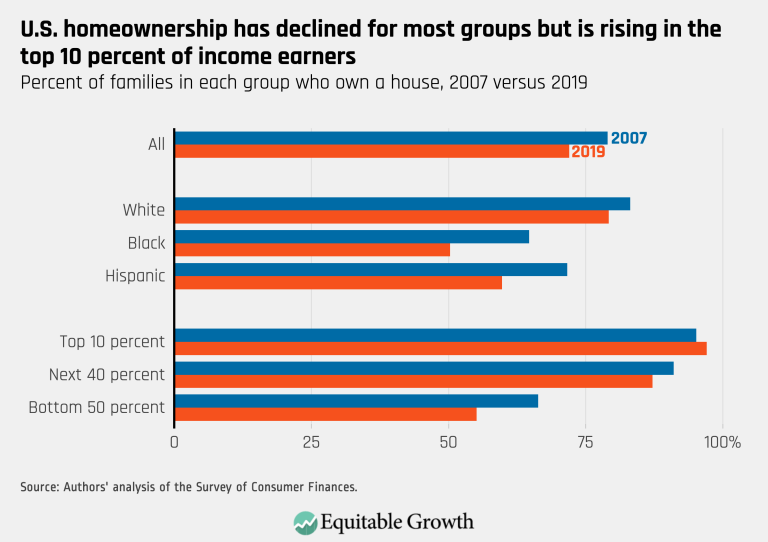
U.S. homeownership has declined for most groups but is rising in the top 10 percent of income earners (opens in a new tab)
Visualizations Oct 9, 2020
 View Chart
(opens in a new tab)
View Chart
(opens in a new tab)
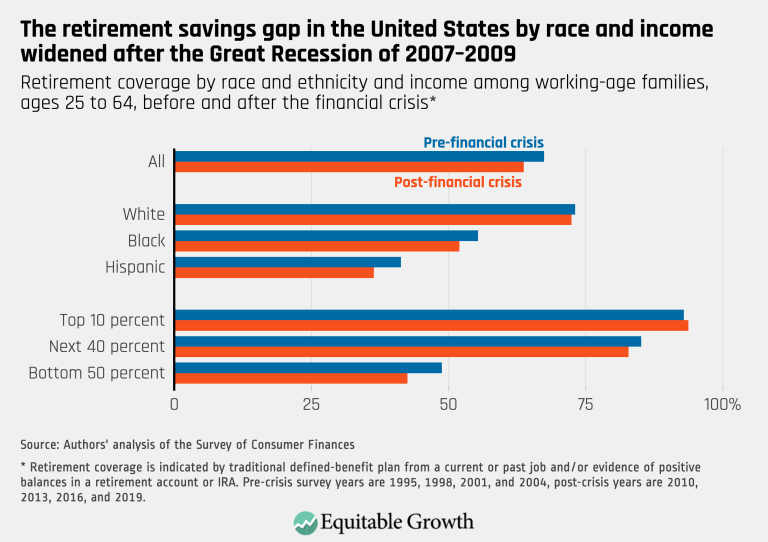
The retirement savings gap in the United States by race and income widened after the Great Recession of 2007–2009 (opens in a new tab)
Visualizations Oct 7, 2020
 View Chart
(opens in a new tab)
View Chart
(opens in a new tab)
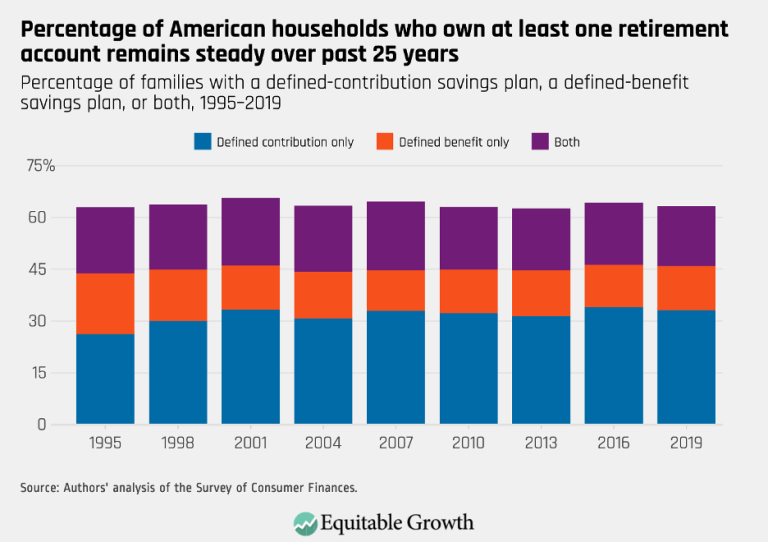
Percentage of American households who own at least one retirement account remains steady over past 25 years (opens in a new tab)
Visualizations Oct 6, 2020
 View Chart
(opens in a new tab)
View Chart
(opens in a new tab)
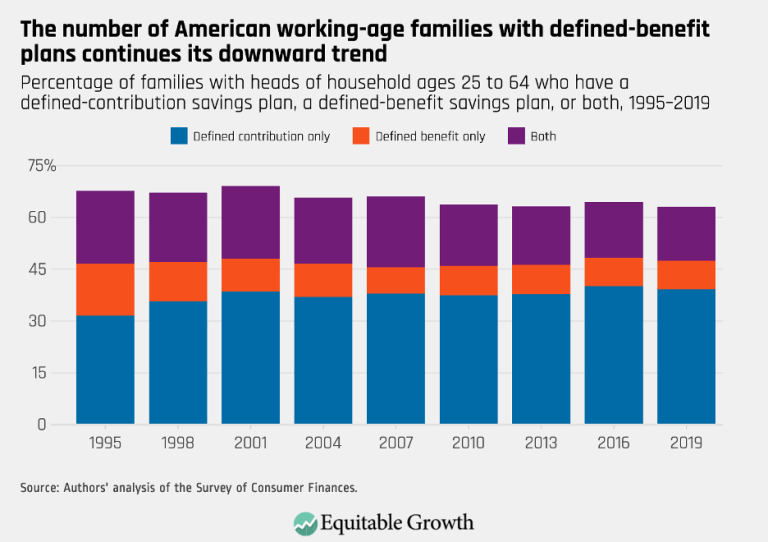
The number of American working-age families with defined-benefit plans continues downward trend (opens in a new tab)
Visualizations Oct 6, 2020










































Your Source for the Latest Insights
Get updates on our latest research, event announcements, and policy insights delivered straight to your inbox. Stay connected with the leading voices on equitable growth.