


Issue Areas
The Washington Center for Equitable Growth is engaged in an array of issues to advance evidence-based ideas and policies that promote strong, stable, and broad-based economic growth.

242 Results

 View Chart
(opens in a new tab)
View Chart
(opens in a new tab)
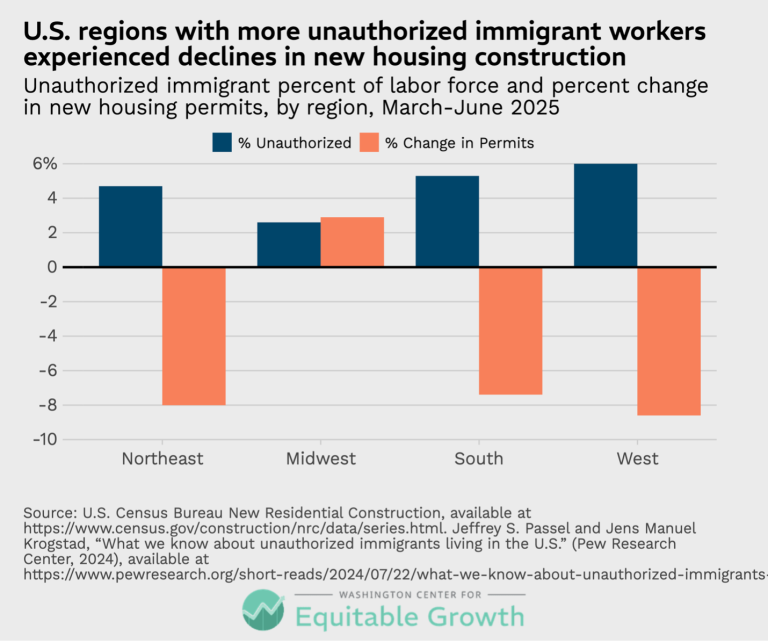
U.S. regions with more unauthorized immigrant workers experienced declines in new housing construction (opens in a new tab)
Visualizations Aug 31, 2026
 View Chart
(opens in a new tab)
View Chart
(opens in a new tab)
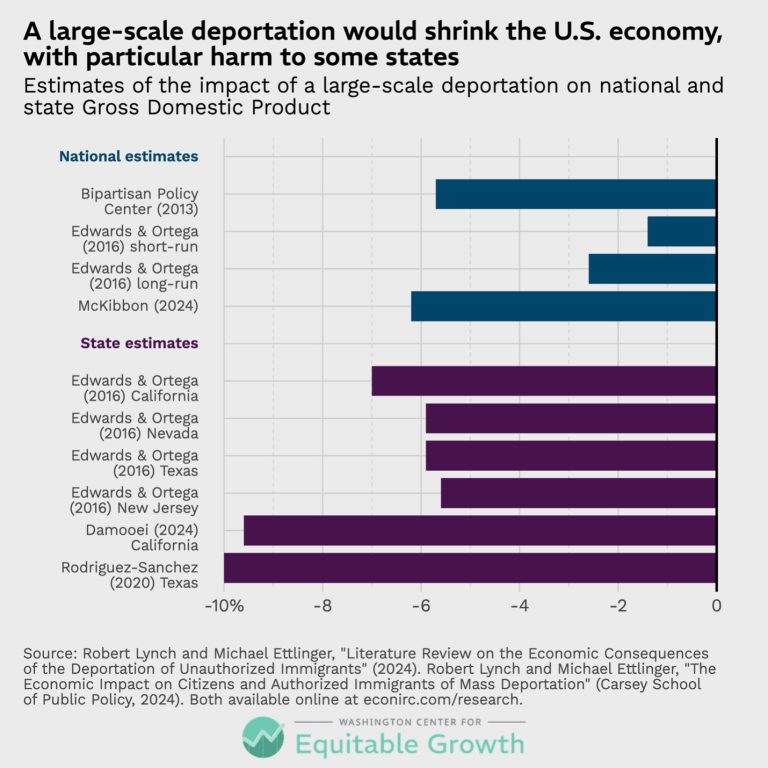
A large-scale deportation would shrink the U.S. economy, with particular harm to some states (opens in a new tab)
Visualizations Aug 31, 2026
 View Chart
(opens in a new tab)
View Chart
(opens in a new tab)
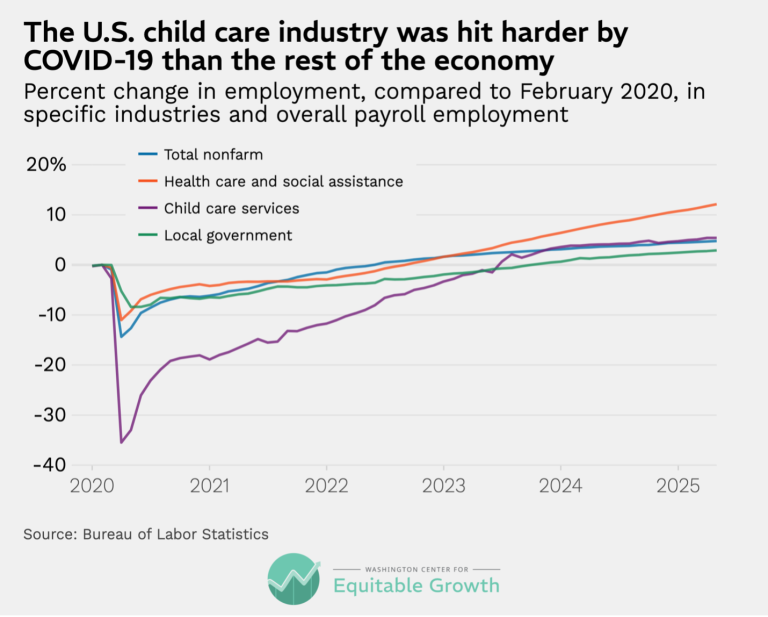
The U.S. child care industry was hit harder by COVID-19 than the rest of the economy (opens in a new tab)
Visualizations Apr 15, 2026
 View Chart
(opens in a new tab)
View Chart
(opens in a new tab)
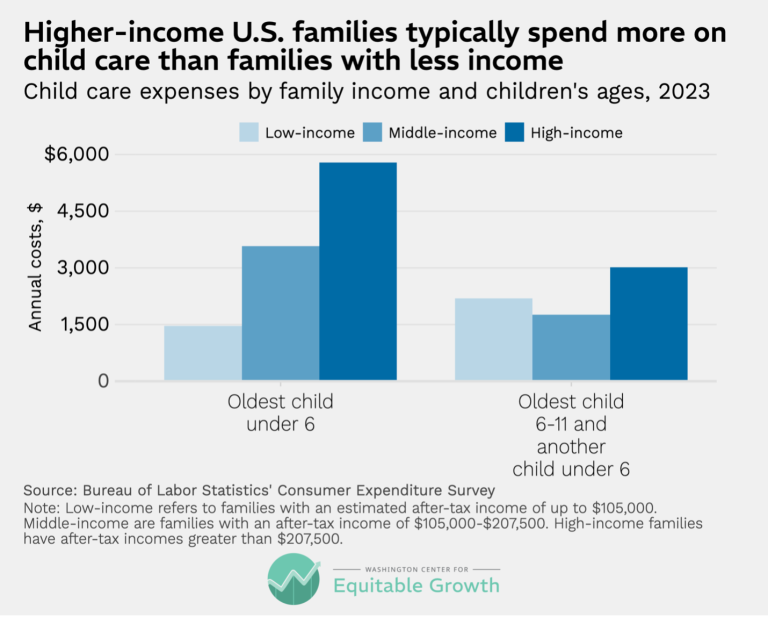
Higher-income U.S. families typically spend more on child care than families with less income (opens in a new tab)
Visualizations Apr 15, 2026
 View Chart
(opens in a new tab)
View Chart
(opens in a new tab)
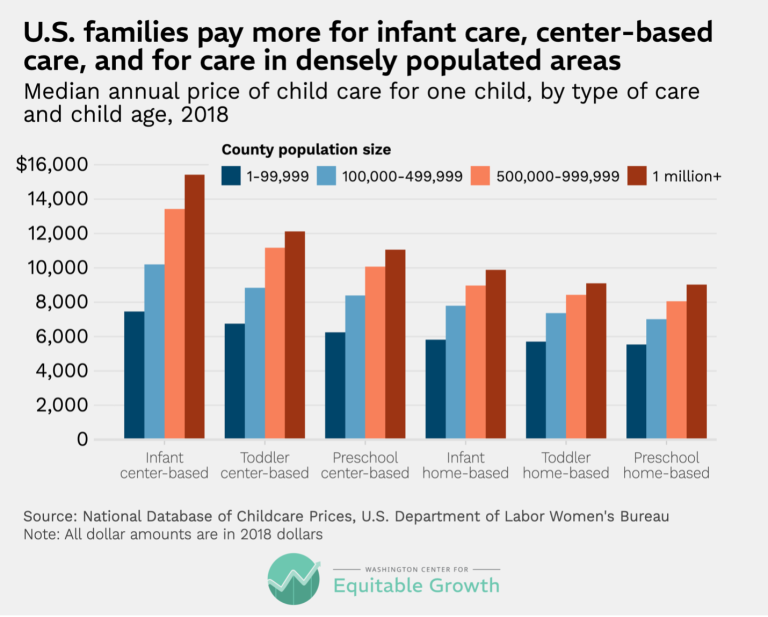
U.S. families pay more for infant care, center-based care, and for care in densely populated areas (opens in a new tab)
Visualizations Apr 15, 2026
 View Chart
(opens in a new tab)
View Chart
(opens in a new tab)
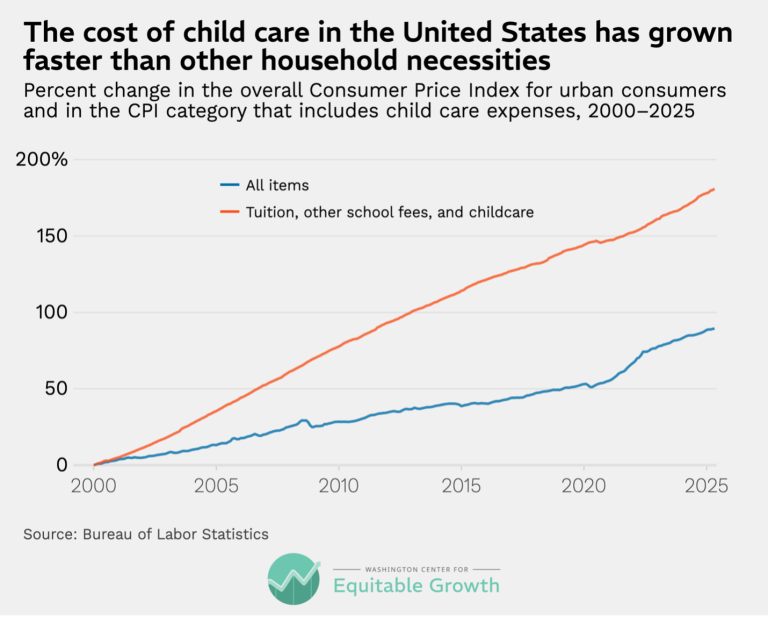
The cost of child care in the United States has grown faster than other household necessities (opens in a new tab)
Visualizations Apr 15, 2026
 View Chart
(opens in a new tab)
View Chart
(opens in a new tab)
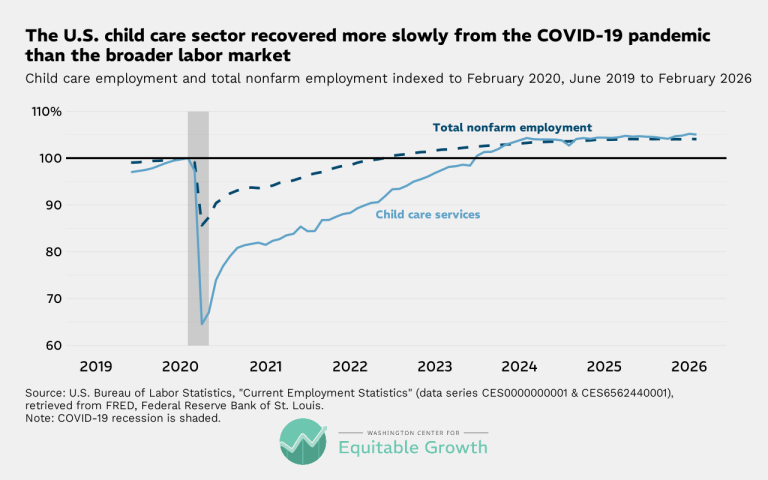
The U.S. child care sector recovered more slowly from the COVID-19 pandemic than the broader labor market (opens in a new tab)
Visualizations Apr 8, 2026
 View Chart
(opens in a new tab)
View Chart
(opens in a new tab)
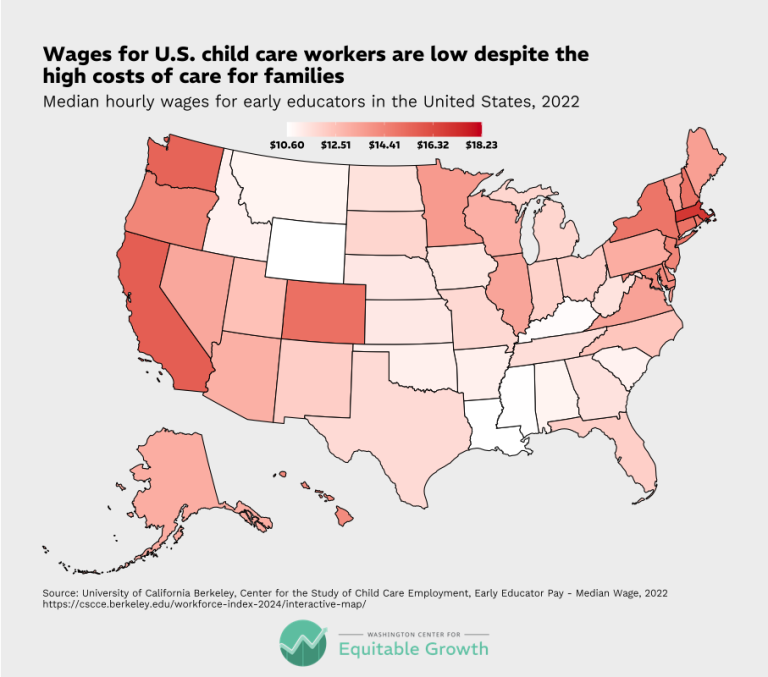
Wages for U.S. child care workers are low despite the high costs of care for families (opens in a new tab)
Visualizations Apr 8, 2026
 View Chart
(opens in a new tab)
View Chart
(opens in a new tab)
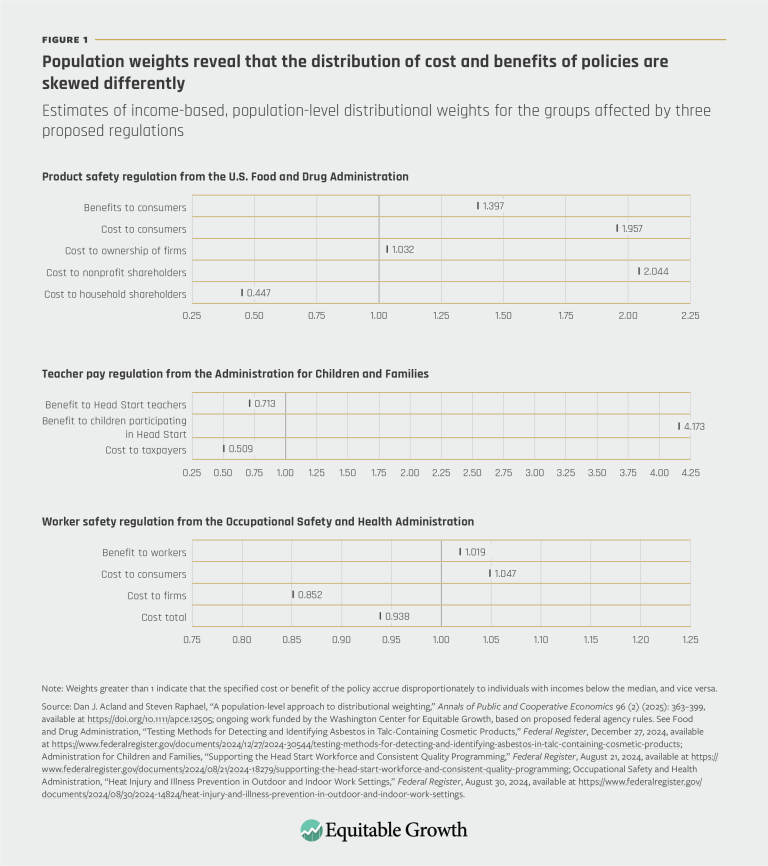
Population weights reveal that the distribution of cost and benefits of policies are skewed differently (opens in a new tab)
Visualizations Nov 13, 2025
 View Chart
(opens in a new tab)
View Chart
(opens in a new tab)
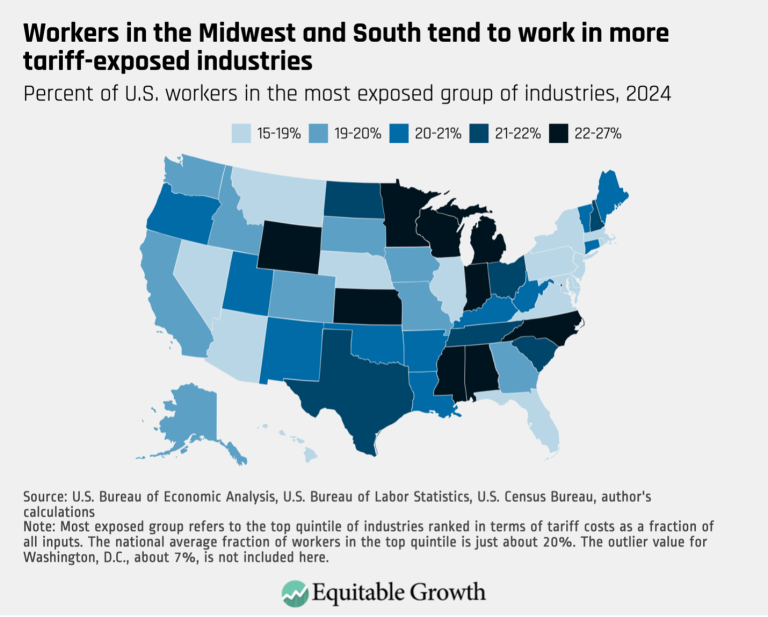
Workers in the Midwest and South tend to work in more tariff-exposed industries (opens in a new tab)
Visualizations Nov 3, 2025
 View Chart
(opens in a new tab)
View Chart
(opens in a new tab)
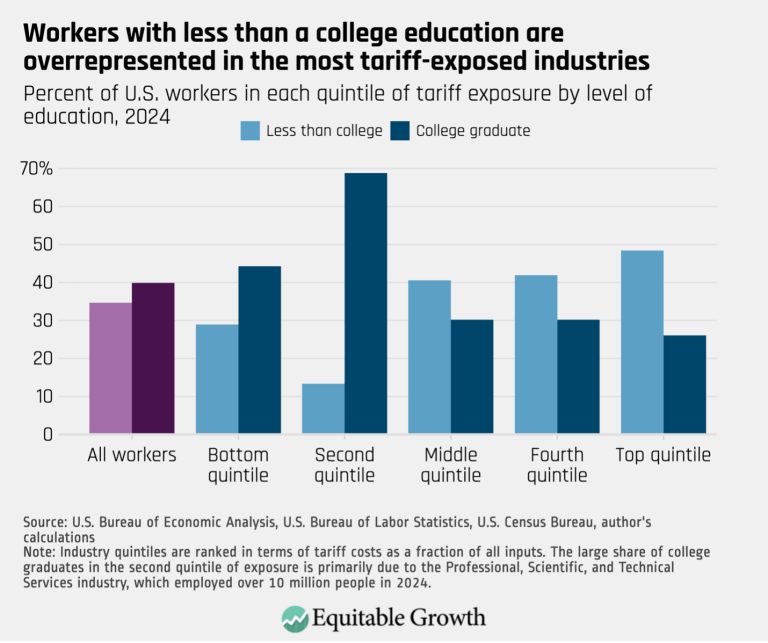
Workers with less than a college education are overrepresented in the most tariff-exposed industries (opens in a new tab)
Visualizations Nov 3, 2025
 View Chart
(opens in a new tab)
View Chart
(opens in a new tab)
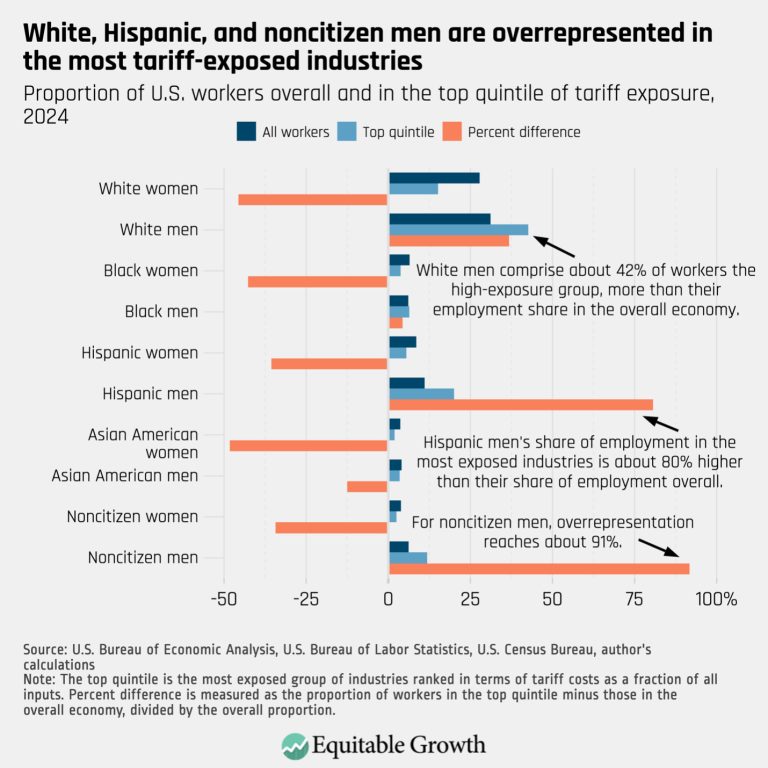
White, Hispanic, and noncitizen men are overrepresented in the most tariff-exposed industries (opens in a new tab)
Visualizations Nov 3, 2025










































Your Source for the Latest Insights
Get updates on our latest research, event announcements, and policy insights delivered straight to your inbox. Stay connected with the leading voices on equitable growth.