
New research shows how U.S. homeownership and the accumulation of housing wealth are linked to political participation
Essays AUG 14, 2026
By: Carlos Fernando Avenancio-Leon
DEC 20, 2019
By: Corey Husak
The primary purpose of taxation is to fund public spending in a fair manner. When analyzing proposed tax changes, tax economists must make complex assumptions about how people would respond to those changes and what that means for the incidence of the tax changes, meaning who would ultimately receive a tax cut or pay for a tax increase. Luckily, the economic effects of a federal tax change are summarized succinctly and intuitively by rigorous, nonpartisan groups such as the Joint Committee on Taxation (opens in a new tab) and the Tax Policy Center (opens in a new tab) in the form of a revenue analysis (opens in a new tab) and a distribution table (opens in a new tab).
As Greg Leiserson, Equitable Growth’s director of Tax Policy and chief economist, notes, “If U.S. tax reform delivers equitable growth, a distribution table will show it.” Numerous complex calculations and assumptions underlie the production of revenue and distribution tables, but when done well, they provide the key information that policymakers need to know about how tax changes will impact the populations they care about. This may seem like a simple point, but all too often, arguments about tax policy ignore these fundamental sources of information, instead focusing on narrow, misleading claims about economic growth and job creation.
On December 6 and December 13, Equitable Growth hosted our “Economics of Taxation” courses in the U.S. Capitol building to help congressional staffers understand these tools of tax analysis and the trade-offs in designing tax policy. Our first day, “Tax Basics,” was an introduction to the federal tax system. The second day, “Taxes and Consequences,” covered most of the topics presented below in this column and how to understand and evaluate taxes in an intellectually rigorous and coherent manner.
Revenue estimates show how much revenue a tax law will collect or lose. U.S. policymakers ultimately face choices between revenues and spending, and the revenue impacts of federal tax legislation determine how much public spending and investment a tax increase can finance or, in the case of tax cuts, how much spending will need to be cut. In general, there are two different types of revenue estimates produced by groups that “score” legislation:
Both types of scores fulfill different purposes and are only useful insofar as the assumptions underlying them. Dynamic scores also are vulnerable to timing gimmicks. For instance, bills can generally increase growth within the standard 10-year scoring window simply by borrowing money from the future.
Distribution analyses assign the taxes cut or raised to the people ultimately responsible for paying the taxes, a concept called “incidence.” For instance, cuts in corporate taxes may be partially assigned to shareholders and partially to workers in different percentages, if the economist believe that is where the incidence lies.
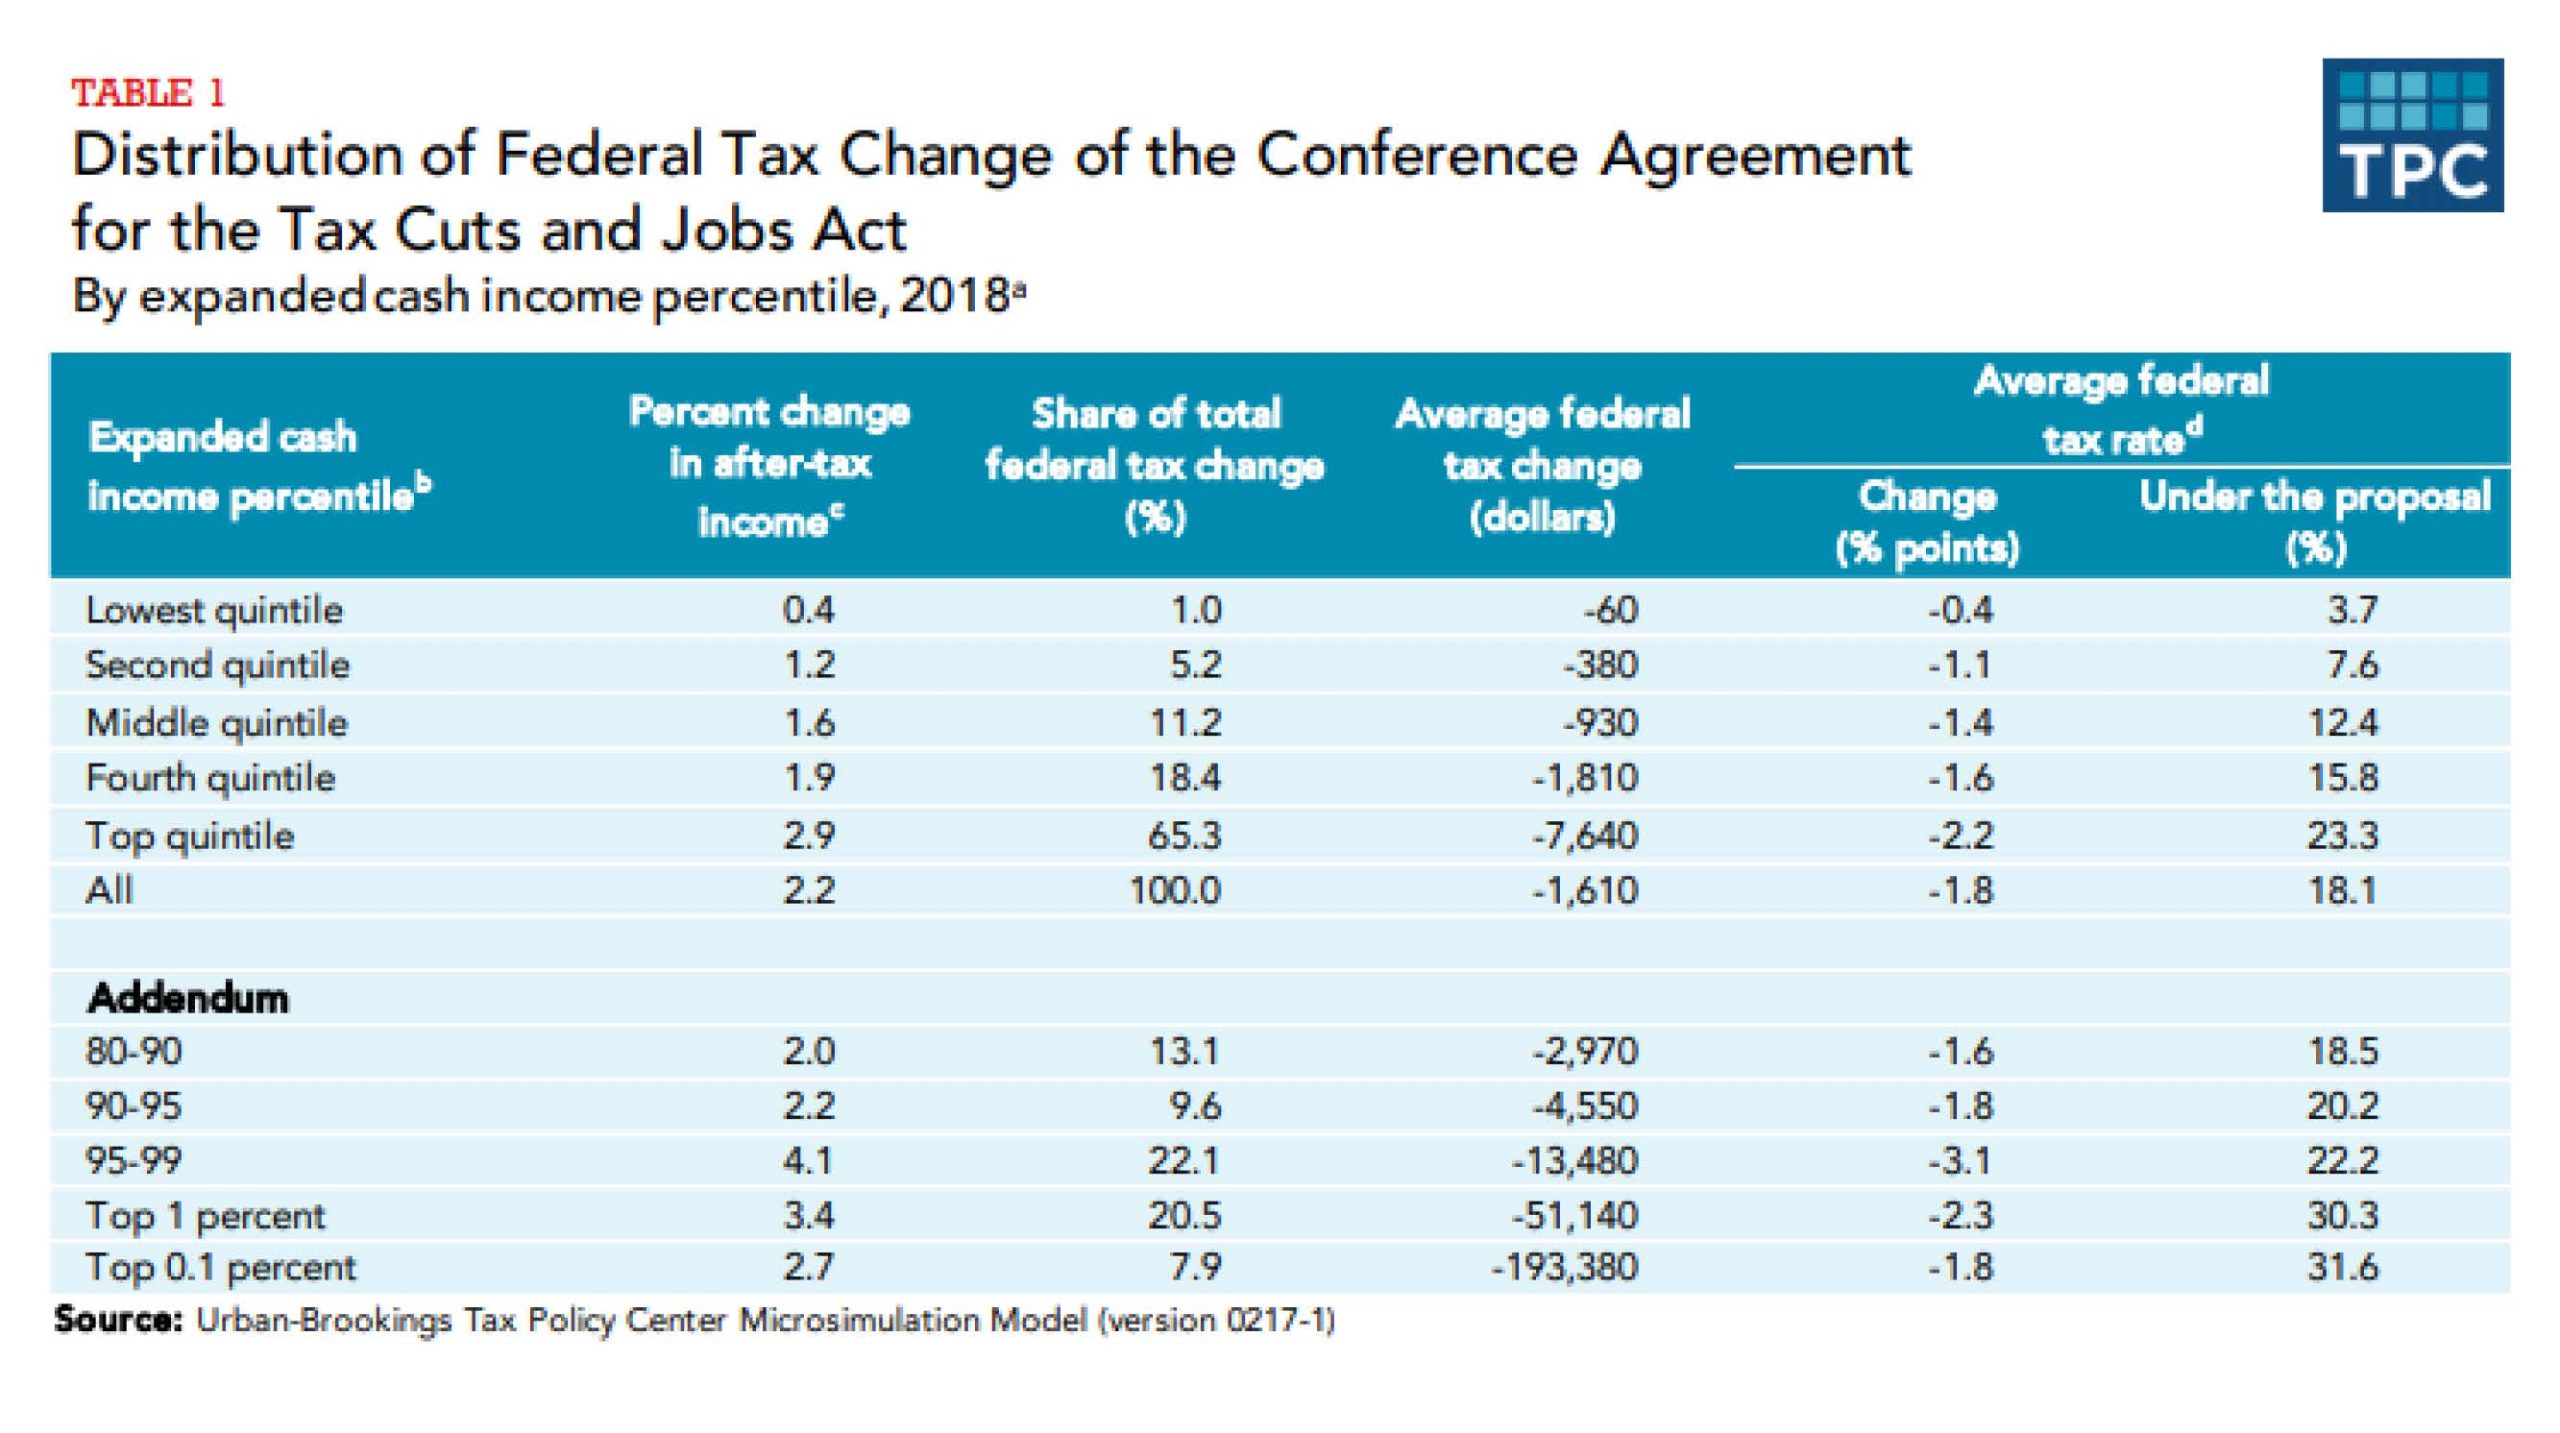
Generally, the most useful way to present tax changes is using the percent change in after-tax income, which normalizes a tax cut by the recipient’s own income. This normalization is important because $10 is worth more to a poorer person than to a richer person, so this metric allows us to compare quantities in a way that is meaningful to individuals and families. Using this metric, the tax cuts in the 2017 Tax Cuts and Jobs Act were about 10 times as large for people in the top 5 percent as for those in the bottom 20 percent in 2018, as a share of each family’s income. (See Table 1.)

Tax Policy Center
The share of the federal tax change and the average federal tax change also can be instructive. In Table 1, two of the columns detail that 20.5 percent of the value of the tax cut in 2018 went just to 1 percent of the population, and this is more than went to the entire bottom 60 percent of the population (17.4 percent). Table 1 also shows that the average tax cut in the top 1 percent was $51,000, which is 852 times the average tax cut in the bottom 20 percent of the income spectrum.
Although it is most common to see examples of distribution analyses by income group, it is also possible to do distribution analyses by geography, race, and gender (opens in a new tab), or other groupings of people. These kinds of distributional analyses are important to do because they can give U.S. policymakers a more nuanced understanding of where the incidences of tax changes fall.
Economic growth is not as simple a concept as it often seems to be in the popular parlance. While the term may conjure up an image of broadly rising living standards and personal well-being, that is generally not what tax analysts are measuring when they talk about growth from tax changes. As we alluded to with our discussion of “dynamic scores,” economic analyses of growth typically focus on changes in U.S. Gross Domestic Product, or the market value of goods and services produced in the United States in a year.
Thus, U.S. tax laws that cause people to work longer hours, pay more in childcare expenses, or even induce more corporate payouts to foreign investors, can be said to increase growth, even when U.S. families would not consider themselves materially better off as a result of those changes.
In addition, presenting one aggregate growth number can obscure disparate affects across the income distribution. Unfortunately, the gains from growth have gone to the richest Americans in recent decades. The bottom 50 percent of Americans have seen their incomes after taxes rise by only 21 percent since 1980 (opens in a new tab), compared to a 194 percent increase for the top 1 percent. So, even in the abstract, tax changes that affect “economic growth” may not actually affect the living standards of average Americans.
Thankfully, policymakers seeking to understand how a tax change will affect their constituents’ economic well-being can simply look to a distribution table, which captures both the benefits and costs to actual households.
To learn more about these topics, see the presentation slides from both courses here (opens in a new tab) and here (opens in a new tab). And be sure to keep your eyes peeled for more courses such as these coming from Equitable Growth in the future.
Essays AUG 14, 2026
By: Carlos Fernando Avenancio-Leon
Working Papers AUG 14, 2026
By: Carlos F. Avenancio-León, Yutao He, Michael Reher
Videos AUG 13, 2026
By: Equitable Growth
Get updates on our latest research, event announcements, and policy insights delivered straight to your inbox. Stay connected with the leading voices on equitable growth.