
Skip to content
Browse All Resources
Factsheets

APR 30, 2024

Factsheet: What the research says about taxing pass-through businesses

Abstract

In recent years, so-called pass-through businesses have taken center stage in a number of crucial tax policy debates. This large and growing category of U.S. business—which includes sole proprietorships, partnerships such as law firms, private equity companies, and hedge funds, and S-corporations such as retail stores, banks, and other private, closely held companies—receive special tax benefits. Pass-throughs also received a large, regressive tax break known as the qualified business income deduction, or the Section 199A deduction, as part of the Tax Cuts and Jobs Act of 2017.

Why do these tax preferences exist for pass-through businesses? Are they justified? This factsheet dives into existing academic evidence on the rise of pass-throughs and how their lax regulation and low taxation contribute to U.S. income and wealth inequality, as well as efficiency losses that are a drag on overall U.S. economic growth. This factsheet also looks at opportunities for tax avoidance and evasion, which many pass-through owners take advantage of, draining critical resources from the public fisc.

Though this factsheet is focused on federal tax treatment of pass-throughs, it is important to note that state tax treatment can be different, including entity-level franchise fees, withholding requirements, and, more recently, the option of entity-level taxes (opens in a new tab) in order to help pass-through owners circumvent the cap on the state and local tax deduction instituted in 2017.

First, let’s turn to the basics: What is a pass-through business?

What is a pass-through business?

All businesses in the United States that are not C-corporations are treated as “pass-throughs” for purposes of federal taxation. These businesses’ profits (and losses) are “passed through” to the owners, who pay taxes on the business via their personal income tax. C-corporations, in contrast, pay a corporate income tax at the entity level, and then C-corporation shareholders generally pay a second tax if and when they either sell their stock for a “capital gain” or receive a dividend.

The form the income takes when earned by the pass-through business—such as capital gains from investments and ordinary income from general business operations—remains intact when it flows to the owner’s personal tax return, meaning pass-through business owners often pay different tax rates on their different types of income and, for ordinary income, face the progressively structured (opens in a new tab) individual income tax.

Pass-through businesses are able to take many of the same tax deductions to which C-corporations are entitled, such as write-offs for employee wages, equipment depreciation, investment in research and development, and other miscellaneous expenses such as business-related meals. But owners of pass-through businesses must pay tax on their businesses’ incomes in the year that they are earned, even if that income is never actually distributed to owners. Allowing business owners to indefinitely defer tax on undistributed profits, as owners of C-corporations are generally allowed to do, would incentivize inefficient “capital lock” and turn pass-through structures into tax shelters.

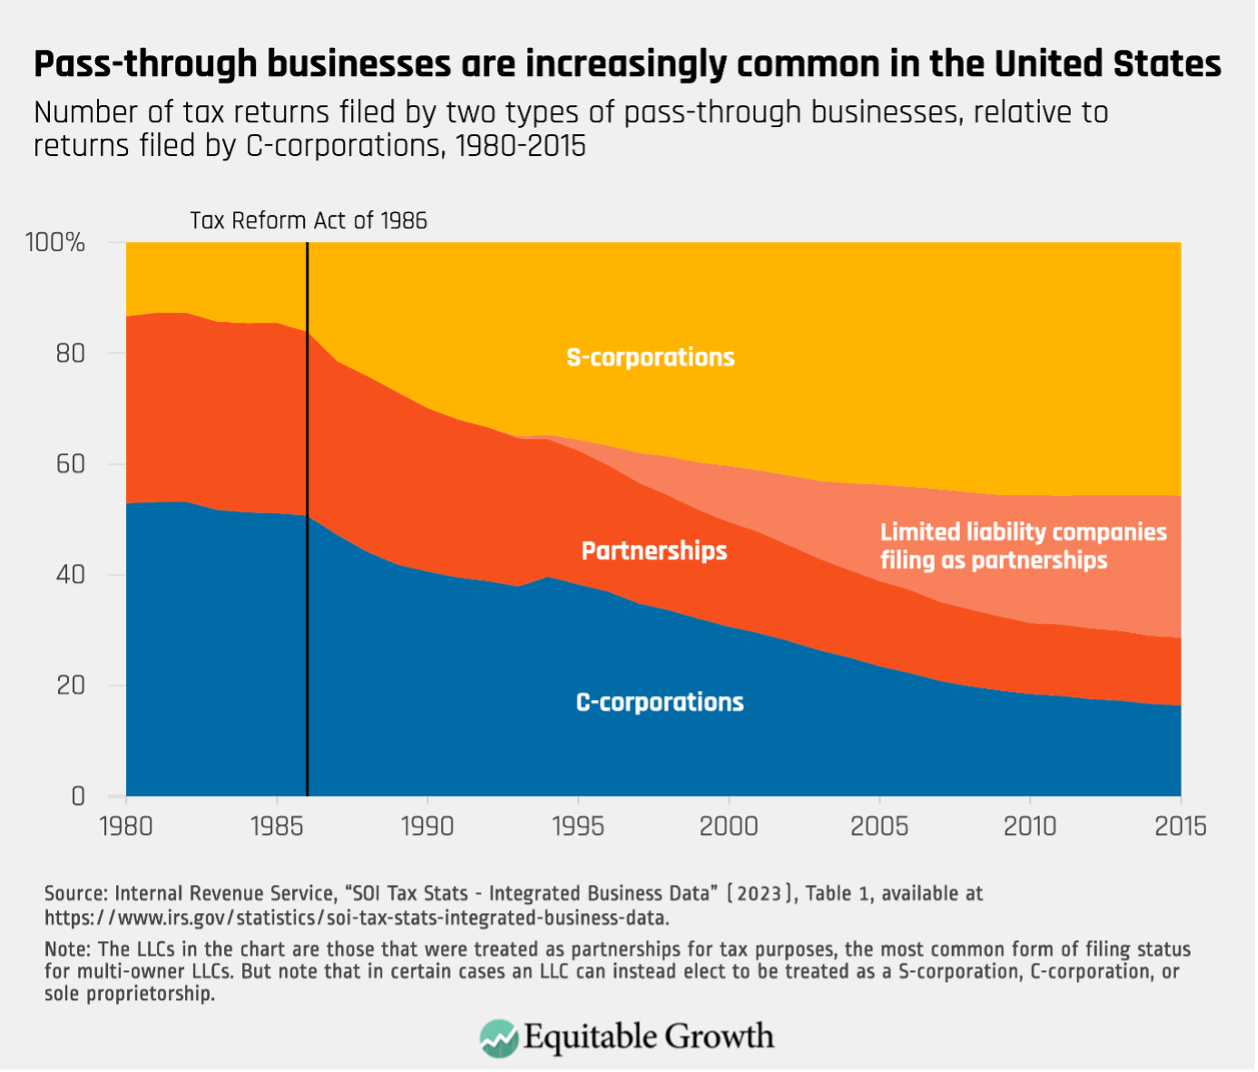
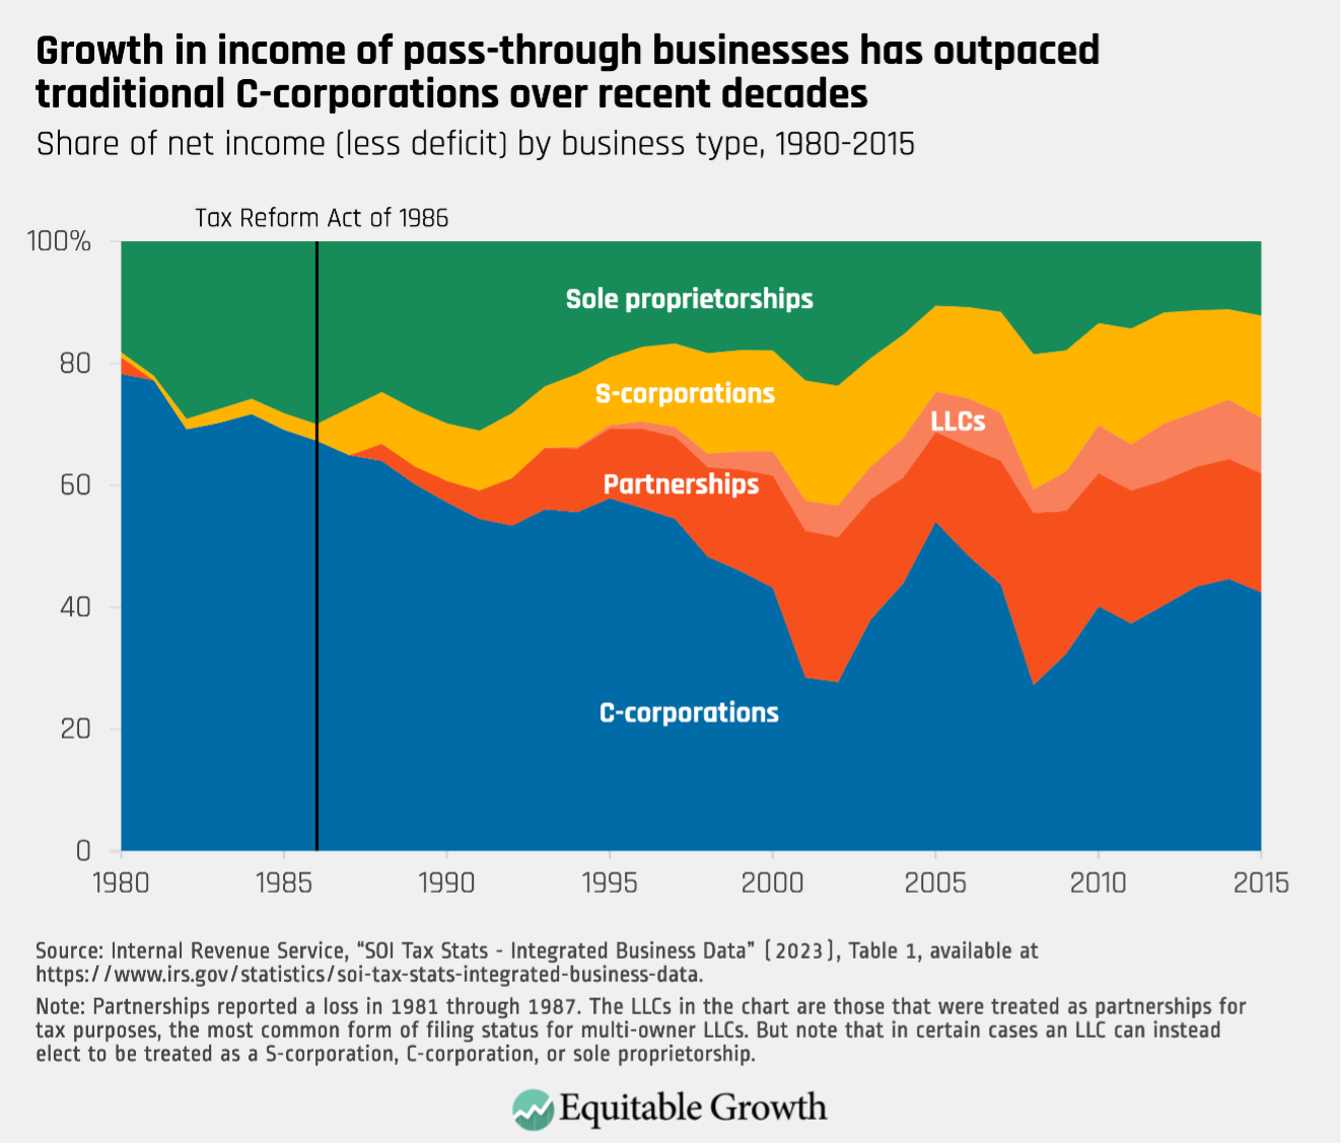
Since the 1986 tax reform bill (opens in a new tab)—which made pass-throughs more attractive by drastically lowering individual tax rates—pass-throughs have become by far the most popular business type in the United States. In 1985, 51 percent of business tax returns, not including sole proprietorships, were filed by C-corporations; in 2015, that figure had plummeted to 16 percent. Pass-throughs have made up the difference, exploding in popularity in part because of the advent of limited liability companies in the 1990s, which, in their multi-owner form, are usually treated as partnerships for tax purposes. (See Figure 1.)

Number of tax returns filed by two types of pass-through businesses, relative to returns filed by C-corporations, 1980-2015

According to tax records (opens in a new tab)—which are probably providing underestimates—pass-throughs earned $1.57 trillion in total net income in 2015.207 That income was generated by 33.4 million tax units, or 95 percent of all business returns. By comparison, 1.6 million C-corporations208 earned a total of $1.15 trillion in net income that same year. (See Figure 2.)

Share of net income (less deficit) by business type, 1980-2015

In 2021 (opens in a new tab), pass-throughs employed 43 percent of the U.S. workforce and 35 percent of total U.S. payroll.209 The United States is an outlier (opens in a new tab) in its widespread use of pass-throughs: It ranks second among the advanced-economy member nations of the Organisation for Economic Co-operation and Development for share of noncorporate businesses at 15 percentage points above the OECD average, which does not include S-corporations, since those are technically still a corporate legal form.

What are the different types of pass-through businesses?

There are three main types of pass-through businesses: sole proprietorships, S-corporations, and partnerships.210 Limited liability companies are usually treated as partnerships for federal tax purposes or, if they have only a single owner, as a sole proprietorship, referred to by tax practitioners as a disregarded entity211

Sole proprietorships

A sole proprietorship is a business run by a single individual or a married couple.212 These businesses generally pay income tax on their business earnings via Form 1040 Schedule C of their owners’ individual tax returns. The types of businesses that file as sole proprietorships are quite varied and include lawyers, contractors, taxi drivers, insurance agents, home healthcare workers, and restaurateurs. Indeed, in 2021, the most popular sectoral classification for sole proprietorships was “other services,” which includes personal and laundry services and auto repair and maintenance, among many others.

There are a lot of sole proprietors in the United States, but they tend to be very small in terms of total income and assets, compared to other business types. In 2021 (the most recent year for which the IRS has released data), there were 29.3 million sole proprietor returns with a total net income of just $411 billion (averaging roughly $14,000 of income per sole proprietor).213 In 2020, sole proprietor profits amounted (opens in a new tab) to 21 percent of total business receipts.

S-corporations

S-corporations have a larger number of shareholders than sole proprietorships, but no more than 100 owners. All owners must be U.S. individuals holding the same class of stock, not foreigners or other business entities. The firms most likely to file as S-corporations are in professional, scientific, and technical services (16.3 percent), construction (13 percent), or real estate and rental and leasing (11.2 percent).214

In 2017 (the most recent year for which the IRS has released complete data), there were 4.7 million S-corporation returns (opens in a new tab).215 In total, these businesses declared $578 billion of net income and held $4.5 trillion in assets.216

Partnerships

Unlike S-corporations, shareholders of partnerships need not be individuals, but instead can be corporations or other partnerships, which themselves can have other corporations and partnerships as shareholders. Partnerships can also easily switch to C-corporation status should that become advantageous, whereas it is much more difficult for C- and S-corporations to change into partnerships.

Many different types of businesses are treated as partnerships for tax purposes, including limited liability companies (71.7 percent of all partnerships in 2021), general partnerships (12.6 percent), limited partnerships (9.9 percent), and limited liability partnerships (3.2 percent).217 More than half of partnerships are in the real estate and rental and leasing sector, but partnerships in the finance and insurance sector earn the most total net income and hold the most assets.

In 2021, the most recent year for which the IRS has released complete data, there were 4.5 million partnership returns declaring a total of $3.89 trillion in net income (opens in a new tab).218 In 2019, partnerships held (opens in a new tab) a whopping $36 trillion in assets. One analysis of 2017 IRS data estimates that partnerships earned more than one-third (opens in a new tab) of reported business income that year.

Are all pass-through businesses “small”?

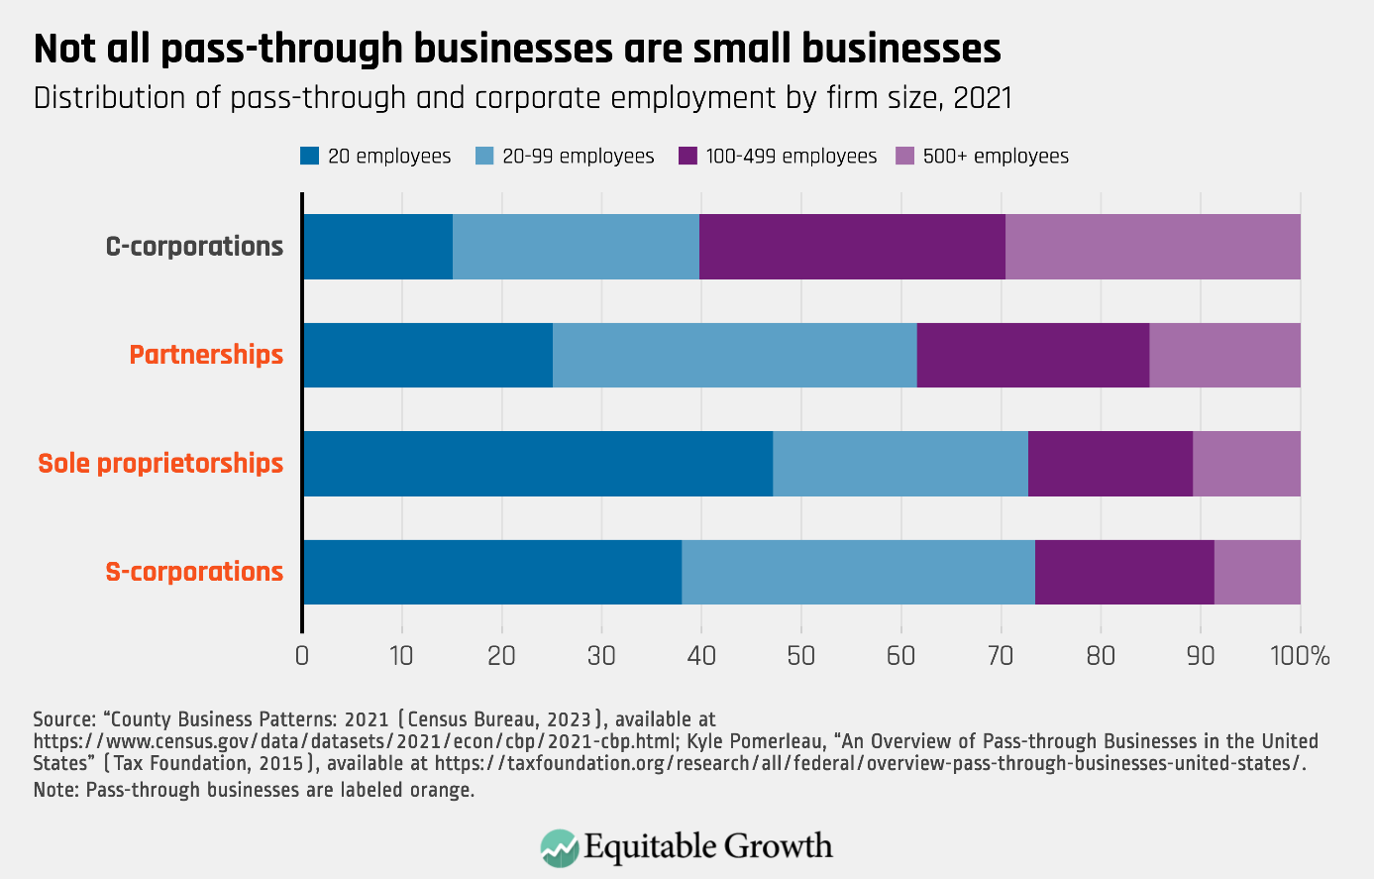
This is a common misconception. While pass-through businesses tend to be smaller both in terms of their number of employees and earnings than C-corporations, there are several exceptions. (See Figure 3.)

Distribution of pass-through and corporate employment by firm size, 2021

In fact, some of the most profitable firms in the United States, even including some publicly traded companies (opens in a new tab), are pass-throughs.219 Activist investor Carl Icahn’s conglomerate Icahn Enterprises, for example, is a publicly traded partnership, as is the gas pipeline behemoth Energy Transfer. Indeed, many oil and gas companies are structured as master limited partnerships, a special form of pass-through business. And, as various (opens in a new tab) investigative (opens in a new tab) reports (opens in a new tab) have (opens in a new tab) revealed (opens in a new tab), many large and highly profitable privately held companies—including ABC Supply Co. (roofing), Bechtel (engineering), Blackstone Group (finance), Bloomberg (media), Carlyle Group (finance), Georgia-Pacific (paper), Fidelity Investments (finance), Kinder Morgan (energy), KKR (finance), MidFirst Bank (finance), Oaktree Capital Management (finance), Pretium Partners (real estate), RMR Group (real estate), StoneMor (funeral services), certain Trump Organization companies (real estate), Uline (packaging), and WeatherTech (auto supplies)—are pass-throughs.

This hasn’t stopped pass-throughs from claiming “small business” status (opens in a new tab) in political debates, exploiting the fact that there is no universally accepted definition of “small.”220 But when U.S. Treasury Department researchers attempted to estimate (opens in a new tab) the number of legitimately small business entities in 2010, they identified 22.2 million pass-through filers,221 which is just more than half of all pass-through returns that claim some business activity.222 These bona fide small businesses account for just 26 percent of net pass-through business income, and only 4 million of them, or fewer than 1 in 5, employ any workers.223 This means that, in 2010, just 1 in 4 dollars in pass-through net income was earned by a bona fide small business, and fewer than 1 in 10 pass-throughs were both legitimately small and employed even a single worker.

In 2010, just 1 in 4 dollars in pass-through net income was earned by a bona fide small business, and fewer than 1 in 10 pass-throughs were both legitimately small and employed even a single worker.

Why are pass-throughs advantageous from a tax perspective?

One major reason (opens in a new tab) pass-throughs have grown in popularity is their tax treatment.224 While C-corporations face both an entity-level tax (the corporate income tax of 21 percent) and a shareholder-level tax on dividends (20 percent if “qualified” and received by a high-income investor) and capital gains (20 percent if sold by a high-income investor after holding longer than one year),225 pass-throughs only face one level of tax. This tax has historically been lower than the combined C-corporation rate, even for those owners in the highest marginal income tax rate bracket (currently 37 percent).226

In fact, one analysis (opens in a new tab) of partnerships in 2011 estimated that those businesses face an average effective tax rate of just 15.9 percent, largely because partnerships in the finance sector can classify much of their income as capital gains and can deduct various expenses and losses. Considering that the Tax Cuts and Jobs Act of 2017 lowered taxes for pass-through firms, this number is likely even lower today.

How does the rise of pass-throughs contribute to U.S. economic inequality?

Owners of pass-through businesses tend to be White, male, and older (opens in a new tab)—demographic groups that already earn more than their non-White, female, and younger peers. They also tend to be high-wealth individuals: In 2023, it is estimated that 20 percent of the top 1 percent’s total assets are in “private businesses,” a category that largely overlaps with pass-throughs. This amounts to 53 percent of all private business assets.227

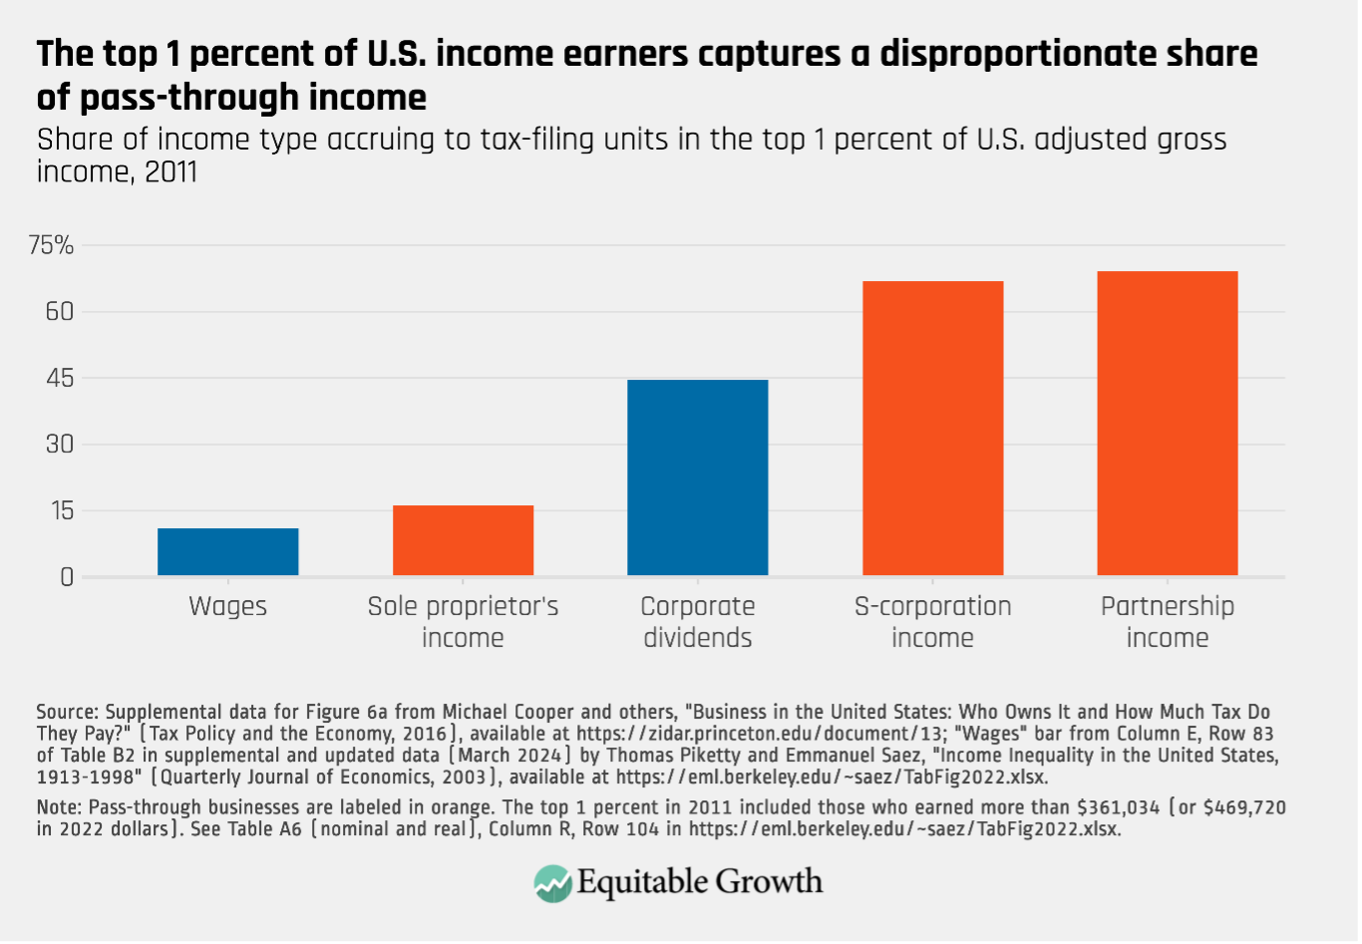
Pass-through owners not only tend to come from wealthy backgrounds but also tend to have high incomes. A Congressional Research Service analysis from 2011 (opens in a new tab) finds that 63 percent of pass-through income was earned by taxpayers with an adjusted gross income higher than $250,000, and 32 percent was earned by individuals with an AGI of more than $1 million. The Joint Committee on Taxation estimates (opens in a new tab) that the top 0.01 percent earned 35 percent of its total income (opens in a new tab) via pass-throughs in 2019, whereas the bottom 90 percent received just 9 percent of its income via pass-throughs. An academic analysis (opens in a new tab) of 2011 tax returns finds that 69 percent of partnership income and 67 percent of S-corporation income accrued to the top 1 percent (those making more than $361,034) that year.228 (See Figure 4.)

Share of income type accruing to tax-filing unites in the top 1 percent of U.S. adjusted gross income, 2011

Before 1986, most profitable firms were organized as C-corporations. After the tax reform of 1986, however, rich business owners began converting to—or began new firms as—pass-throughs to take advantage (opens in a new tab) of the lower tax on owners.

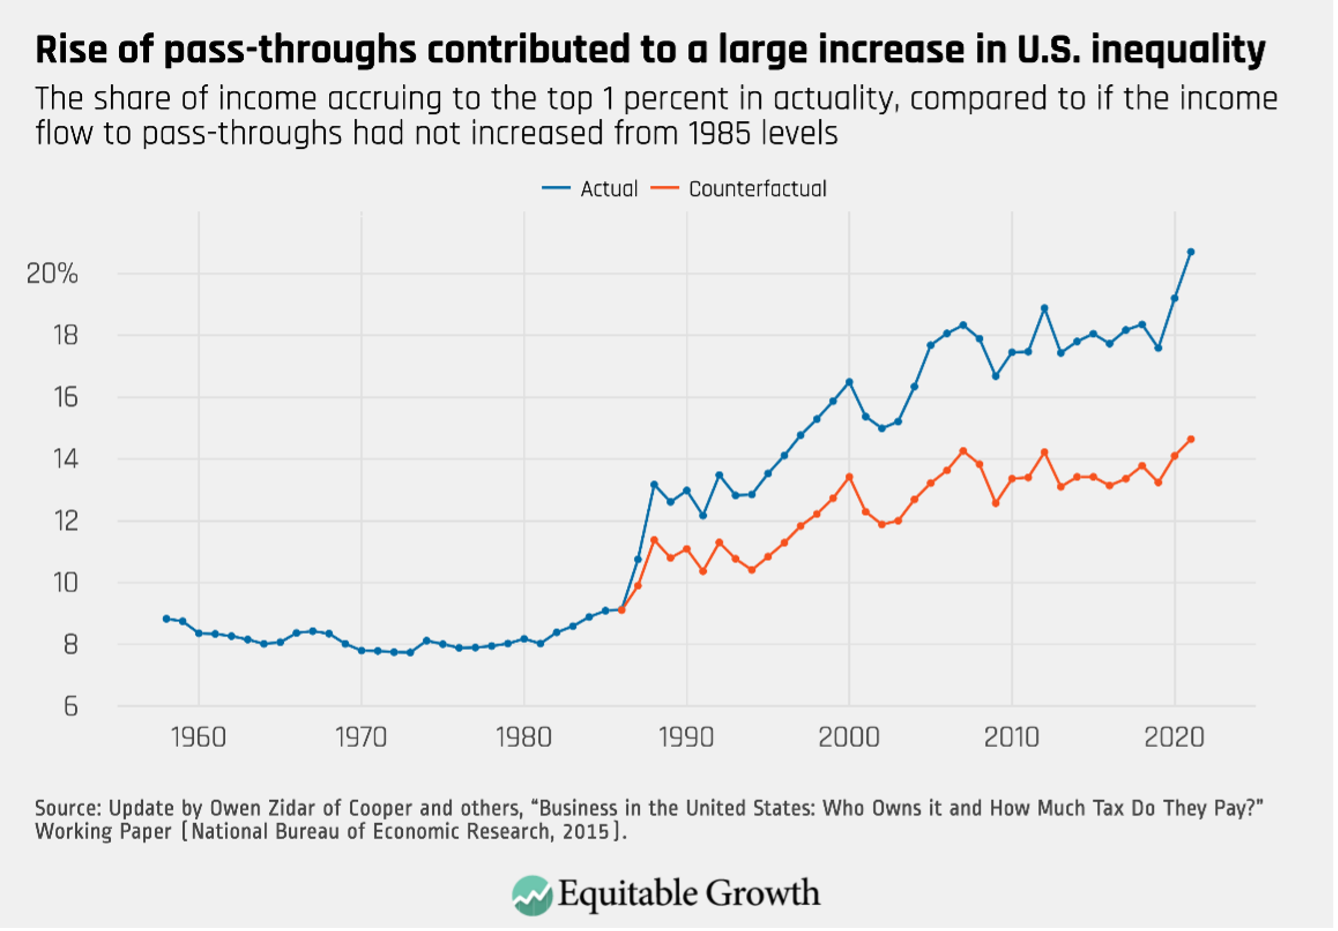
Not surprisingly, then, the rise of pass-throughs has contributed to an explosion in income inequality in the United States, as the rich earn more and pay less in taxes. One rigorous analysis (opens in a new tab) from researchers at Princeton University, the University of Chicago, the University of California, Berkeley, and the U.S. Treasury Department finds that 52 percent of the increase in the income share going to the top 1 percent between 1985 and 2021 came in the form of higher pass-through business income.

In other words, if pass-through income had stayed at its 1985 level, the top 1 percent’s income share would be up just 5.55 percentage points, compared to 1985, from 9.09 percent to 14.64 percent. Instead, the top income share skyrocketed 11.61 percentage points over that period, from 9.09 percent to 20.7 percent. (See Figure 5.)

The share of income accruing to the top 1 percent in actuality, compared to if the income flow to pass-throughs had not increased from 1985 levels

Another study from 2019 finds similar results (opens in a new tab), noting that the pass-through-fueled increase in U.S. inequality is not simply a matter of the form in which the income happens to be generated and reported on tax returns, but also the result of real economic phenomena, including reduced overhead costs for pass-throughs, higher fractions of profits being distributed to pass-through owners, and riskier investments taken on by pass-throughs (to compensate for a less diversified capital raise), compared to C-corporations.229

How has the rise of pass-throughs undermined tax enforcement and contributed to tax avoidance and evasion?

Pass-throughs can be complicated legal structures, and current tax law allows pass-throughs many opportunities for game-playing to reduce federal tax burdens. The result is low audit rates and high levels of tax avoidance and potential evasion.

Take, for example, partnerships. Eighty-five percent of partnerships are simple structures (opens in a new tab) owned by individual taxpayers. But the other 15 percent are highly complex and opaque, using multi-tiered ownership webs (opens in a new tab) that are difficult for tax authorities to trace (opens in a new tab).230

Partnerships also take advantage of lax rules around partner contributions of capital or labor to the business, as well as allocations—how tax gains and losses are distributed—to engage in sophisticated tax planning.231 Two classic examples of this are:

  • The now well-documented “carried interest (opens in a new tab)” loophole, which allows partners of investment firms to be paid for services in the form of long-term capital gains rather than wages, reducing high-income partners’ income tax rate and completely eliminating their self-employment tax liability.
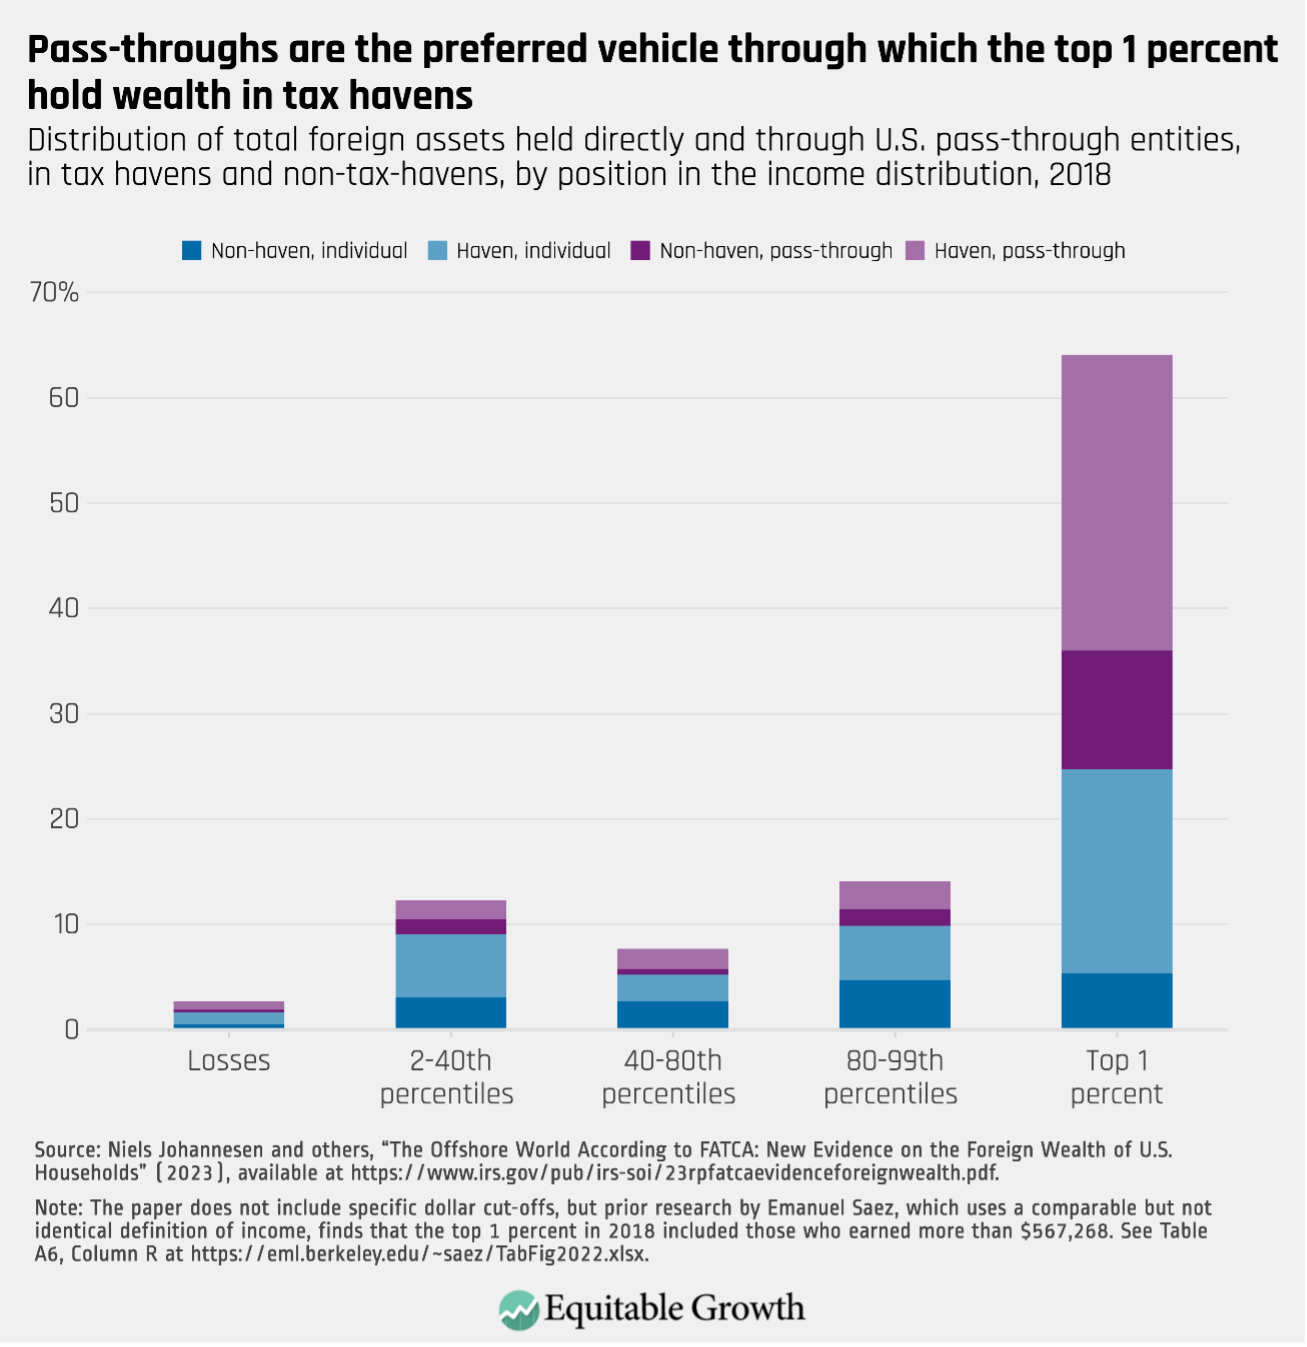
  • So-called blocker corporations in tax havens (opens in a new tab), through which partnerships, particularly private equity firms and hedge funds, can funnel money to shield foreign investors from filing and paying U.S. taxes and to prevent tax-exempt investors, such as pension funds and university endowments, from paying unrelated business taxable income (opens in a new tab).232 These schemes are powered in part by highly flexible “check the box (opens in a new tab)” rules that allow business entities to choose their organizational form for tax purposes. The same firm can select partnership status for the United States and corporate status for a foreign jurisdiction. This is likely one of the reasons why one recent study (opens in a new tab) using new data from the Foreign Account Tax Compliance Act, or FATCA, finds that partnerships are the preferred vehicle through which excessively rich Americans hold wealth in tax havens. In fact, 64 percent of U.S.-owned foreign wealth is held by the top 1 percent, 61 percent of which is funneled through pass-throughs. (See Figure 6.)

Distribution of total foreign assets held directly and through U.S. pass-through entities, in tax havens and non-tax havens, by position in the income distribution, 2018

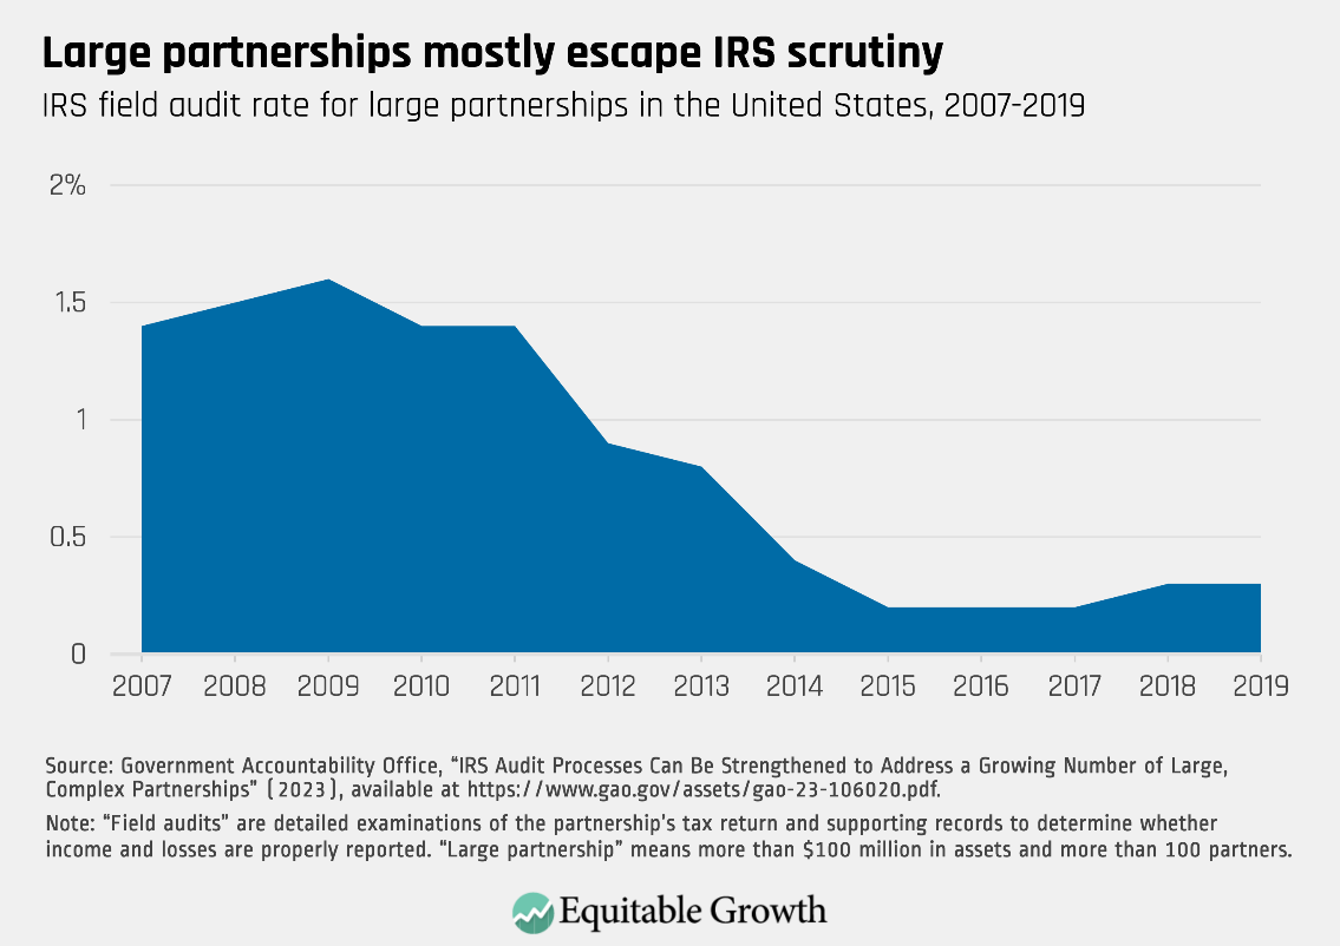
These findings are consistent with other evidence (opens in a new tab) that tax evasion is prevalent among large,233 complex partnerships, which are very (opens in a new tab) rarely (opens in a new tab) audited by the IRS.234 (See Figure 7.)

IRS field audit rate for large partnerships in the united States, 2007-2019

New audit procedures that went into effect in 2018, alongside additional funding for the IRS as part of the Inflation Reduction Act of 2022, may close some of these enforcement gaps.235 One promising enforcement tactic is the use of sophisticated machine-learning, nonlinear models to identify potential underpayment. Academics (opens in a new tab) have shown that these approaches are superior to traditional linear prediction models at identifying tax evasion by partnerships.

S-corporations are also problematic (opens in a new tab) from a tax compliance and enforcement standpoint. Many service companies, such as law firms and doctors’ offices, often miscategorize (opens in a new tab) their owners’ labor income as business income (opens in a new tab) to avoid self-employment taxes (opens in a new tab).236 Famously, former U.S. Sen. John Edwards (opens in a new tab) (D-NC), former U.S. Rep. Newt Gingrich (opens in a new tab) (R-GA), and President Joe Biden (opens in a new tab) have all taken advantage of this loophole. Self-employment taxes help pay for Medicare and Social Security, so this ploy drains resources from those critical social insurance programs.237 Limited partnerships are also able to play this game, though it’s not as straightforward and has been the subject of tougher IRS scrutiny.238

Similarly, sole proprietorships are likely underpaying taxes, according to reports from the Government Accountability Office (opens in a new tab) and IRS (opens in a new tab).239

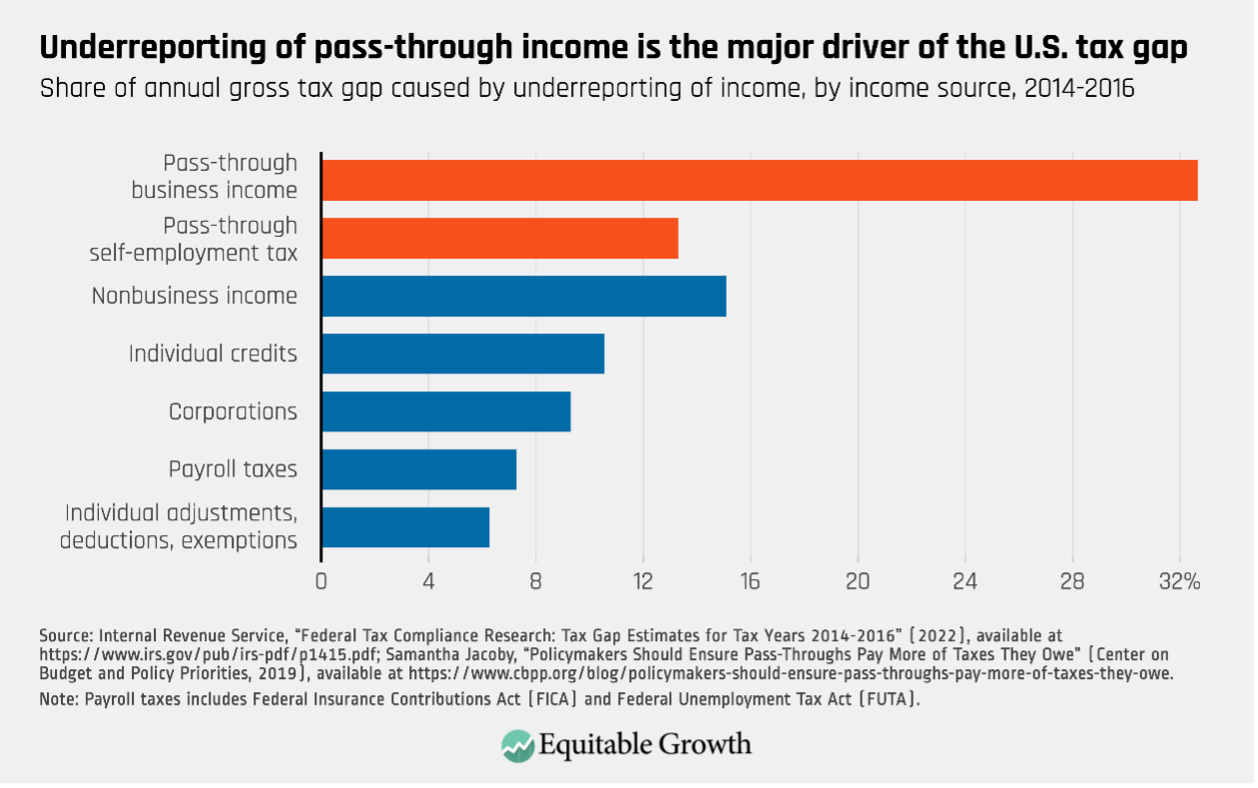
All of the above examples highlight why the underreporting of pass-through income is believed to be the single biggest driver of the tax gap (opens in a new tab), or the difference between what taxpayers owe the IRS and what they voluntarily pay on time (opens in a new tab). (See Figure 8.)

Share of annual gross tax gap caused by underreporting of income, by income source, 2014-2016

How has the rise of pass-throughs affected the overall U.S. economy?

Low tax rates on rich business-owners and loophole-laden tax regulations for pass-throughs are not just bad for equality and tax compliance, but also for the overall U.S. economy. It means fewer resources are available to invest in productivity- and growth-enhancing public programs, such as universal child care, high-quality public education, and green technologies.

In addition to draining the federal government of much-needed resources, this trend toward pass-throughs has negative efficiency effects (opens in a new tab), keeping businesses artificially small and capital constrained. This is because most pass-throughs are not able to be listed on public stock exchanges, putting them at a disadvantage in terms of raising capital. Some academic researchers have modeled this effect, including:

  • Katarzyna Bilicka and former AEA Summer Economics Fellow at the Washington Center for Equitable Growth Sepideh Raei, both from Utah State University, find (opens in a new tab) that eliminating the artificial tax difference between C-corporations and pass-throughs, while keeping total revenue collected constant, would boost aggregate economic output by 1.3 percent due to a more efficient allocation of capital as the most productive firms choose to be C-corporations rather than pass-throughs.
  • Sebastian Dyrda from the University of Toronto and Benjamin Pugsley from University of Notre Dame estimate (opens in a new tab) that the Tax Reform Act of 1986 pushed the most productive firms—and those firms with the richest active owners—to pass-through status, leading each firm to reduce its employment growth by an average of 1.86 percentage points, reducing employment across the U.S. economy by 0.8 percent and reducing aggregate output by 1.1 percent.240 The same authors also helpfully point out (opens in a new tab) that more than three-quarters of all pass-through establishments are nonemployers, belying claims that pass-throughs are engines of job growth.
  • Daphne Chen from Econ One Research, Inc., and Shi Shao Qi and Don Schlagenhauf from Florida State University find (opens in a new tab) that funneling productive businesses toward the pass-through structure also probably costs the economy jobs because C-corporations are less capital-constrained and can thus do more hiring.
  • A separate study (opens in a new tab) from Florida State’s Qi and Schlagenhauf looked at a policy in Kansas that eliminated the state tax on pass-through income, concluding that the reform likely led more businesses to organize as pass-throughs instead of C-corporations, which would explain the reduced output, reduced capital formation, and reduced employment growth experienced after the reform took effect in the state.

There also is an efficiency cost to the amount of time, effort, and money that goes into pass-through tax planning. Many investment funds, for example, expend considerable expense to set up multiple partnerships and blocker corporations to maximize tax savings. The cost of these activities, which serve no real business purpose and could be better spent on any number of other productivity-enhancing endeavors, are what economists call deadweight loss.

How can policymakers improve the taxation of pass-throughs?

There are strong efficiency, fairness, and anti-evasion arguments for equalizing the tax treatment of different business forms. Complete (opens in a new tab) harmonization (opens in a new tab) between (opens in a new tab) C-corporations and pass-throughs, which would require a substantial rewrite of the tax code, is unlikely in the near term.

Even so, some more immediate policy actions could include:

  • Fully funding enforcement efforts at the IRS
  • Closing the “carried interest” loophole, something the most recent Biden administration budget proposes241
  • Closing self-employment tax loopholes, also something the most recent Biden administration budget proposes242
  • Allowing Section 199A—a large, unjustified tax break for pass-through business owners—to expire as scheduled at the end of 2025
Did you find this content informative and engaging? Get Updates

Issue areas

Acknowledgements

I would like to acknowledge the invaluable assistance I received in writing this factsheet from Karen Burke, Jason DeBacker, Sebastian Dyrda (opens in a new tab), Zorka Milin, Gregg Polsky, Kyle Pomerleau, Daniel Reck (opens in a new tab), and Owen Zidar (opens in a new tab). All errors are my own.

Related

Your Direct Line to Cutting-Edge Research

Get updates on our latest research, event announcements, and policy insights delivered straight to your inbox. Stay connected with the leading voices on equitable growth.