



Policy
What Work Does Generative AI Do?
Essays SEP 8, 2026
By: Alexander Bick, Adam Blandin, David Deming, Tyler Schumacher
AI, Tech & Energy
Labor, Wages & Worker Power
 Browse All Resources
SEP 3, 2021

On September 3, the U.S. Bureau of Labor Statistics released new data on the U.S. labor market during the month of August. Below are five graphs compiled by Equitable Growth staff highlighting important trends in the data.
The prime-age employment rate for prime-age workers increased slightly in August from 77.8 percent to 78.0 percent, but remains below pre-recession levels.
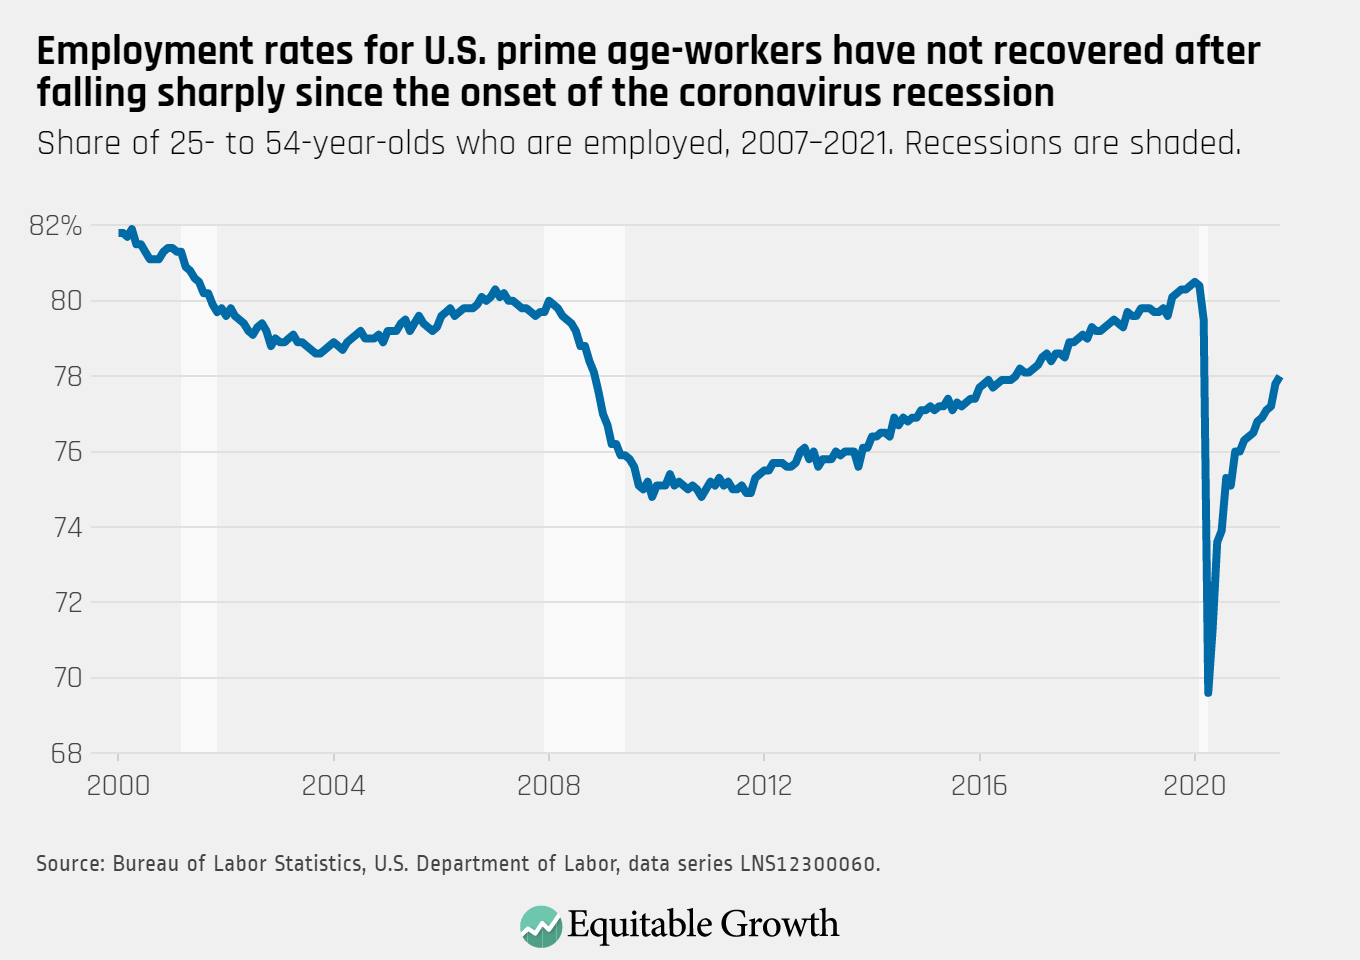
Share of 25-54 year olds who are employed, 2007–2021
The unemployment rate declined for White workers (4.5 percent) but did not change notably for Black workers (8.8 percent), the highest group, or for Latinx workers (6.4 percent) or Asian workers (4.6 percent).
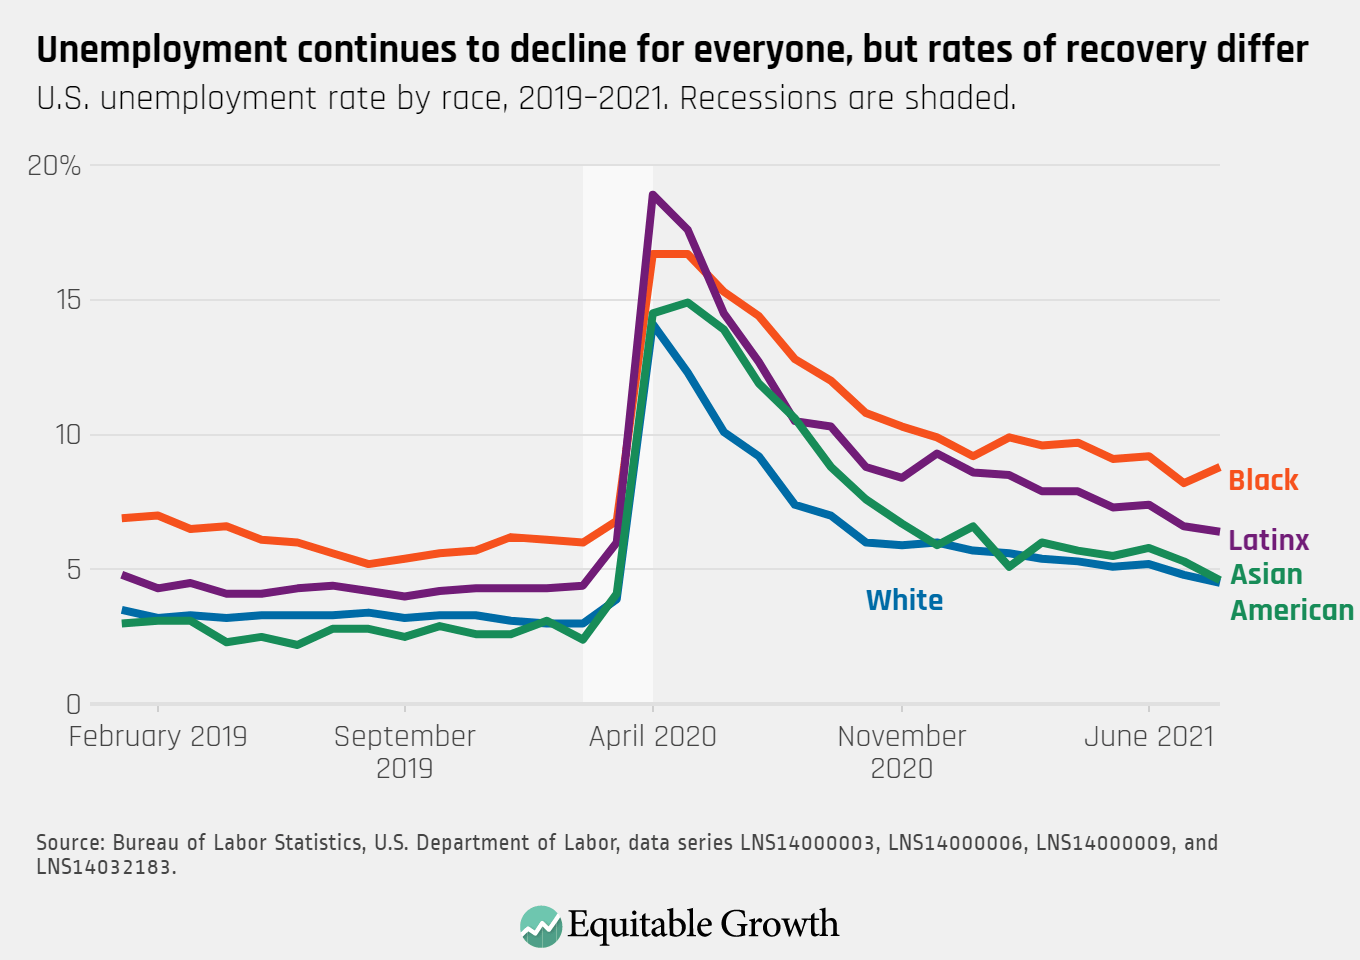
U.S. unemployment rate by race, 2019–2021
The prime-age employment rate for both men and women rose in August, though neither rate has approached its level from immediately before the coronavirus recession.
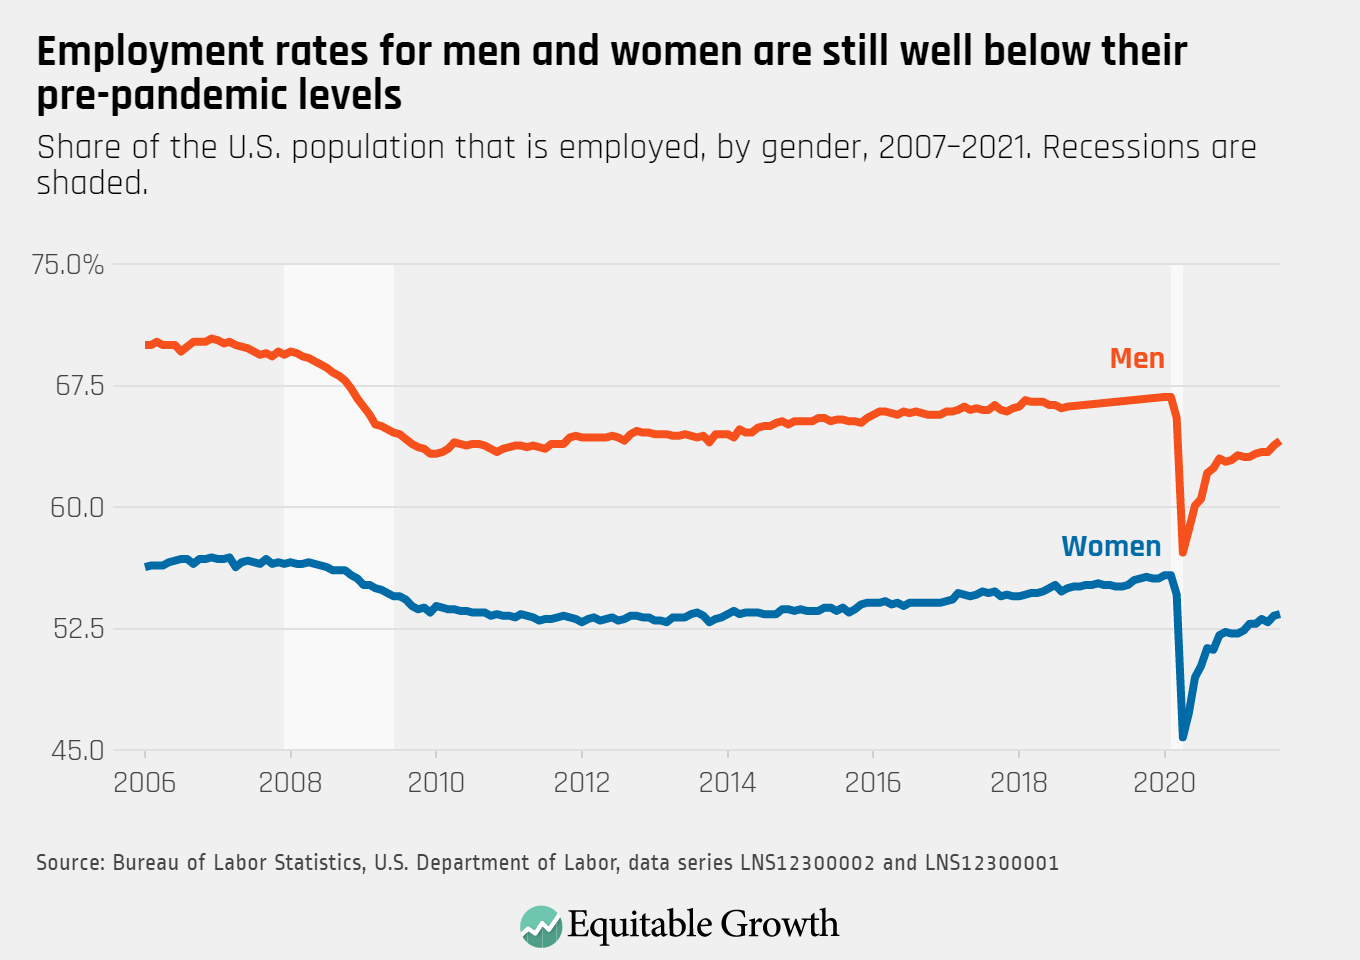
Share of the U.S. population that is employed, by gender, 2007–2021
Top-line unemployment, also known as U-3, and a broader measure of labor underutilization, known as U-6, declined in August, as both overall unemployment and underemployment trended downward.
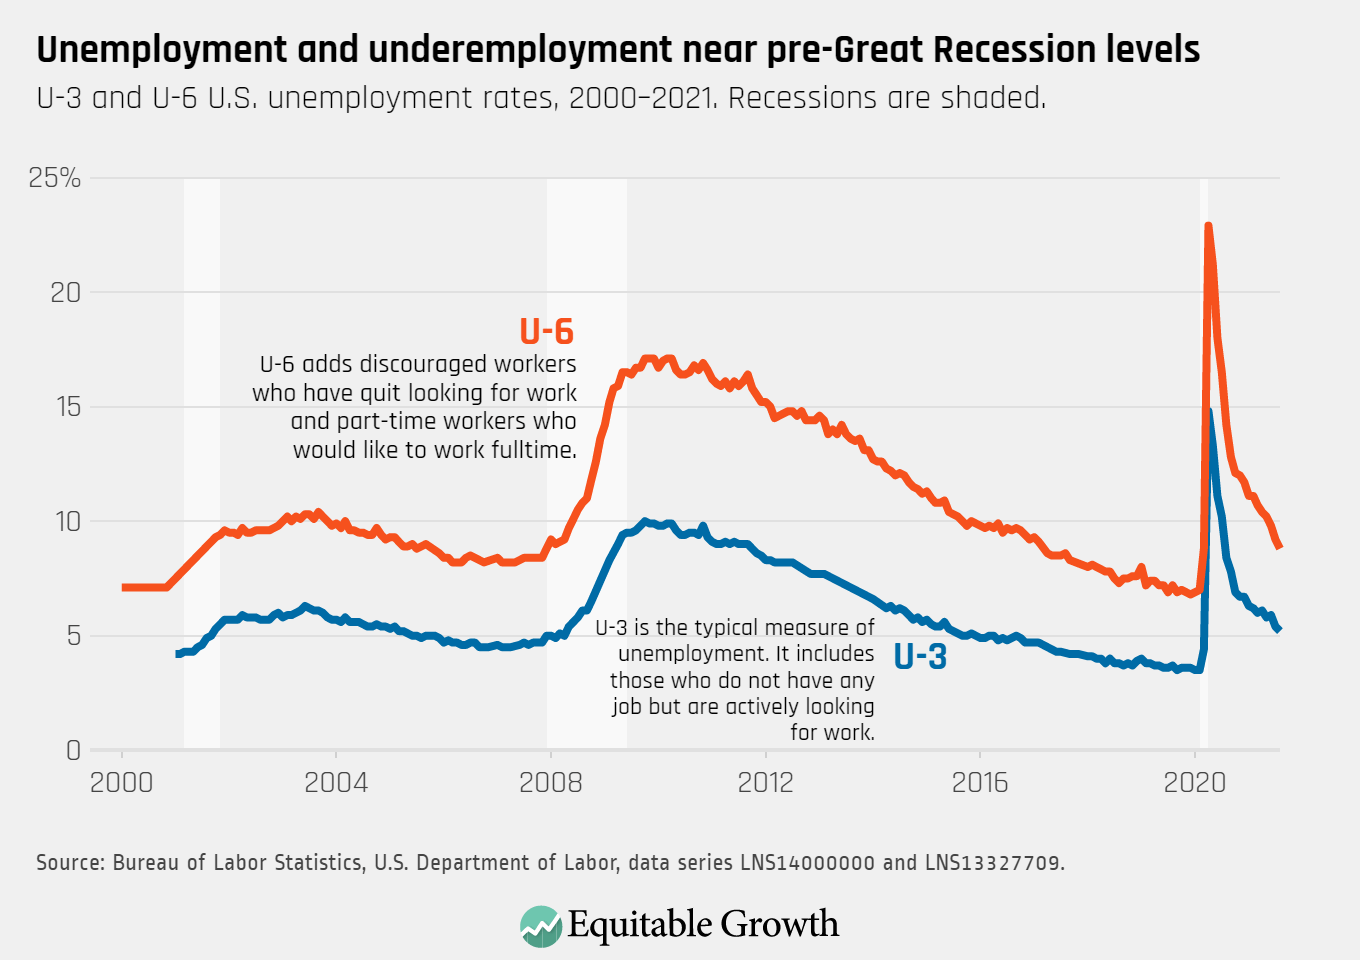
U-3 and U-6 unemployment rates, 2000–2021
The share of unemployed workers who reentered the labor force continued to rise in August, while the share of those who lost their jobs declined. Employment is still elevated relative to pre-coronavirus recession levels.
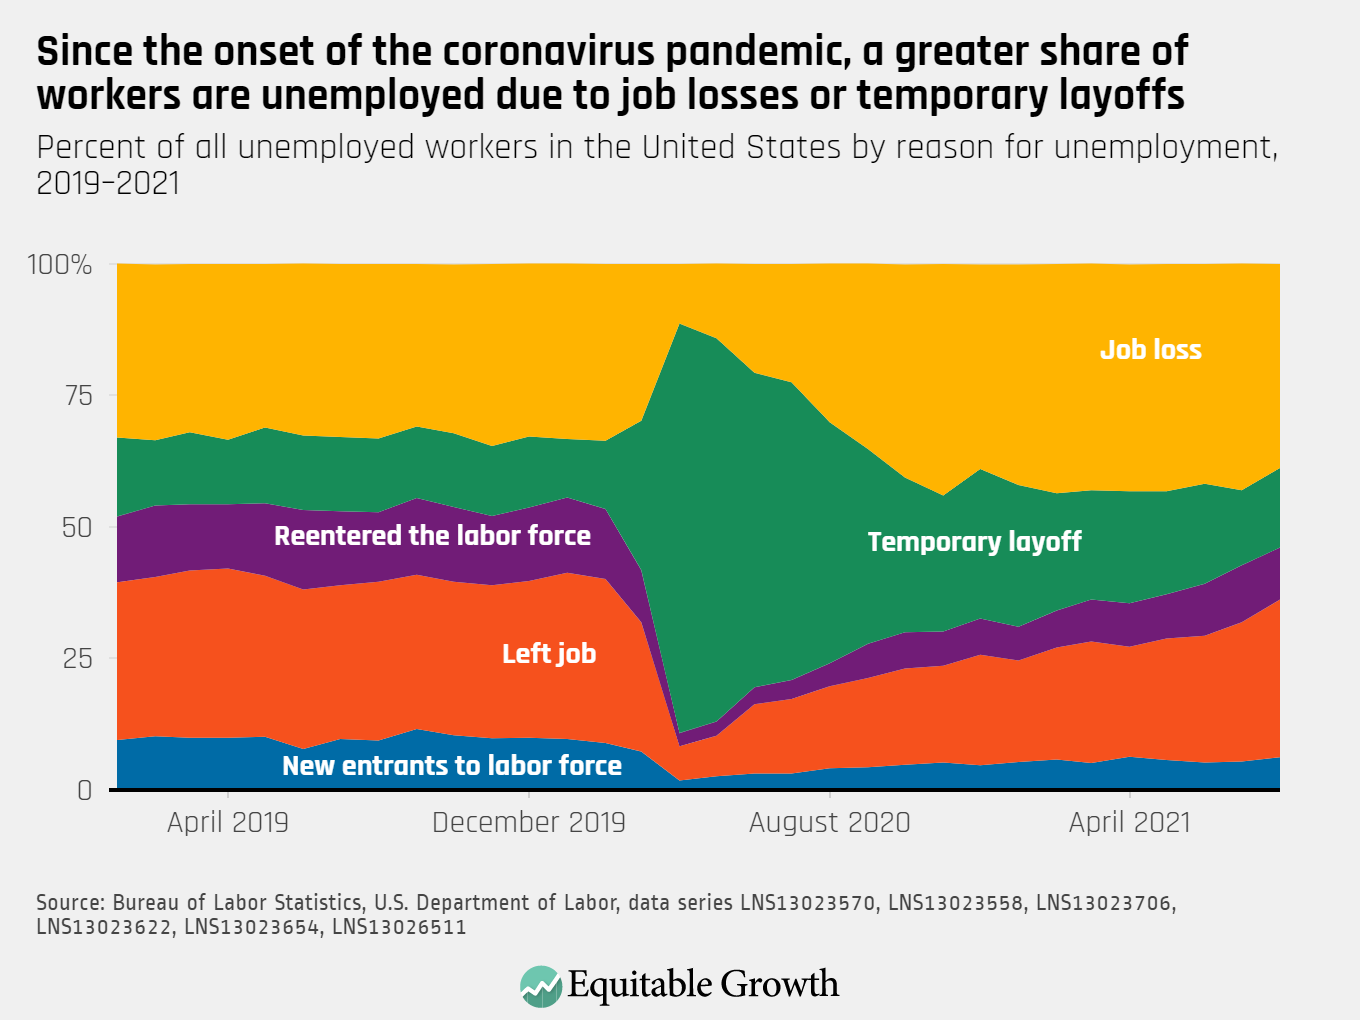
Percent of all unemployed workers in the United States by reason for unemployment, 2019–2021
Essays SEP 8, 2026
By: Alexander Bick, Adam Blandin, David Deming, Tyler Schumacher
Working Papers SEP 8, 2026
By: Alexander Bick, Adam Blandin, David Deming, Tyler Schumacher

Essays SEP 2, 2026
By: Megan Rivera
Get updates on our latest research, event announcements, and policy insights delivered straight to your inbox. Stay connected with the leading voices on equitable growth.


