


Issue Areas
The Washington Center for Equitable Growth is engaged in an array of issues to advance evidence-based ideas and policies that promote strong, stable, and broad-based economic growth.

1,505 Results

 View Chart
(opens in a new tab)
View Chart
(opens in a new tab)
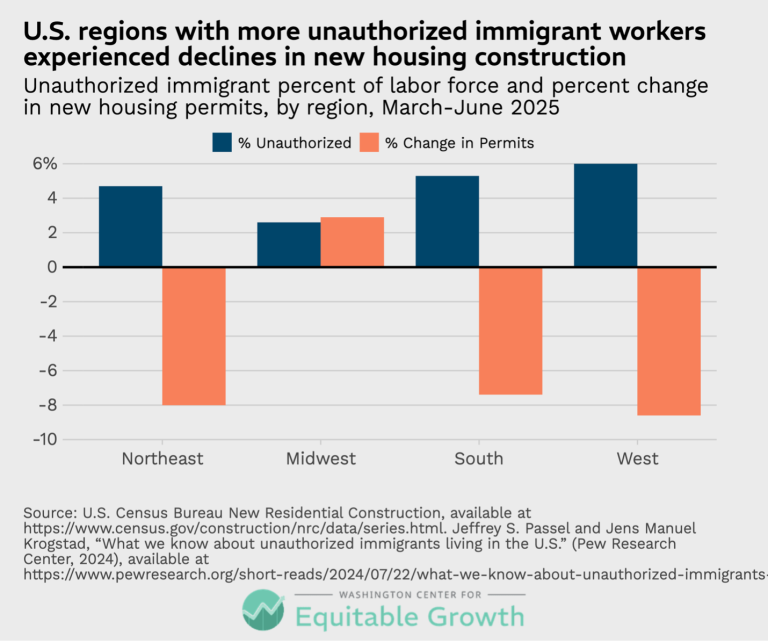
U.S. regions with more unauthorized immigrant workers experienced declines in new housing construction (opens in a new tab)
Visualizations Aug 31, 2026
 View Chart
(opens in a new tab)
View Chart
(opens in a new tab)
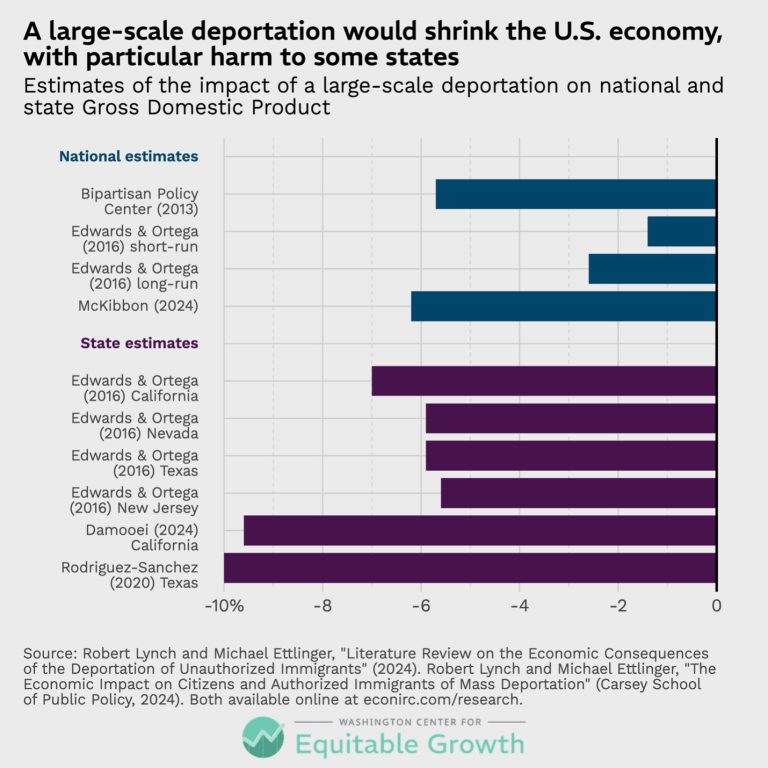
A large-scale deportation would shrink the U.S. economy, with particular harm to some states (opens in a new tab)
Visualizations Aug 31, 2026
 View Chart
(opens in a new tab)
View Chart
(opens in a new tab)
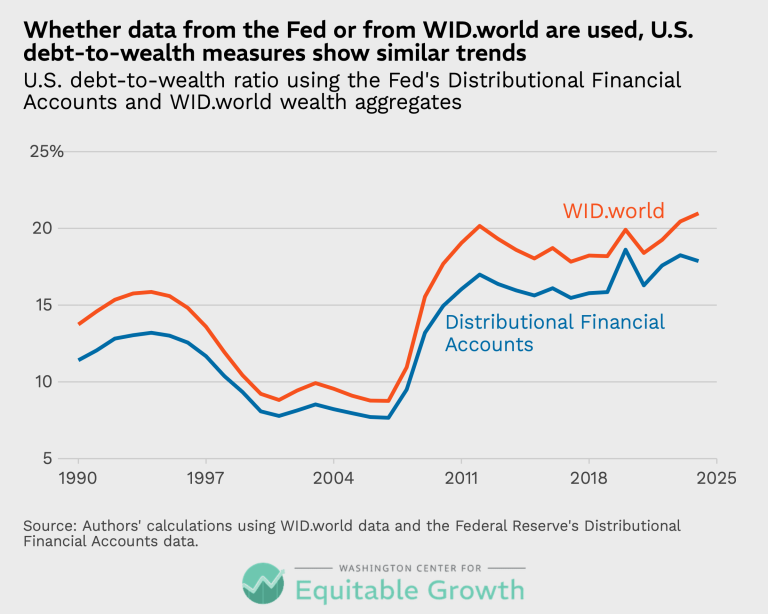
Whether data from the Fed or from WID.world are used, U.S. debt-to-wealth measures show similar trends (opens in a new tab)
Visualizations Jul 22, 2026
 View Chart
(opens in a new tab)
View Chart
(opens in a new tab)
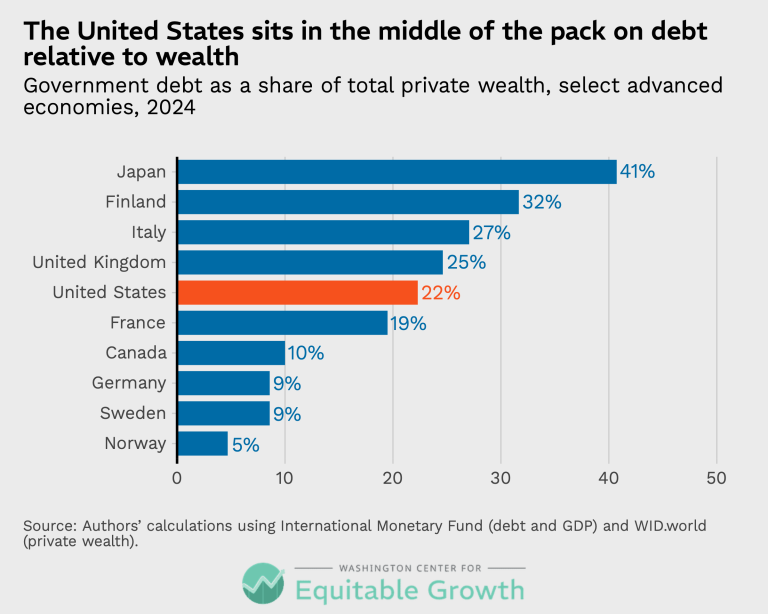
The United States sits in the middle of the pack on debt relative to wealth (opens in a new tab)
Visualizations Jul 22, 2026
 View Chart
(opens in a new tab)
View Chart
(opens in a new tab)
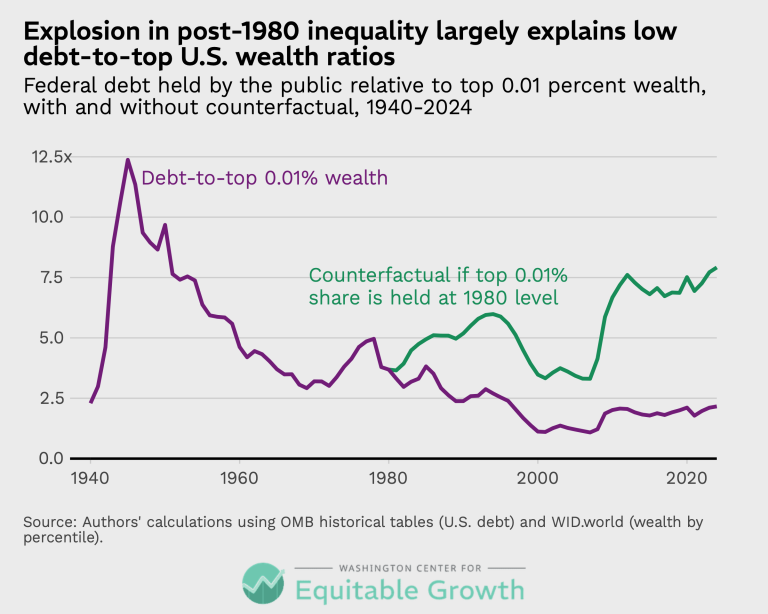
Explosion in post-1980 inequality largely explains low debt-to-top U.S. wealth ratios (opens in a new tab)
Visualizations Jul 22, 2026
 View Chart
(opens in a new tab)
View Chart
(opens in a new tab)
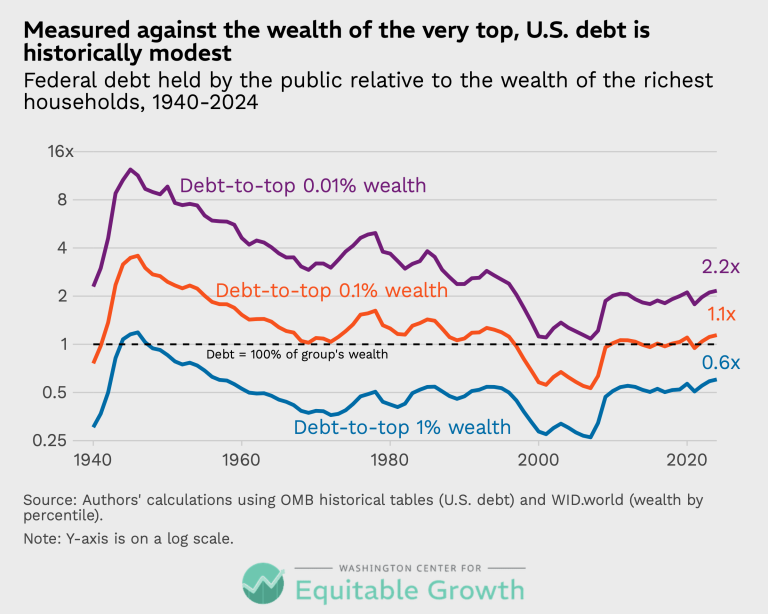
Measured against the wealth of the very top, U.S. debt is historically modest (opens in a new tab)
Visualizations Jul 22, 2026
 View Chart
(opens in a new tab)
View Chart
(opens in a new tab)
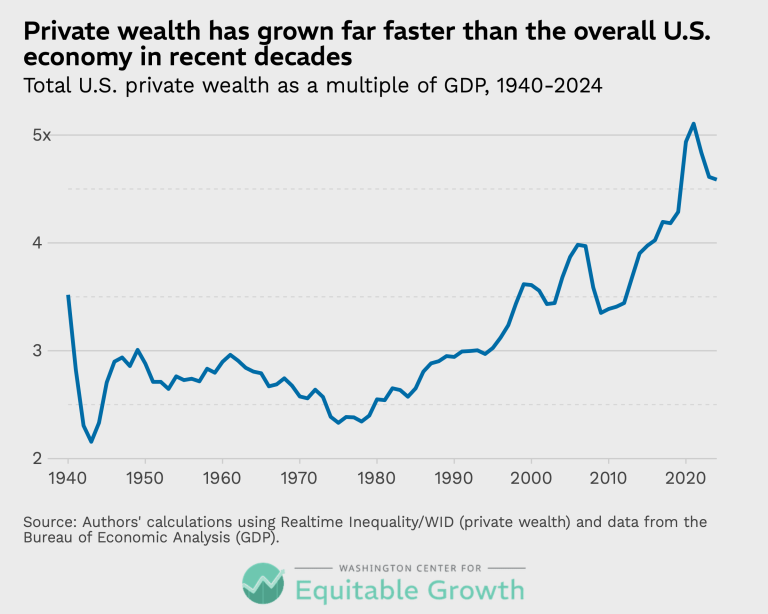
Private wealth has grown far faster than the overall U.S. economy in recent decades (opens in a new tab)
Visualizations Jul 22, 2026
 View Chart
(opens in a new tab)
View Chart
(opens in a new tab)
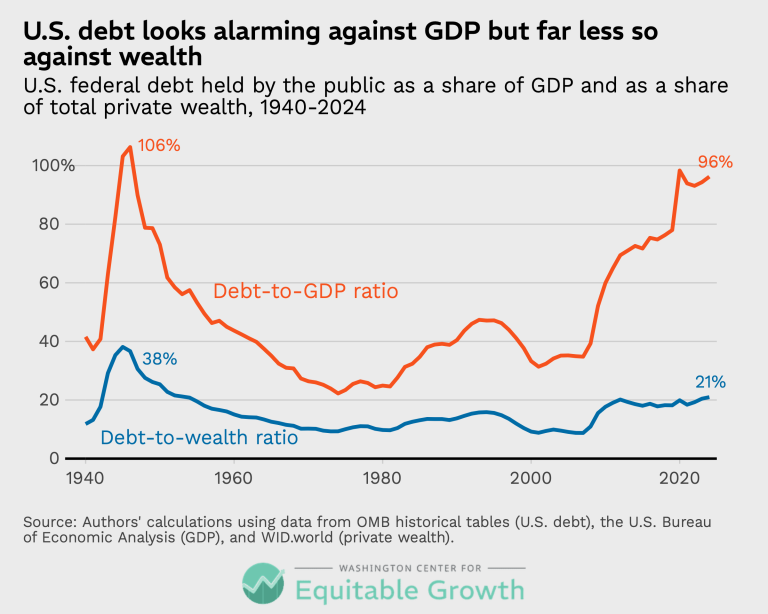
U.S. debt looks alarming against GDP but far less so against wealth (opens in a new tab)
Visualizations Jul 22, 2026
 View Chart
(opens in a new tab)
View Chart
(opens in a new tab)
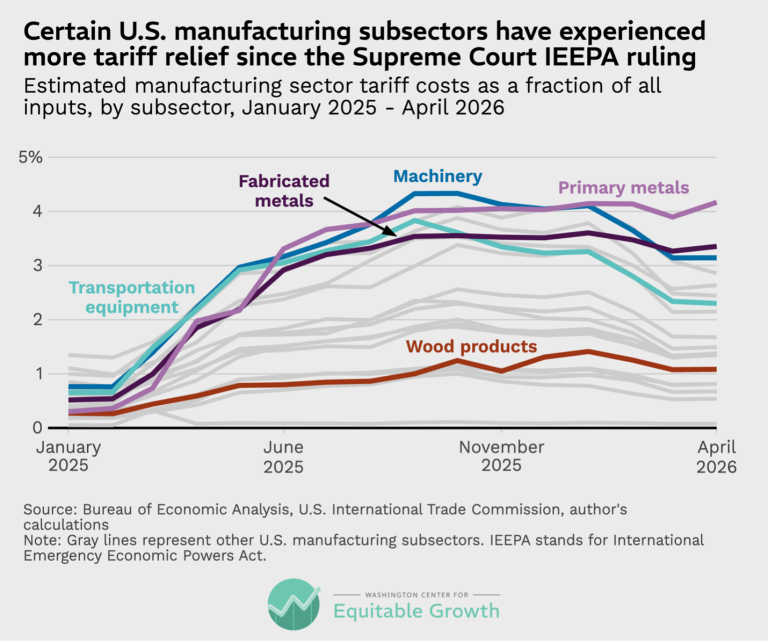
Certain U.S. manufacturing subsectors have experienced more tariff relief since the Supreme Court IEEPA ruling (opens in a new tab)
Visualizations Jul 13, 2026
 View Chart
(opens in a new tab)
View Chart
(opens in a new tab)
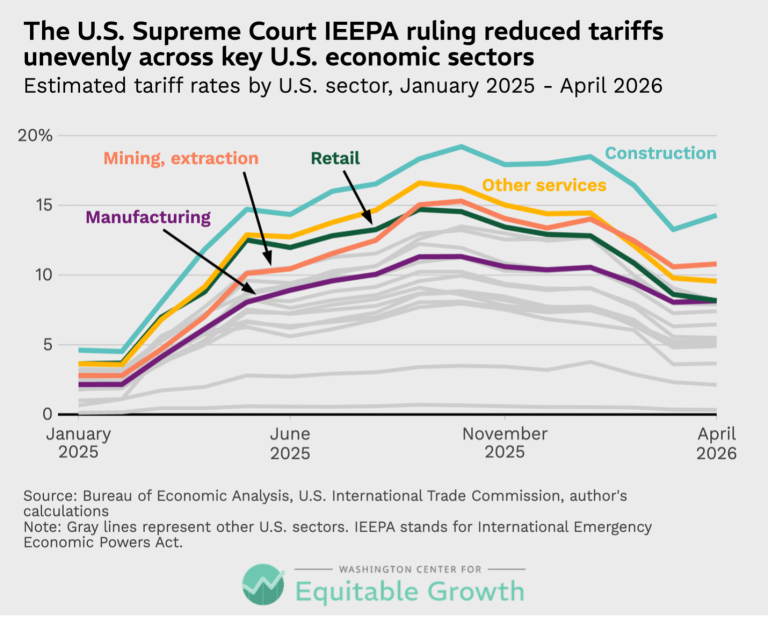
The U.S. Supreme Court IEEPA ruling reduced tariffs unevenly across key U.S. economic sectors (opens in a new tab)
Visualizations Jul 13, 2026
 View Chart
(opens in a new tab)
View Chart
(opens in a new tab)
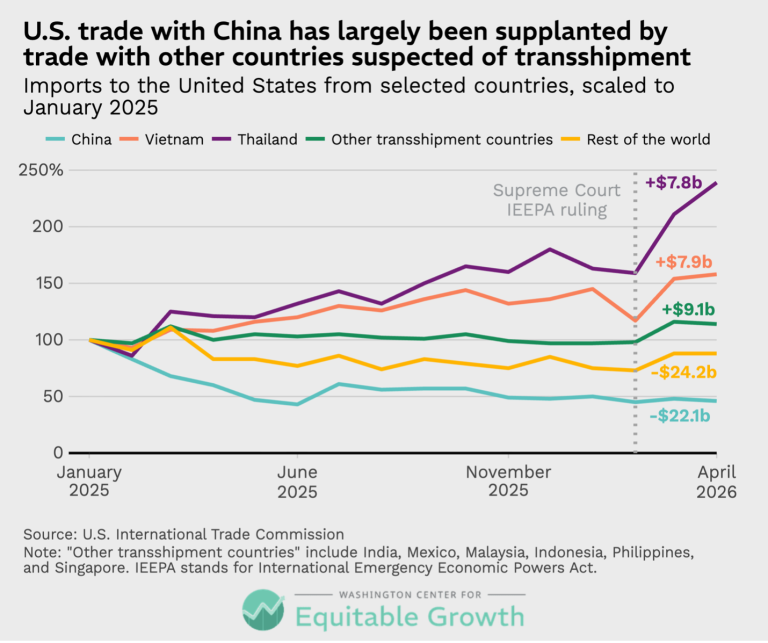
U.S. trade with China has largely been supplanted by trade with other countries suspected of transshipment (opens in a new tab)
Visualizations Jul 13, 2026
 View Chart
(opens in a new tab)
View Chart
(opens in a new tab)
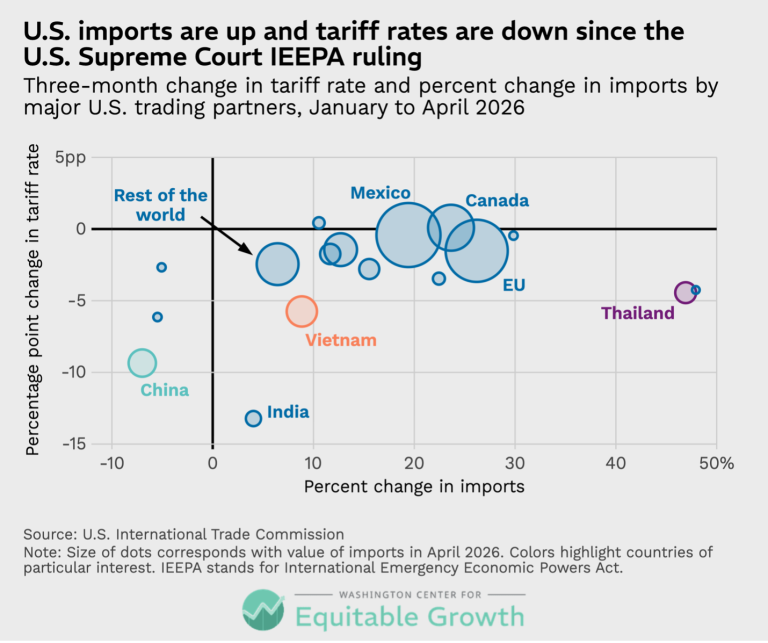
U.S. imports are up and tariff rates are down since the U.S. Supreme Court IEEPA ruling (opens in a new tab)
Visualizations Jul 13, 2026
 View Chart
(opens in a new tab)
View Chart
(opens in a new tab)
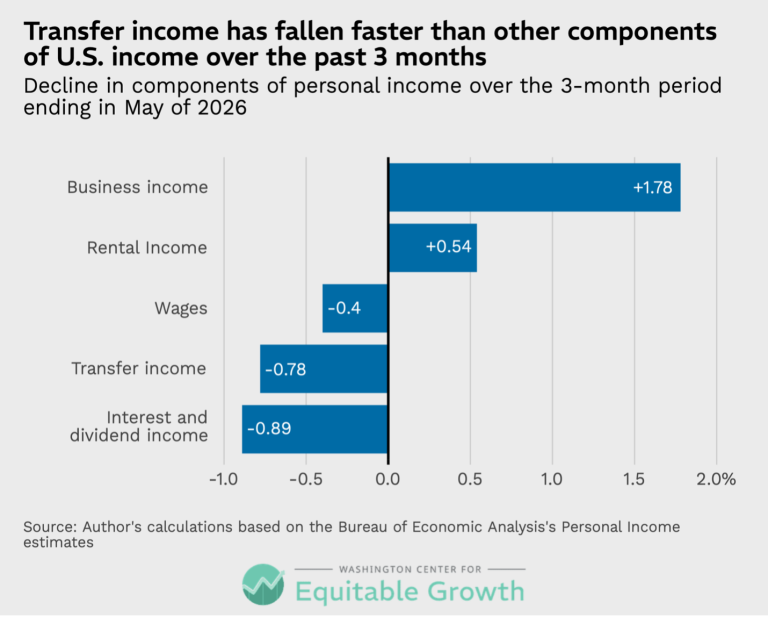
Transfer income has fallen faster than other components of U.S. income over the past 3 months (opens in a new tab)
Visualizations Jun 25, 2026
 View Chart
(opens in a new tab)
View Chart
(opens in a new tab)
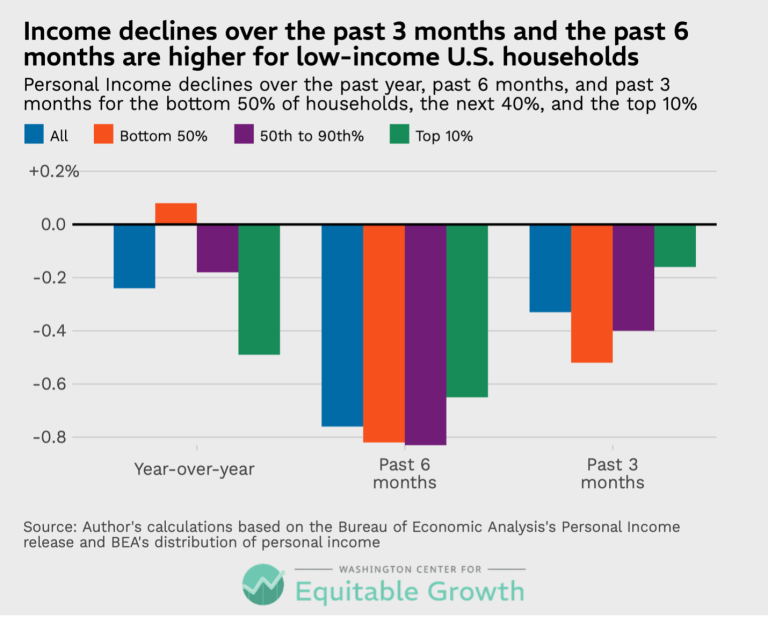
Income declines over the past 3 months and the past 6 months are higher for low-income U.S. households (opens in a new tab)
Visualizations Jun 25, 2026
 View Chart
(opens in a new tab)
View Chart
(opens in a new tab)
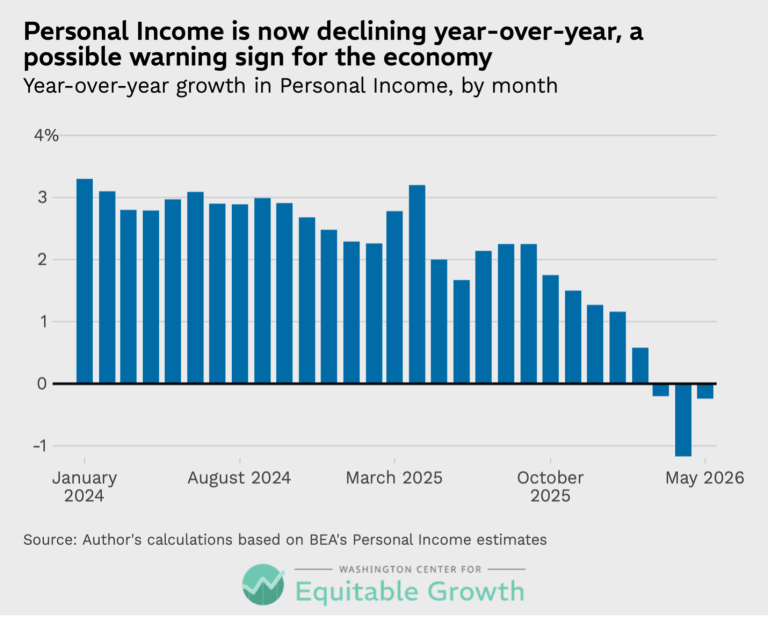
Personal Income is now declining year-over-year, a possible warning sign for the economy (opens in a new tab)
Visualizations Jun 25, 2026
 View Chart
(opens in a new tab)
View Chart
(opens in a new tab)
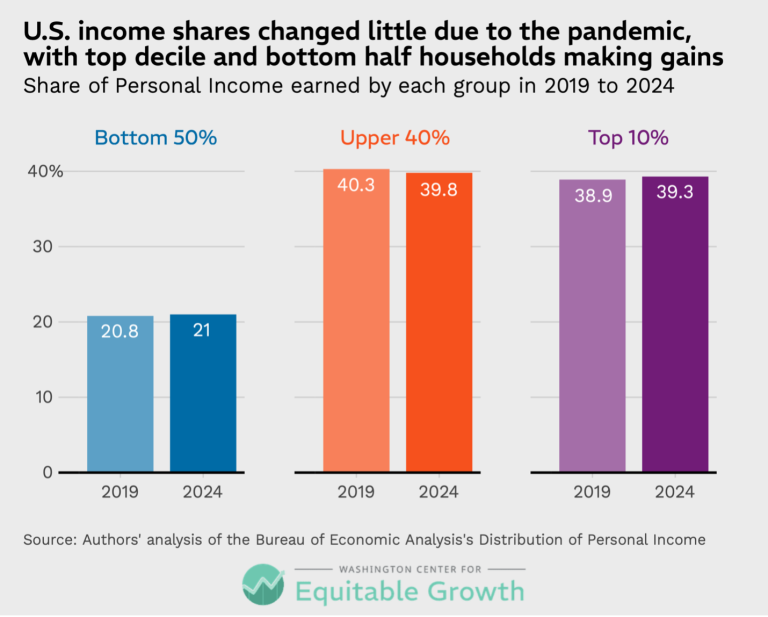
U.S. income shares changed little due to the pandemic, with top decile and bottom half households making gains (opens in a new tab)
Visualizations Jun 24, 2026
 View Chart
(opens in a new tab)
View Chart
(opens in a new tab)
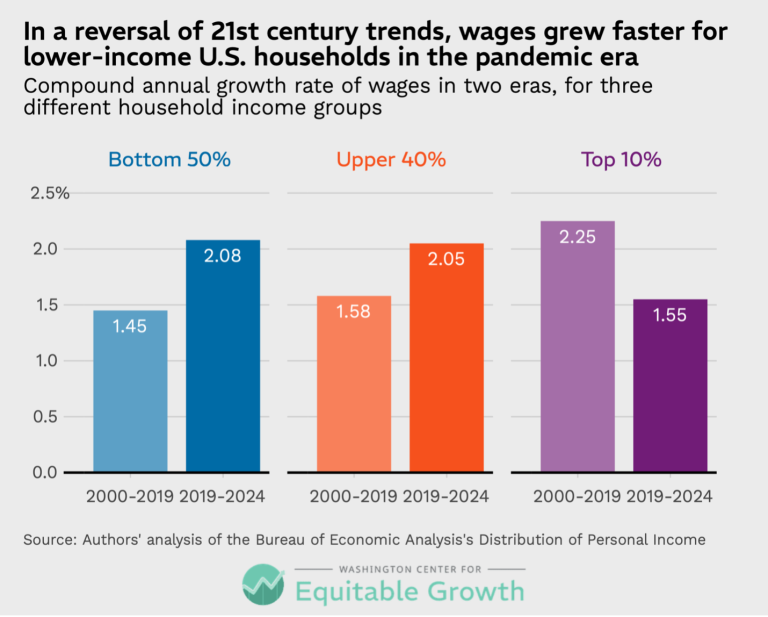
In a reversal of 21st century trends, wages grew faster for lower-income U.S. households in the pandemic era (opens in a new tab)
Visualizations Jun 24, 2026
 View Chart
(opens in a new tab)
View Chart
(opens in a new tab)
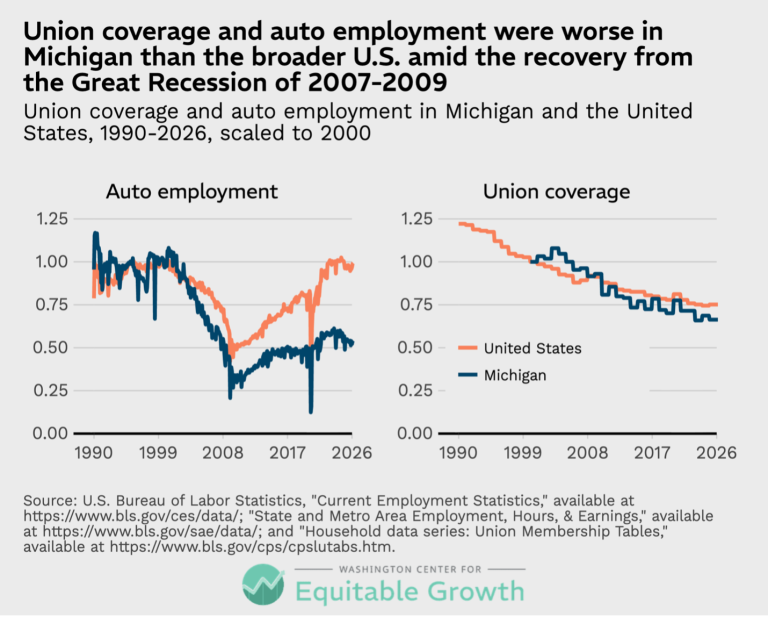
Union coverage and auto employment were worse in Michigan than the broader U.S. amid the recovery from the Great Recession of 2007-2009 (opens in a new tab)
Visualizations Jun 3, 2026
 View Chart
(opens in a new tab)
View Chart
(opens in a new tab)
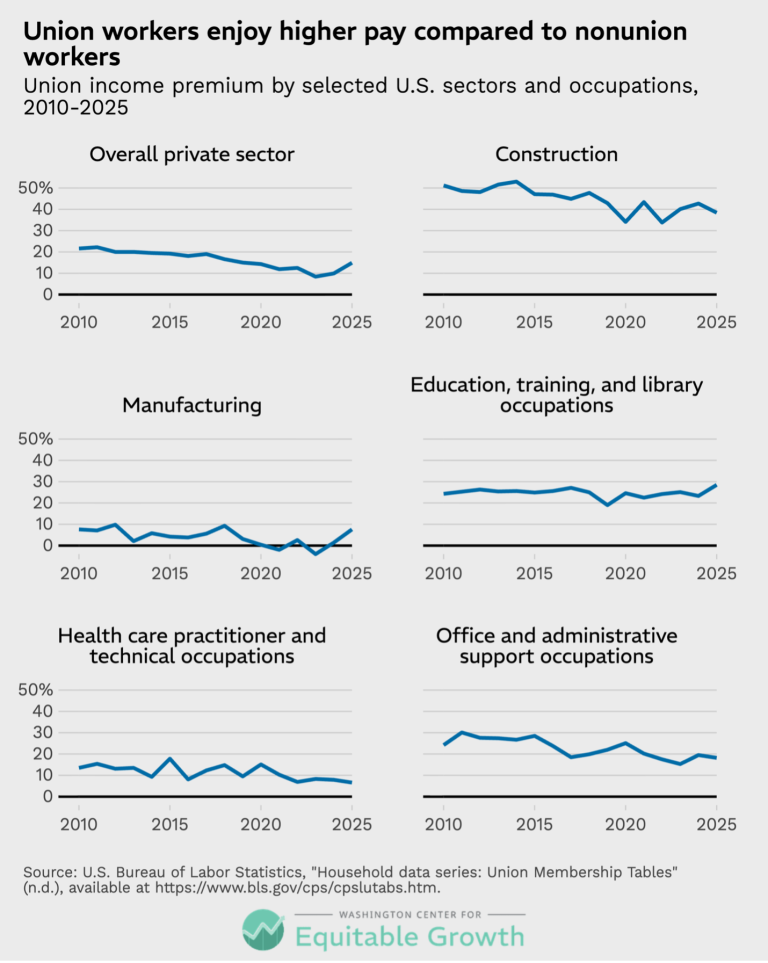
Union workers enjoy higher pay compared to nonunion workers (opens in a new tab)
Visualizations Jun 3, 2026
 View Chart
(opens in a new tab)
View Chart
(opens in a new tab)
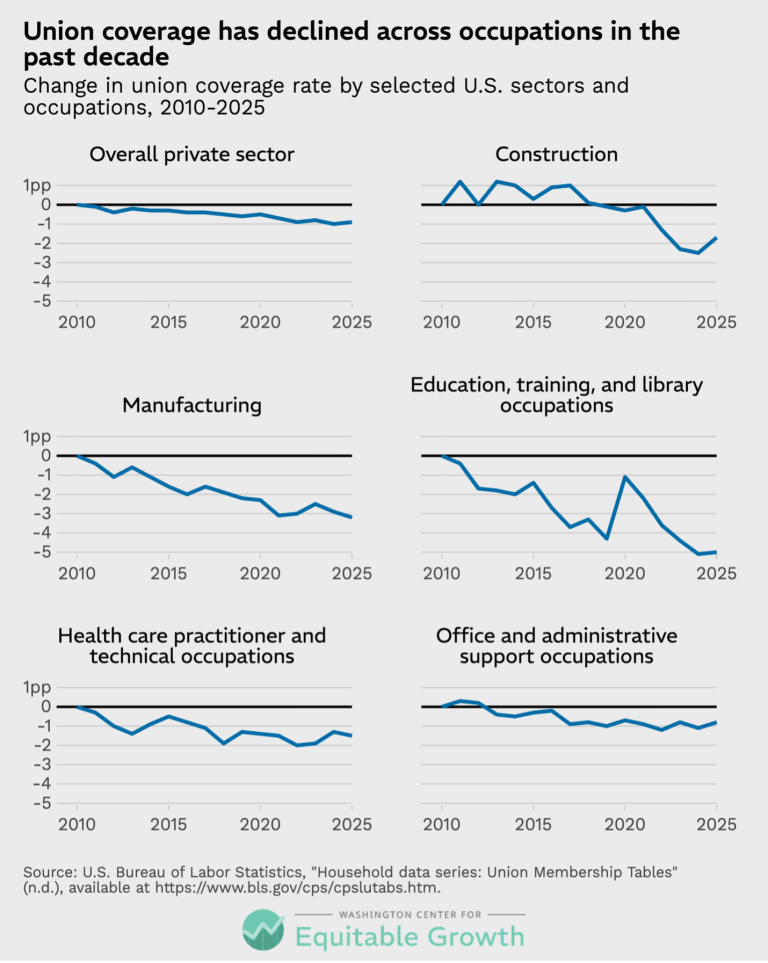
Union coverage has declined across occupations in the past decade (opens in a new tab)
Visualizations Jun 3, 2026
 View Chart
(opens in a new tab)
View Chart
(opens in a new tab)
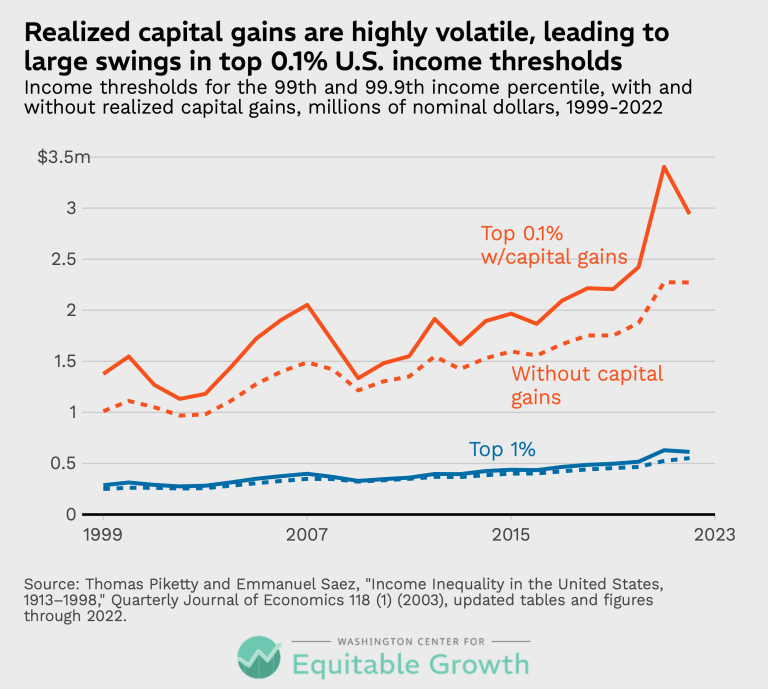
Realized capital gains are highly volatile, leading to large swings in the top 0.1% U.S. income thresholds (opens in a new tab)
Visualizations May 26, 2026
 View Chart
(opens in a new tab)
View Chart
(opens in a new tab)
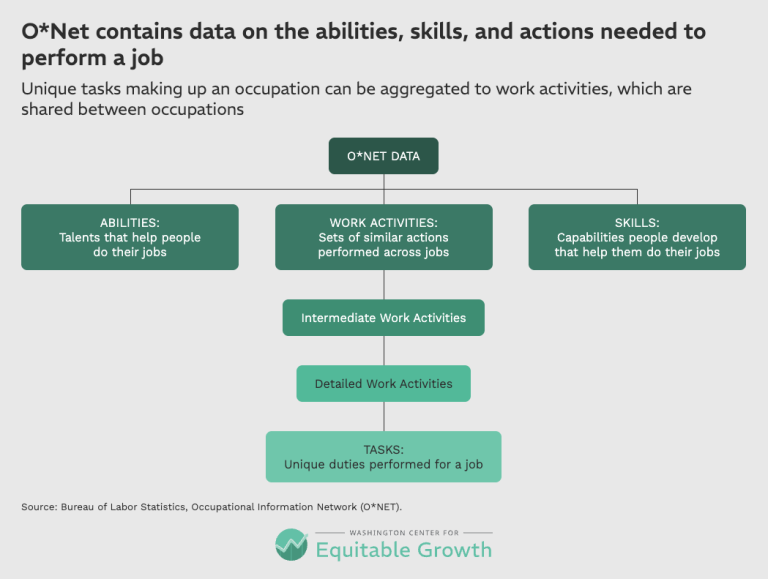
O*NET contains data on the abilities, skills, and actions needed to perform a job – revised (opens in a new tab)
Visualizations May 20, 2026
 View Chart
(opens in a new tab)
View Chart
(opens in a new tab)
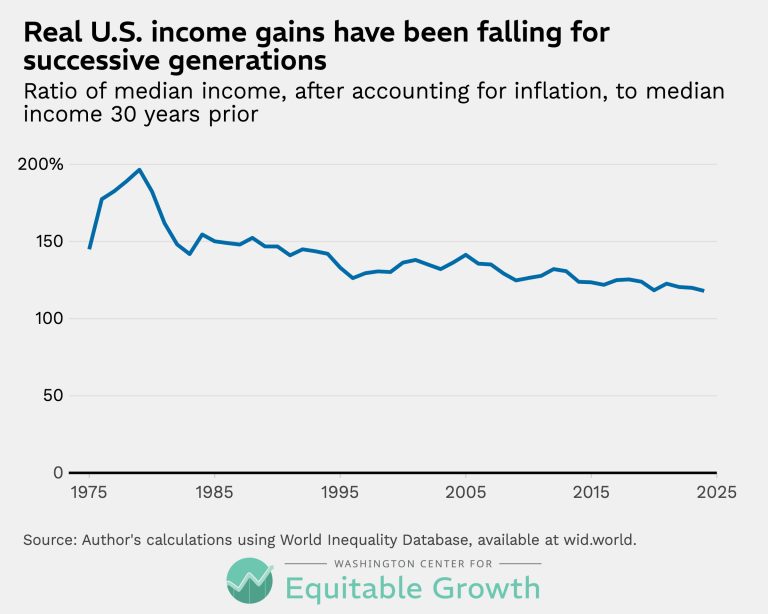
Real U.S. income gains have been falling for successive generations (opens in a new tab)
Visualizations May 13, 2026
 View Chart
(opens in a new tab)
View Chart
(opens in a new tab)
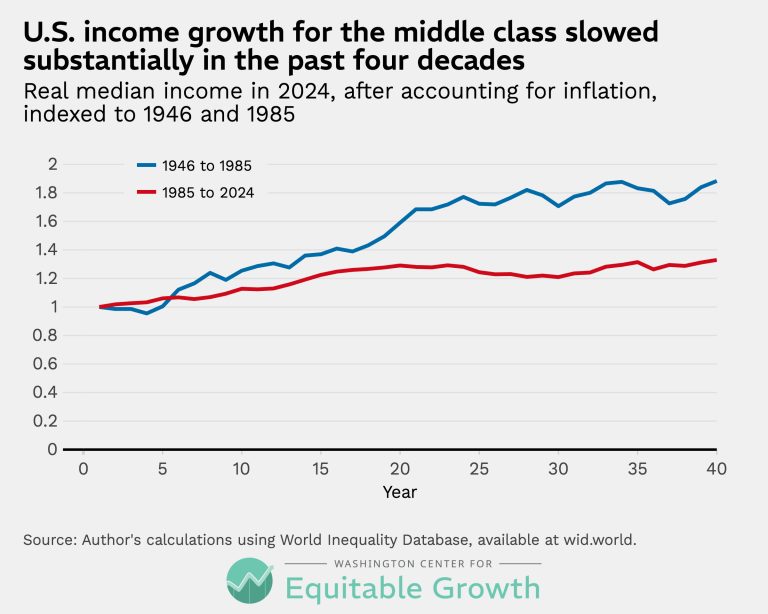
U.S. income growth for the middle class slowed substantially in the past four decades (opens in a new tab)
Visualizations May 13, 2026
 View Chart
(opens in a new tab)
View Chart
(opens in a new tab)
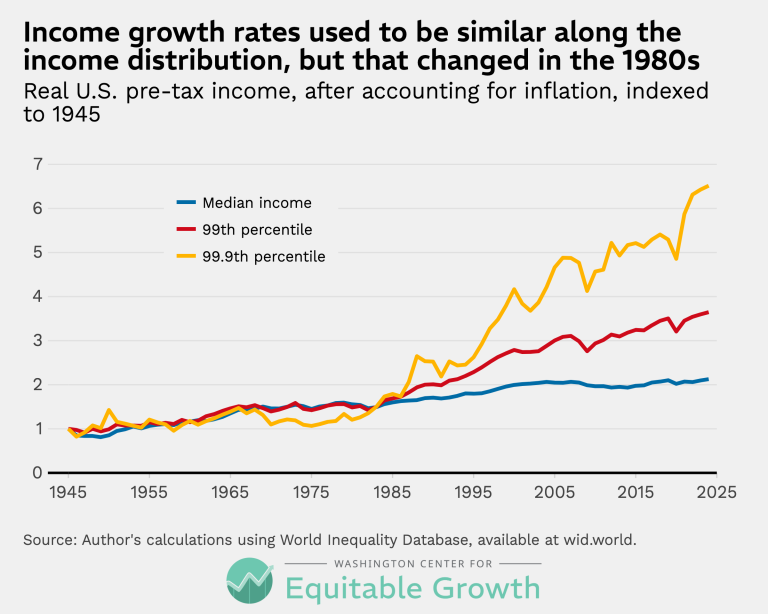
Income growth rates used to be similar along the income distribution, but that changed in the 1980s (opens in a new tab)
Visualizations May 13, 2026
 View Chart
(opens in a new tab)
View Chart
(opens in a new tab)
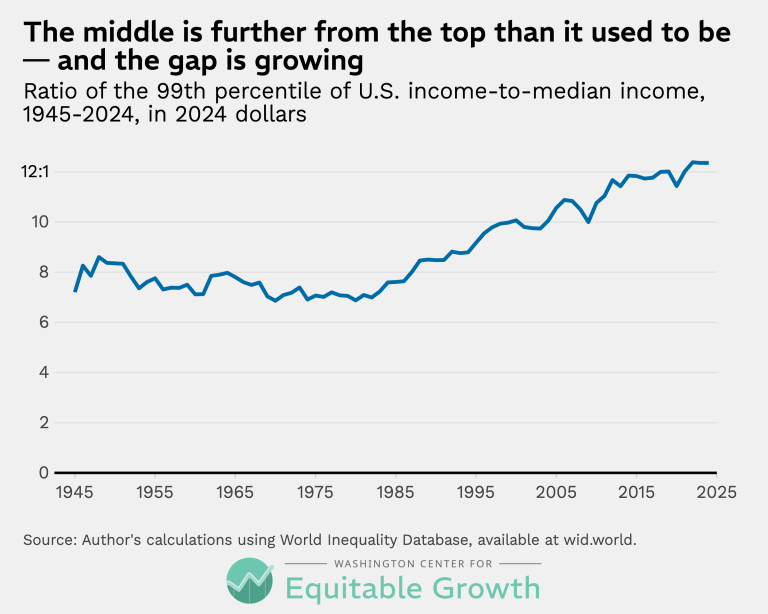
The middle is further from the top than it used to be—and the gap is growing (opens in a new tab)
Visualizations May 13, 2026
 View Chart
(opens in a new tab)
View Chart
(opens in a new tab)
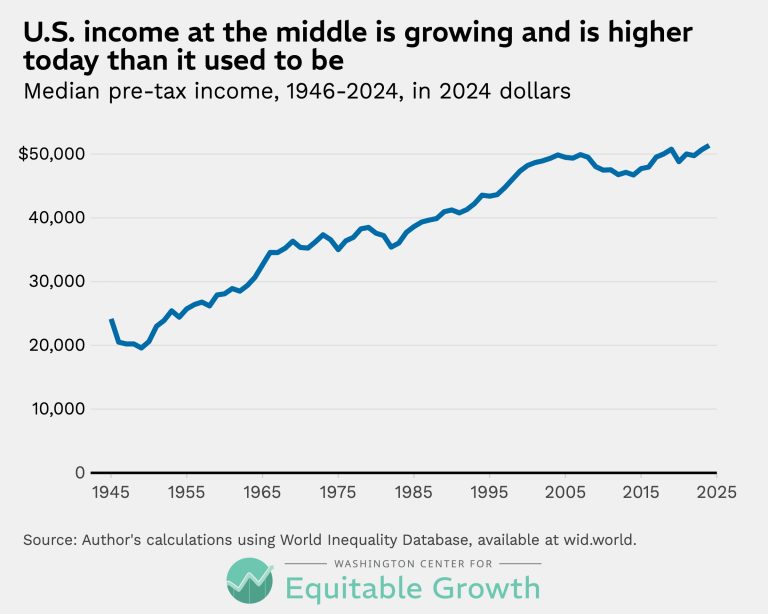
U.S. income at the middle is growing and is higher today than it used to be (opens in a new tab)
Visualizations May 13, 2026
 View Chart
(opens in a new tab)
View Chart
(opens in a new tab)
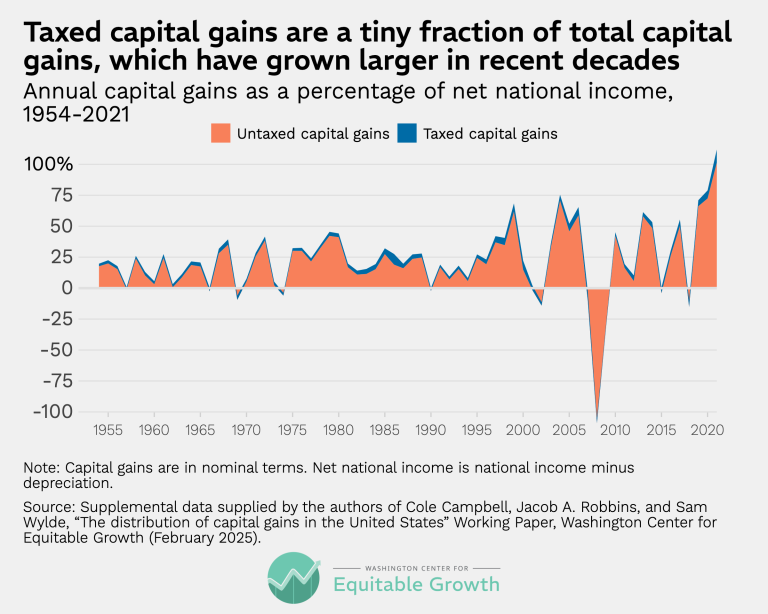
Taxed capital gains are a tiny fraction of total capital gains, which have grown larger in recent decades (opens in a new tab)
Visualizations May 6, 2026
 View Chart
(opens in a new tab)
View Chart
(opens in a new tab)
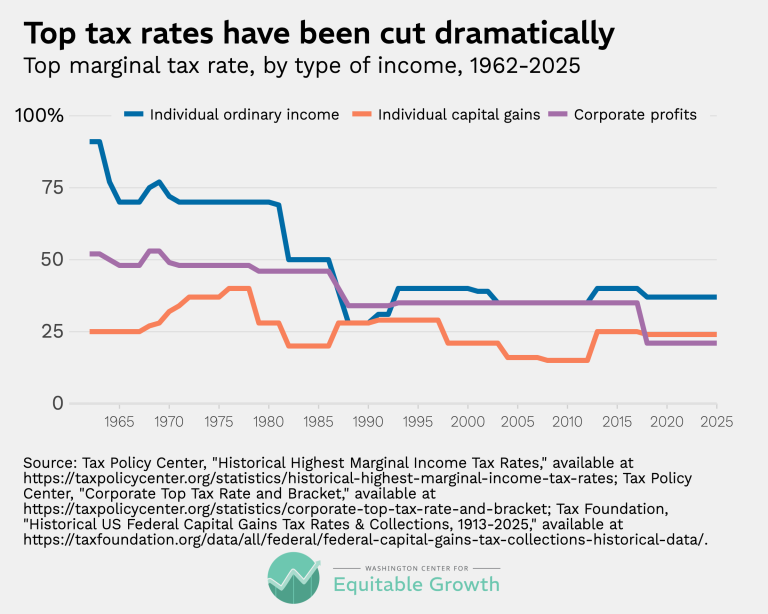
Top tax rates have been cut dramatically (opens in a new tab)
Visualizations May 6, 2026
 View Chart
(opens in a new tab)
View Chart
(opens in a new tab)
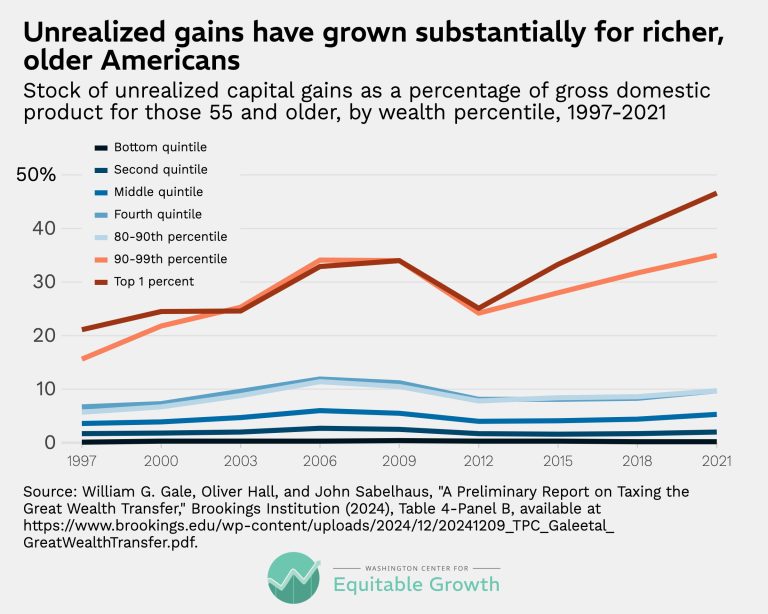
Unrealized gains have grown substantially for richer, older Americans (opens in a new tab)
Visualizations May 6, 2026
 View Chart
(opens in a new tab)
View Chart
(opens in a new tab)
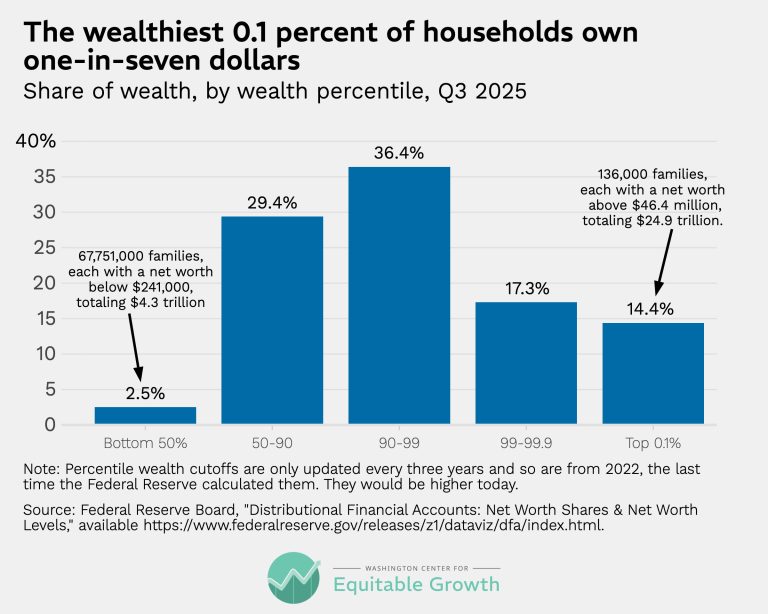
The wealthiest 0.1 percent of households own one-in-seven dollars (opens in a new tab)
Visualizations May 6, 2026
 View Chart
(opens in a new tab)
View Chart
(opens in a new tab)
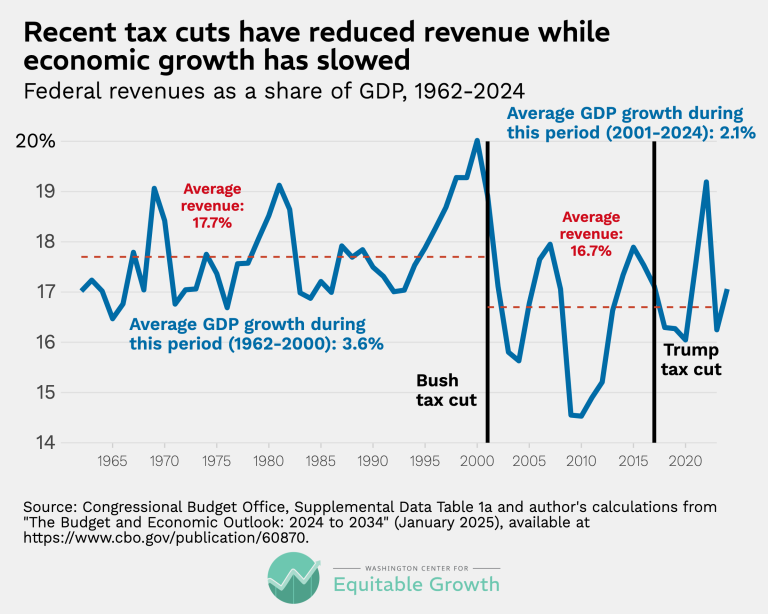
Recent tax cuts have reduced revenue while economic growth has slowed (opens in a new tab)
Visualizations May 6, 2026
 View Chart
(opens in a new tab)
View Chart
(opens in a new tab)
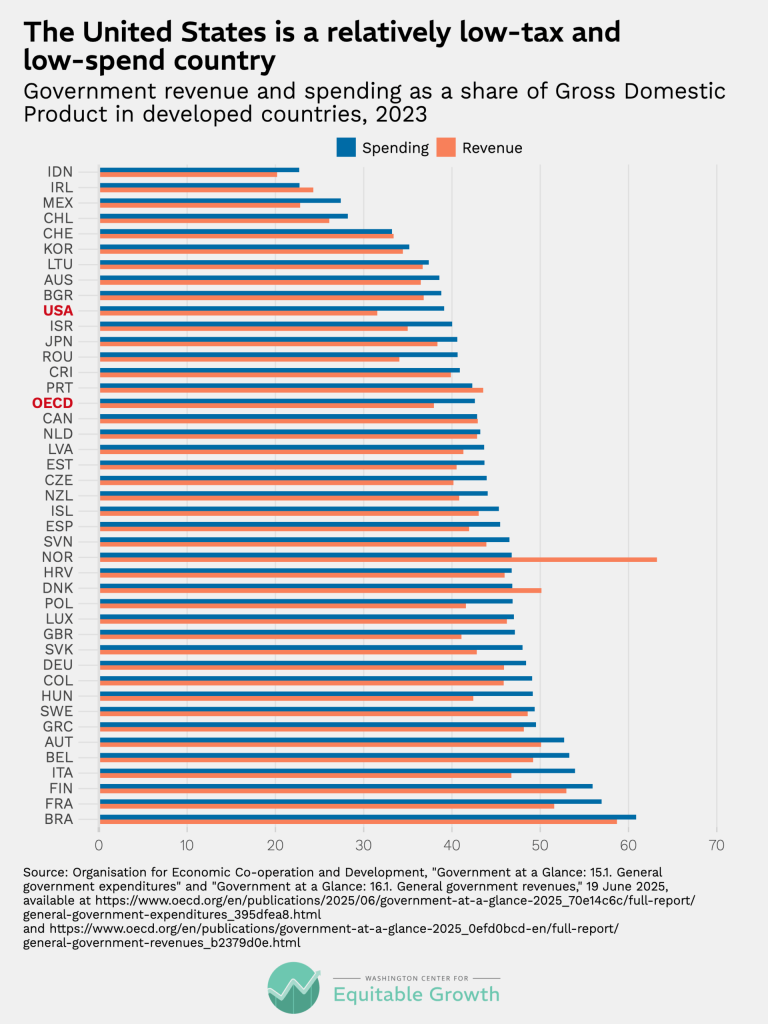
The United States is a relatively low-tax and low-spend country (opens in a new tab)
Visualizations May 6, 2026
 View Chart
(opens in a new tab)
View Chart
(opens in a new tab)
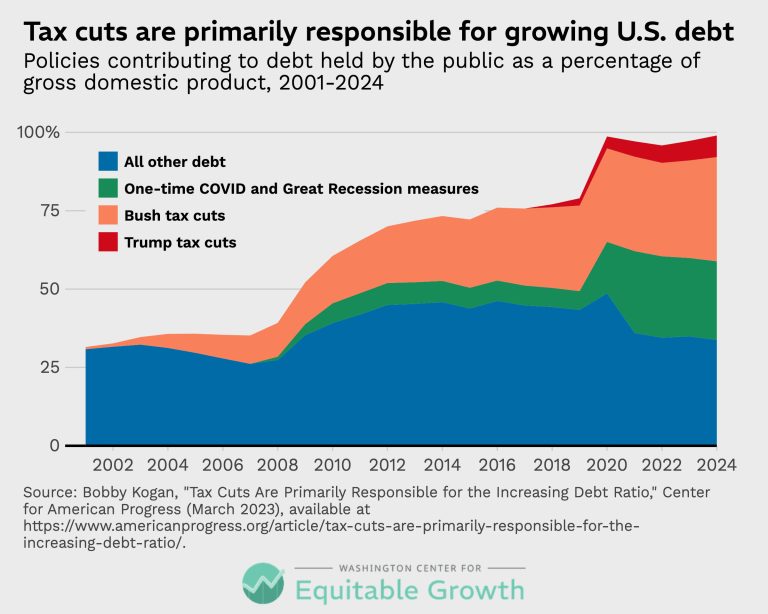
Tax cuts are primarily responsible for the growing U.S. debt (opens in a new tab)
Visualizations May 6, 2026
 View Chart
(opens in a new tab)
View Chart
(opens in a new tab)
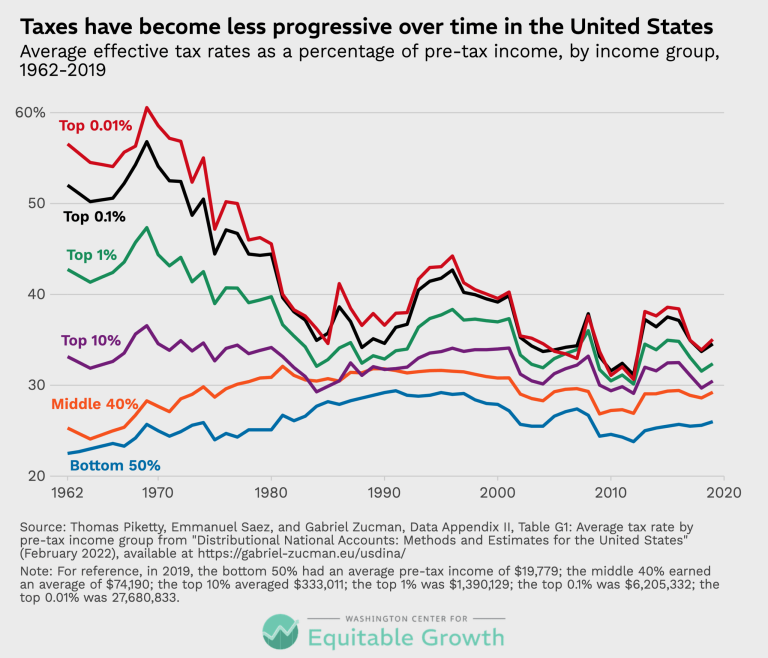
Taxes have become less progressive over time in the United States (opens in a new tab)
Visualizations May 6, 2026
 View Chart
(opens in a new tab)
View Chart
(opens in a new tab)
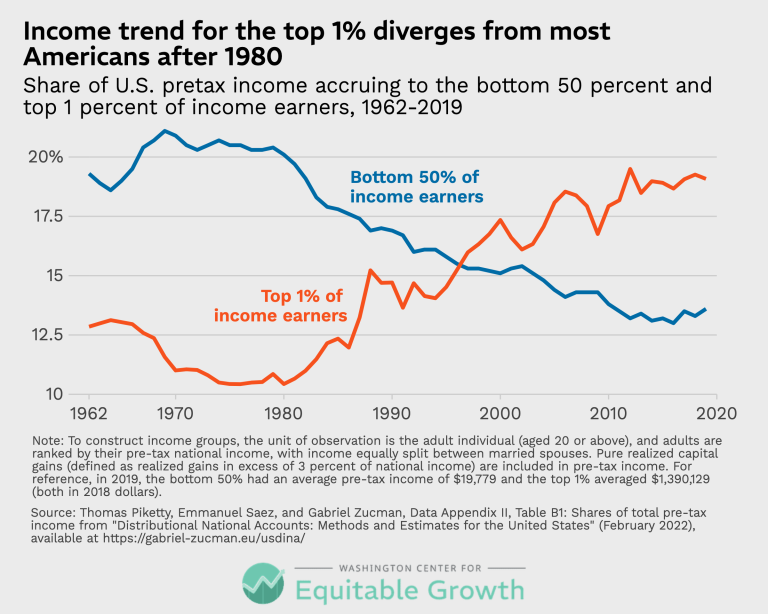
Income trend for the top 1% diverges from most Americans after 1980 (opens in a new tab)
Visualizations May 6, 2026
 View Chart
(opens in a new tab)
View Chart
(opens in a new tab)
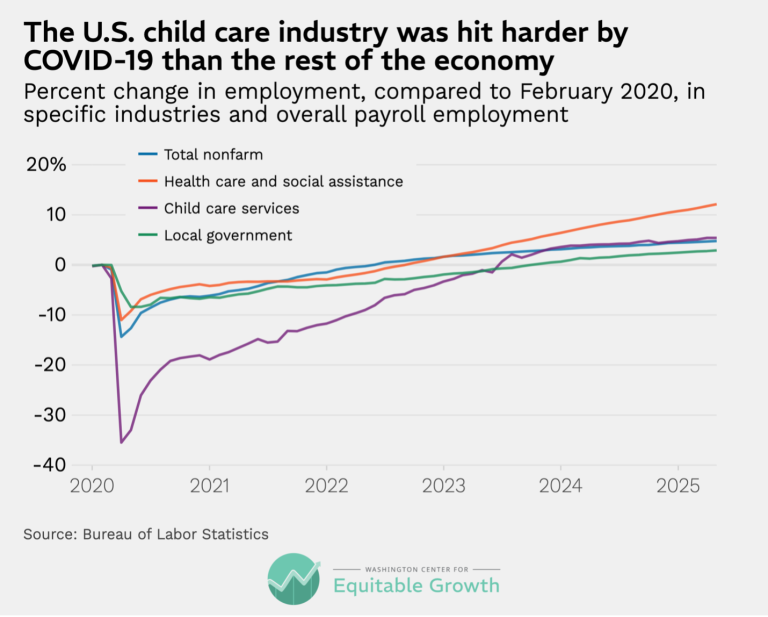
The U.S. child care industry was hit harder by COVID-19 than the rest of the economy (opens in a new tab)
Visualizations Apr 15, 2026
 View Chart
(opens in a new tab)
View Chart
(opens in a new tab)
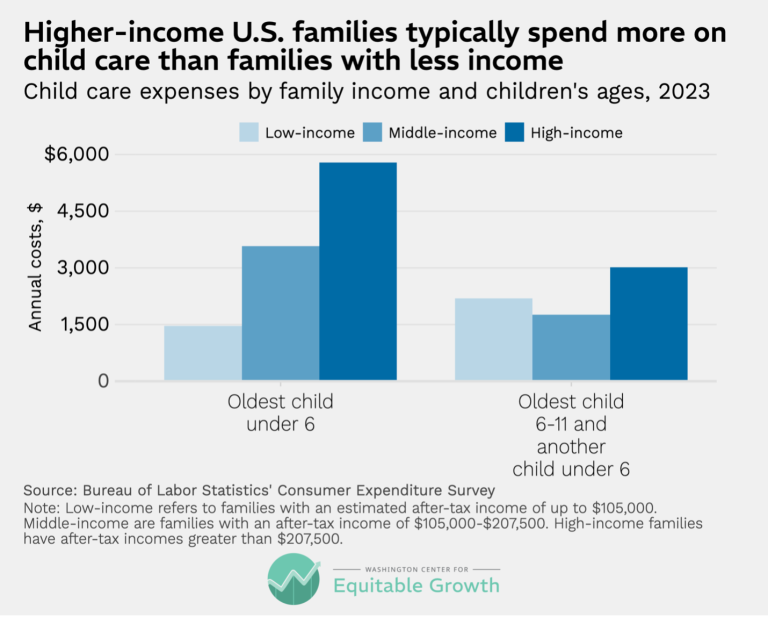
Higher-income U.S. families typically spend more on child care than families with less income (opens in a new tab)
Visualizations Apr 15, 2026
 View Chart
(opens in a new tab)
View Chart
(opens in a new tab)
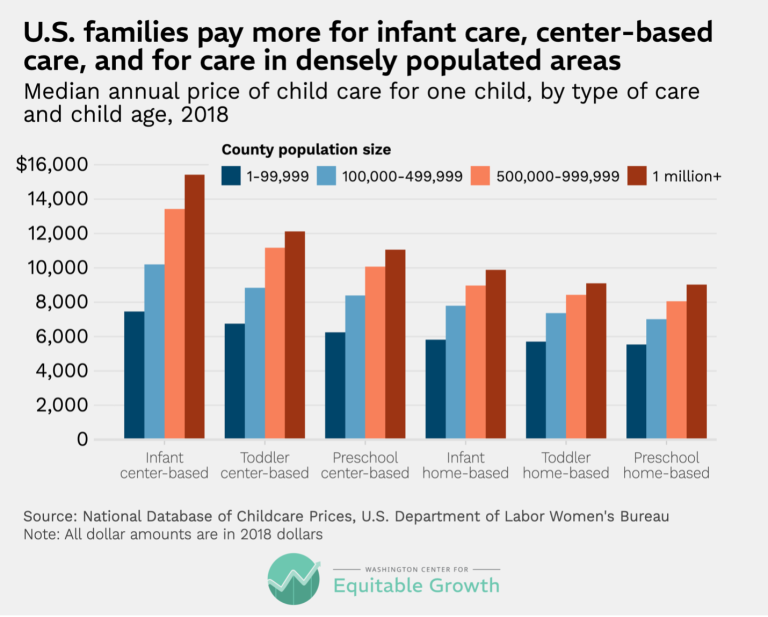
U.S. families pay more for infant care, center-based care, and for care in densely populated areas (opens in a new tab)
Visualizations Apr 15, 2026
 View Chart
(opens in a new tab)
View Chart
(opens in a new tab)
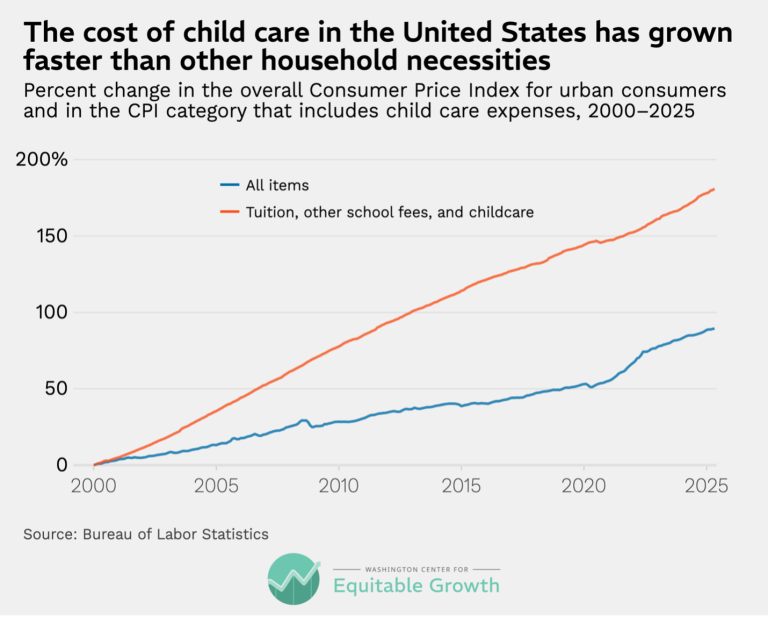
The cost of child care in the United States has grown faster than other household necessities (opens in a new tab)
Visualizations Apr 15, 2026
 View Chart
(opens in a new tab)
View Chart
(opens in a new tab)
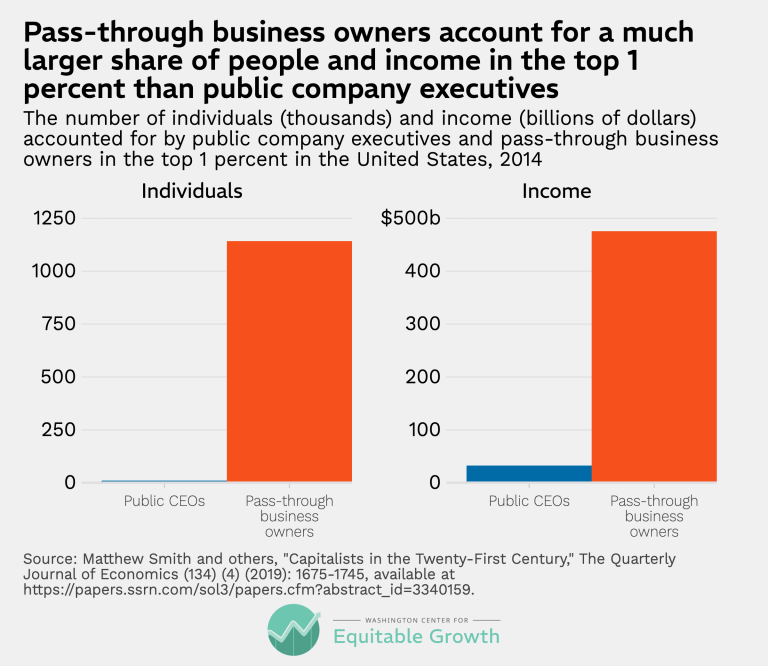
Pass-through business owners account for a much larger share of people and income in the top 1 percent than public company executives (opens in a new tab)
Visualizations Apr 14, 2026
 View Chart
(opens in a new tab)
View Chart
(opens in a new tab)
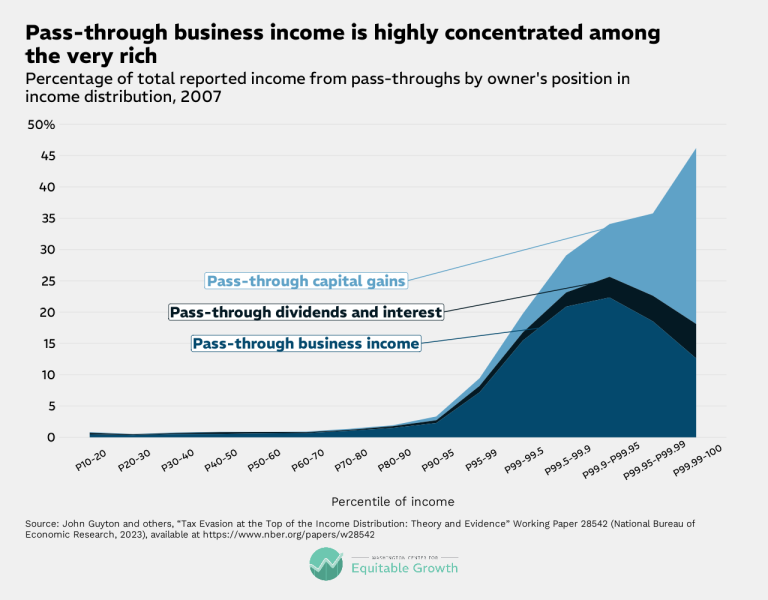
Pass-through business income is highly concentrated among the very rich (opens in a new tab)
Visualizations Apr 14, 2026
 View Chart
(opens in a new tab)
View Chart
(opens in a new tab)
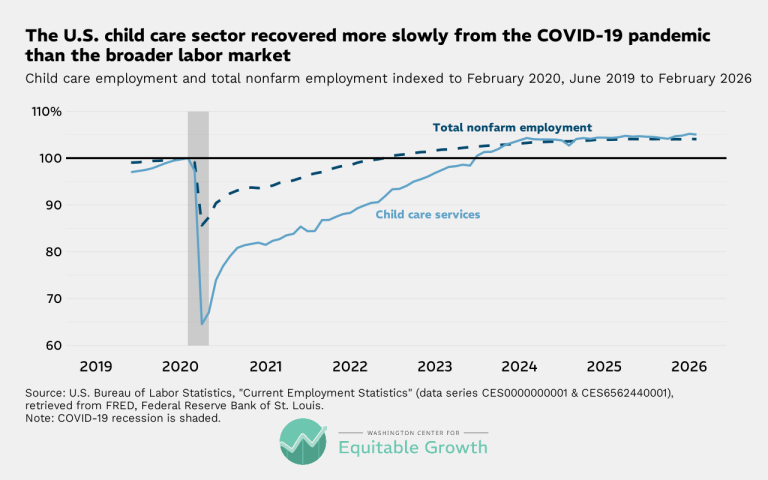
The U.S. child care sector recovered more slowly from the COVID-19 pandemic than the broader labor market (opens in a new tab)
Visualizations Apr 8, 2026
 View Chart
(opens in a new tab)
View Chart
(opens in a new tab)
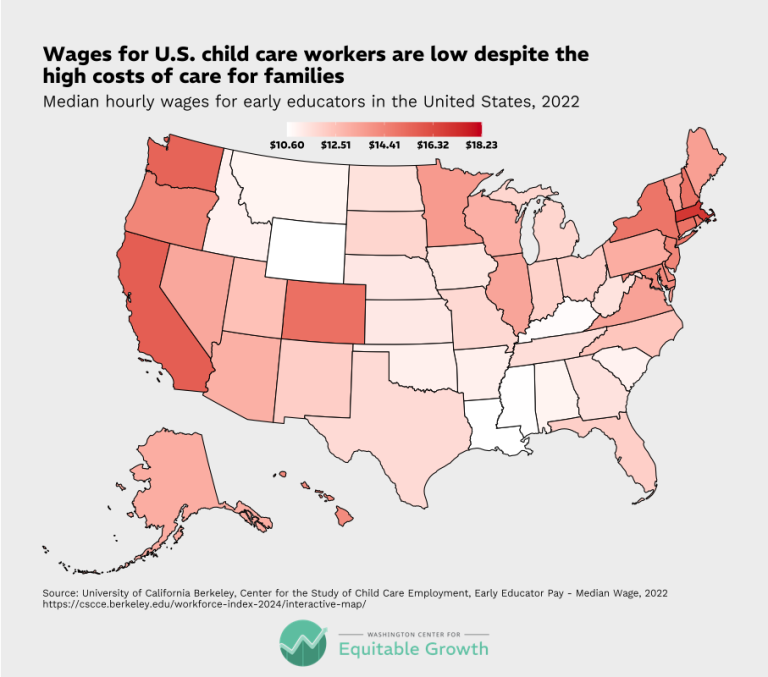
Wages for U.S. child care workers are low despite the high costs of care for families (opens in a new tab)
Visualizations Apr 8, 2026
 View Chart
(opens in a new tab)
View Chart
(opens in a new tab)
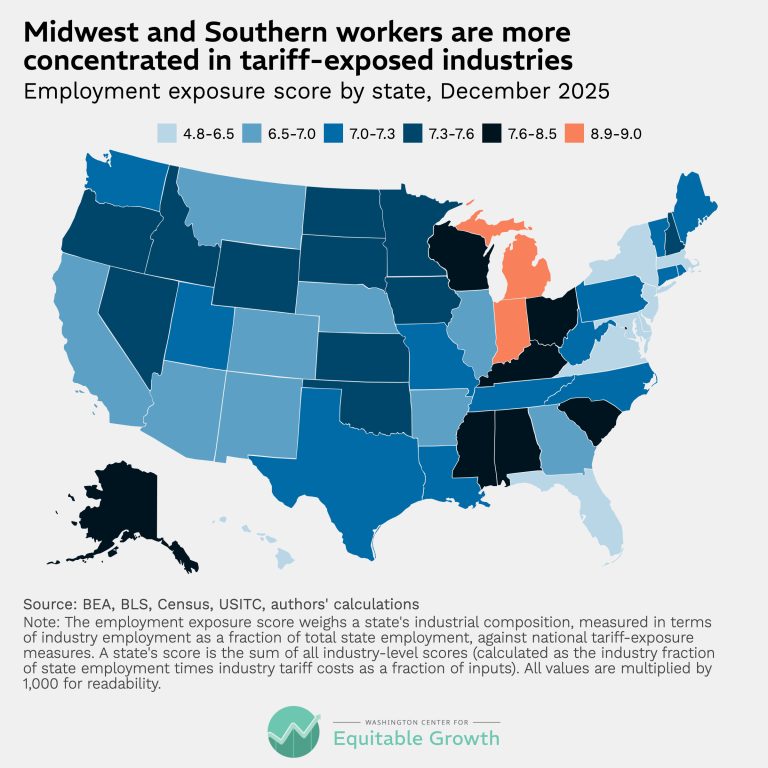
Midwest and Southern workers are more concentrated in tariff-exposed industries (opens in a new tab)
Visualizations Mar 17, 2026
 View Chart
(opens in a new tab)
View Chart
(opens in a new tab)
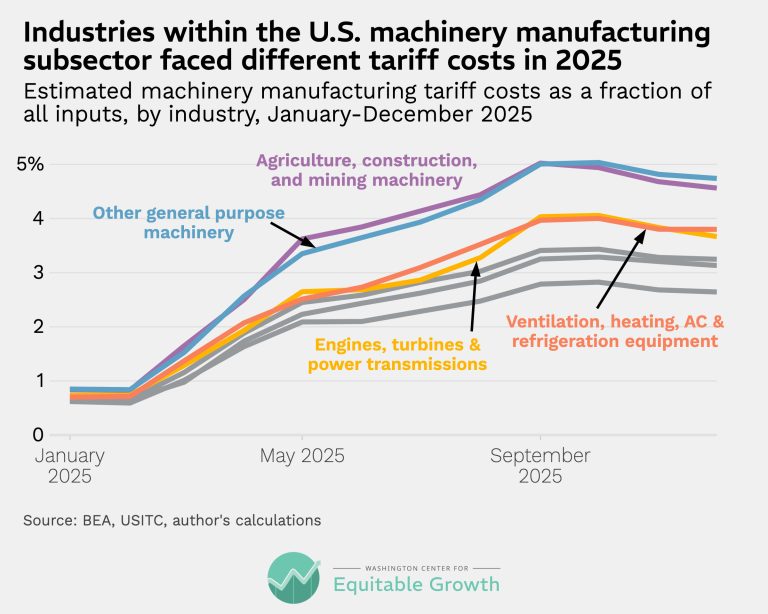
Industries within the U.S. machinery manufacturing subsector faced different tariff costs in 2025 (opens in a new tab)
Visualizations Mar 17, 2026
 View Chart
(opens in a new tab)
View Chart
(opens in a new tab)
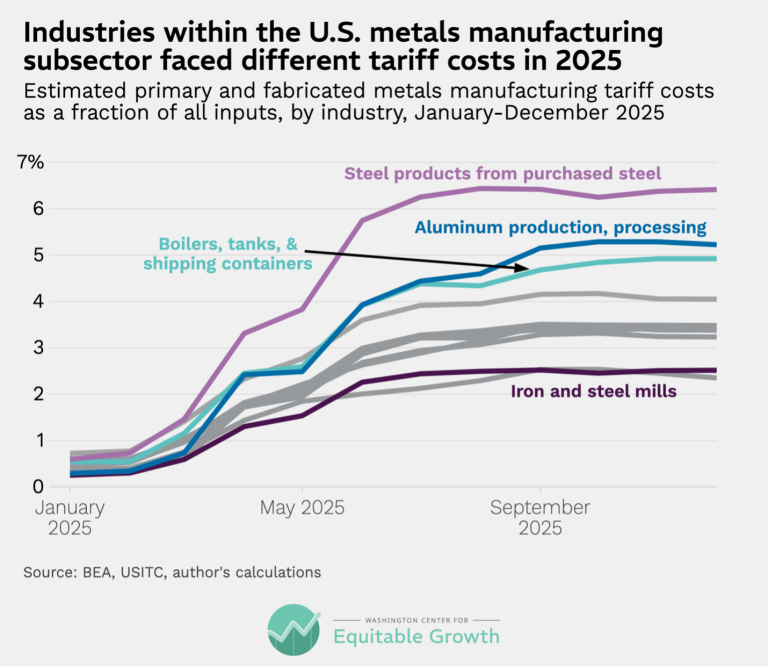
Industries within the U.S. metals manufacturing subsector faced different tariff costs in 2025 (opens in a new tab)
Visualizations Mar 17, 2026
 View Chart
(opens in a new tab)
View Chart
(opens in a new tab)
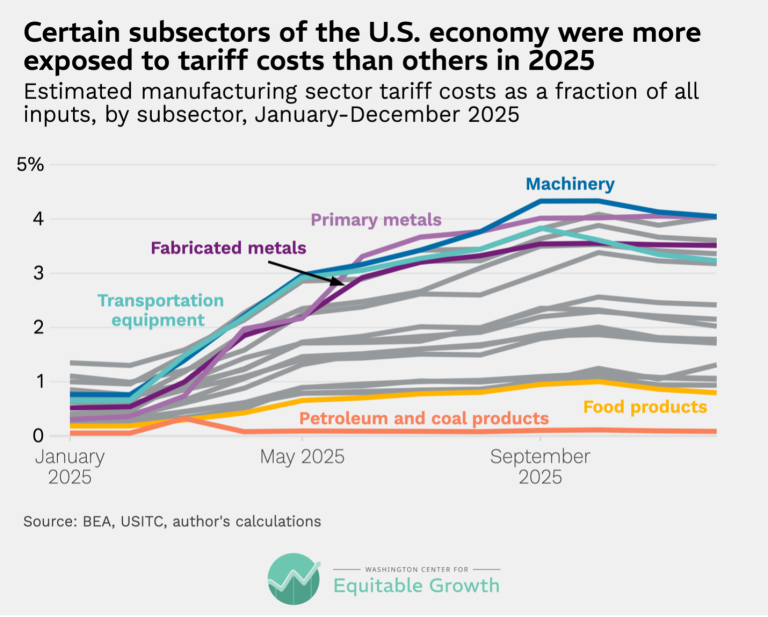
Certain subsectors of the U.S. economy were more exposed to tariff costs than others in 2025 (opens in a new tab)
Visualizations Mar 17, 2026
 View Chart
(opens in a new tab)
View Chart
(opens in a new tab)
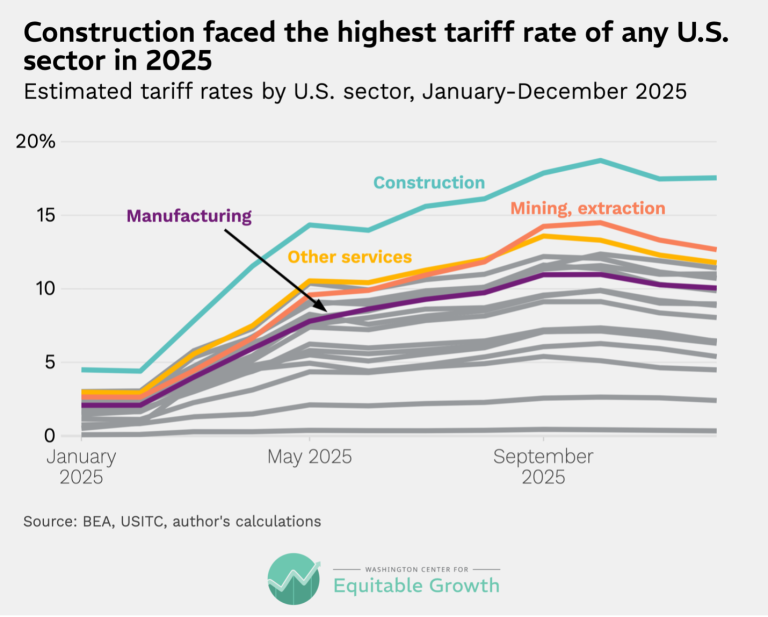
Construction faced the highest tariff rate of any U.S. sector in 2025 (opens in a new tab)
Visualizations Mar 17, 2026
 View Chart
(opens in a new tab)
View Chart
(opens in a new tab)
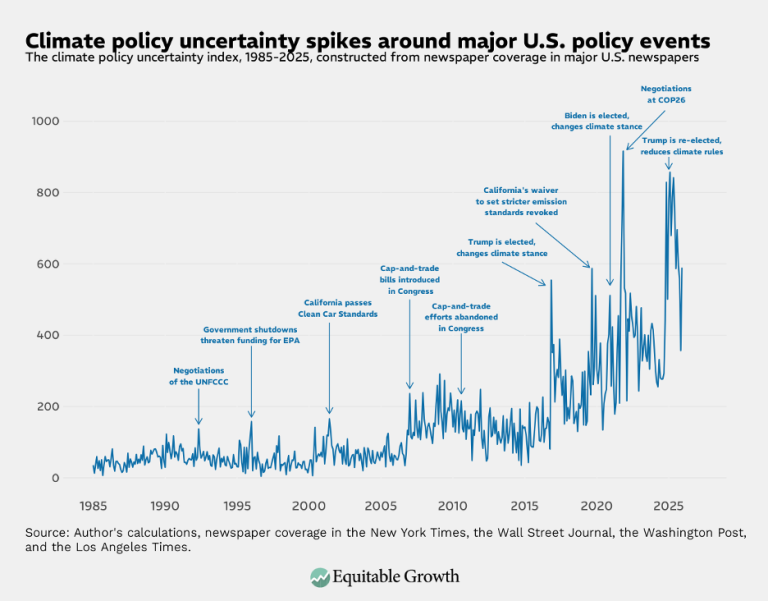
Climate policy uncertainty spikes around major U.S. policy events (opens in a new tab)
Visualizations Mar 17, 2026
 View Chart
(opens in a new tab)
View Chart
(opens in a new tab)
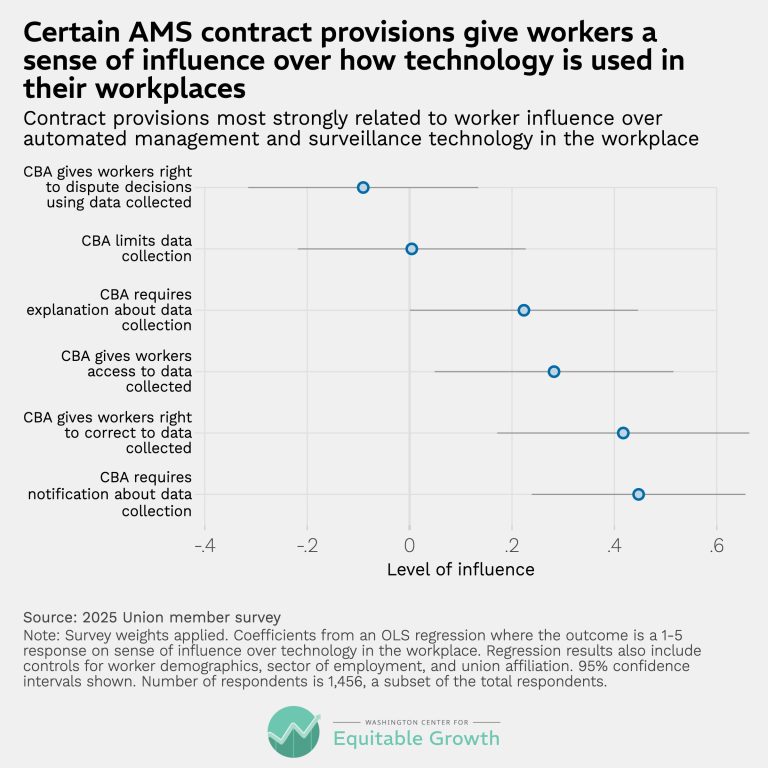
Certain AMS contract provisions give workers a sense of influence over how technology is used in their workplaces (opens in a new tab)
Visualizations Mar 12, 2026
 View Chart
(opens in a new tab)
View Chart
(opens in a new tab)
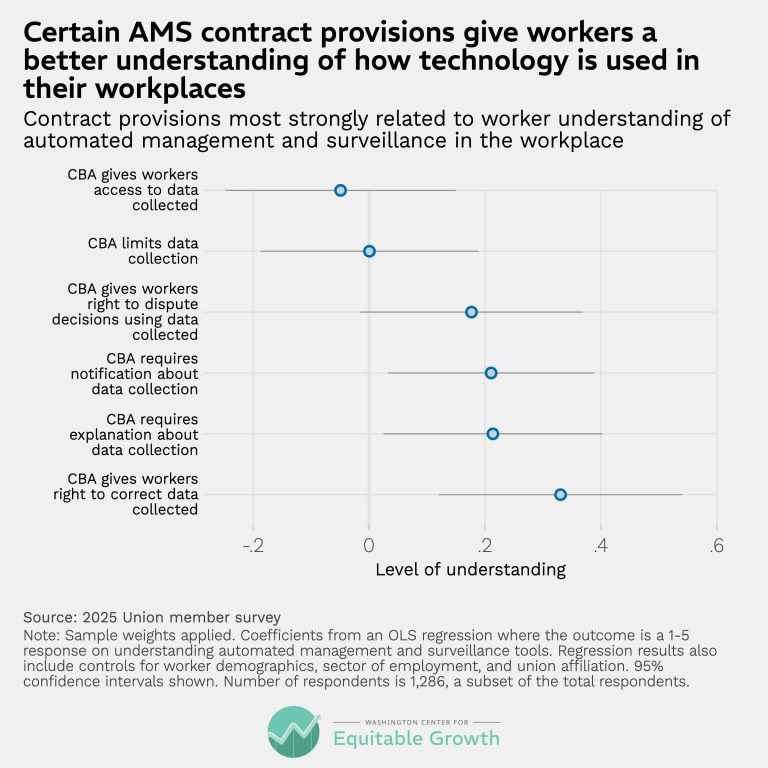
Certain AMS contract provisions give workers a better understanding of how technology is used in their workplaces (opens in a new tab)
Visualizations Mar 12, 2026
 View Chart
(opens in a new tab)
View Chart
(opens in a new tab)
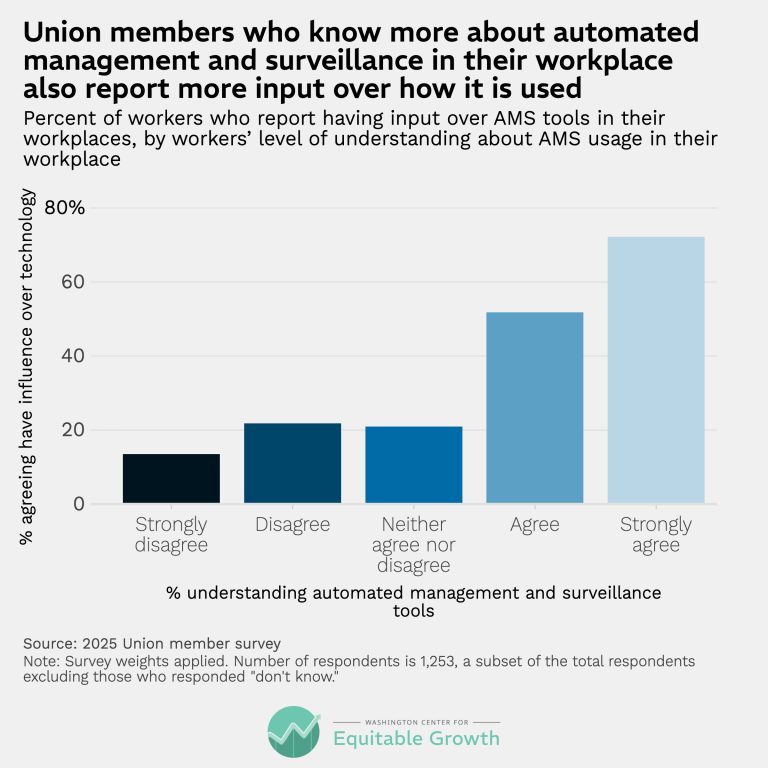
Union members who know more about automated management and surveillance in their workplace also report more input over how it is used (opens in a new tab)
Visualizations Mar 12, 2026
 View Chart
(opens in a new tab)
View Chart
(opens in a new tab)
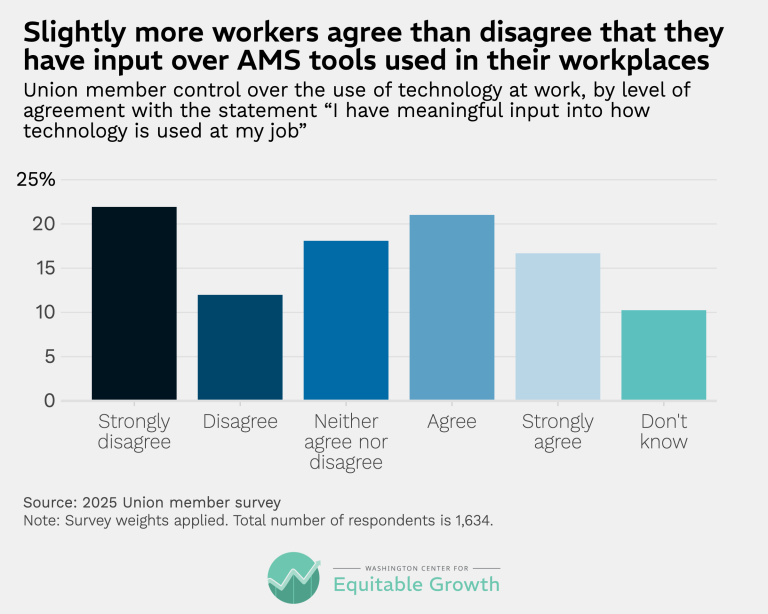
Slightly more workers agree than disagree that they have input over AMS tools used in their workplaces (opens in a new tab)
Visualizations Mar 12, 2026
 View Chart
(opens in a new tab)
View Chart
(opens in a new tab)
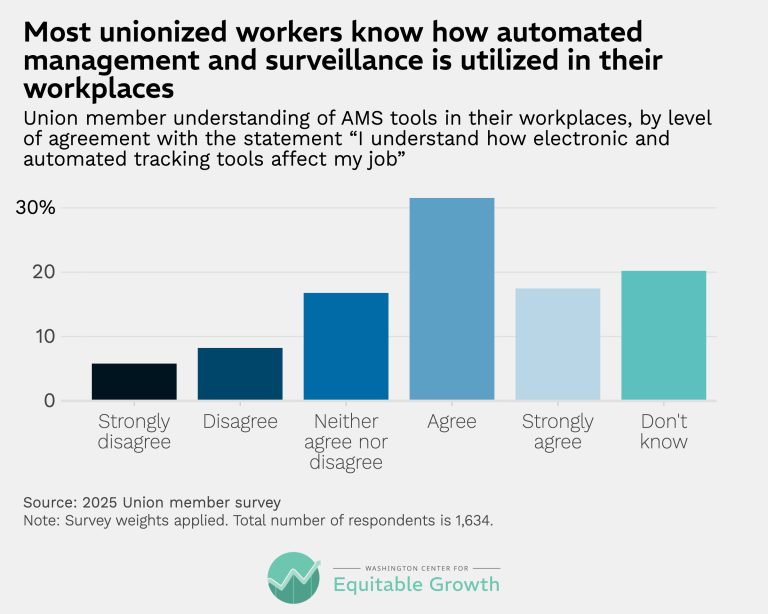
Most unionized workers know how automated management and surveillance are utilized in their workplaces (opens in a new tab)
Visualizations Mar 12, 2026
 View Chart
(opens in a new tab)
View Chart
(opens in a new tab)
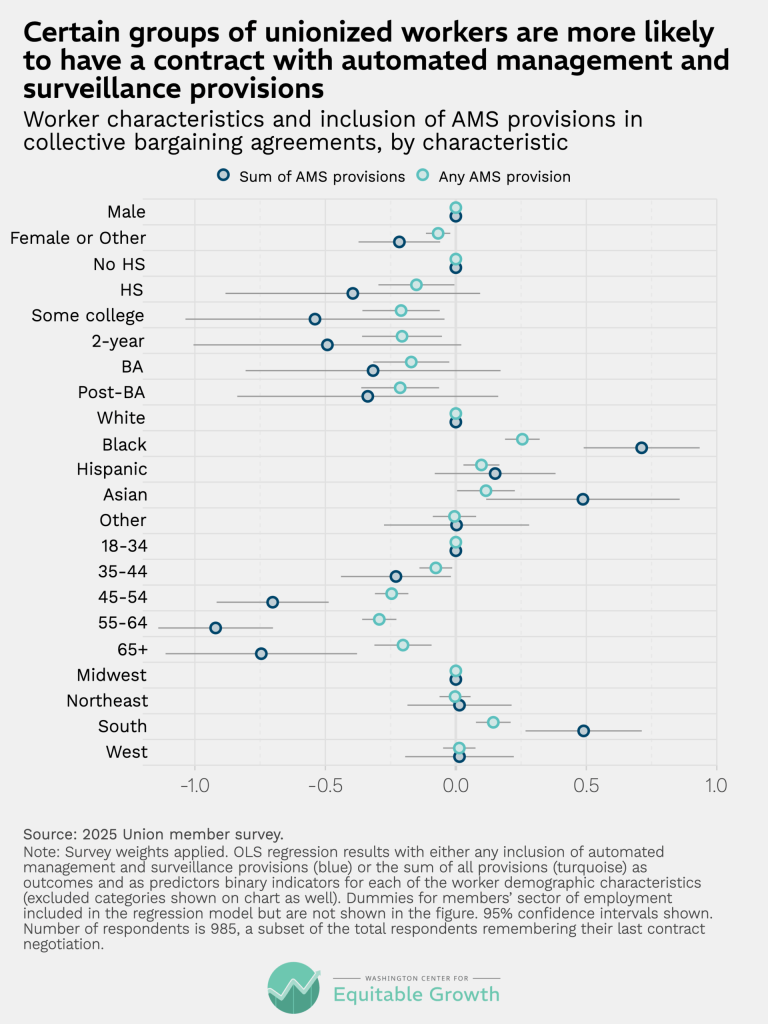
Certain groups of unionized workers are more likely to have a contract with automated management and surveillance provisions (opens in a new tab)
Visualizations Mar 12, 2026
 View Chart
(opens in a new tab)
View Chart
(opens in a new tab)
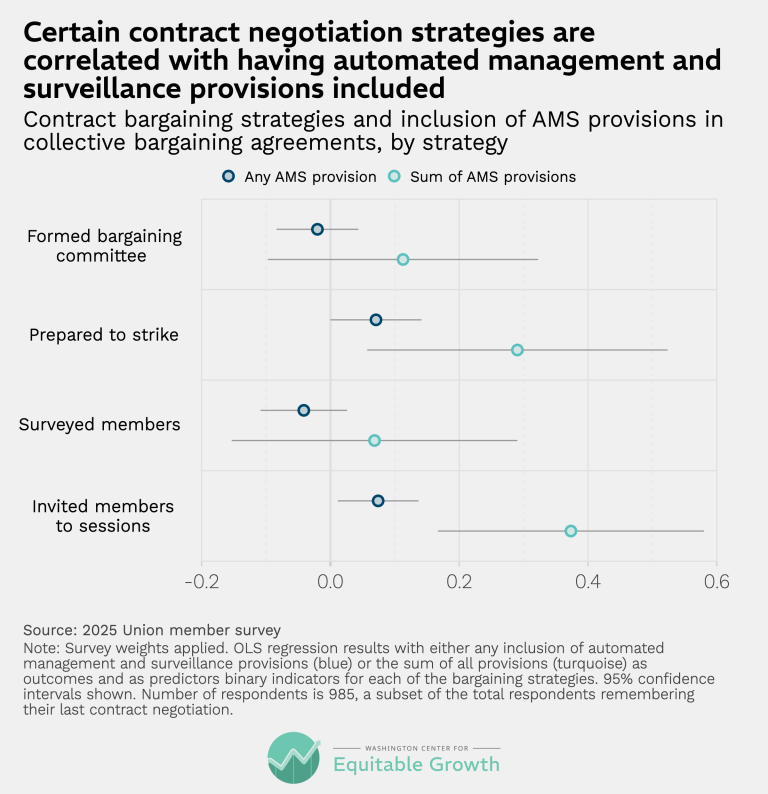
Certain contract negotiation strategies are correlated having automated management and surveillance provisions included (opens in a new tab)
Visualizations Mar 12, 2026
 View Chart
(opens in a new tab)
View Chart
(opens in a new tab)
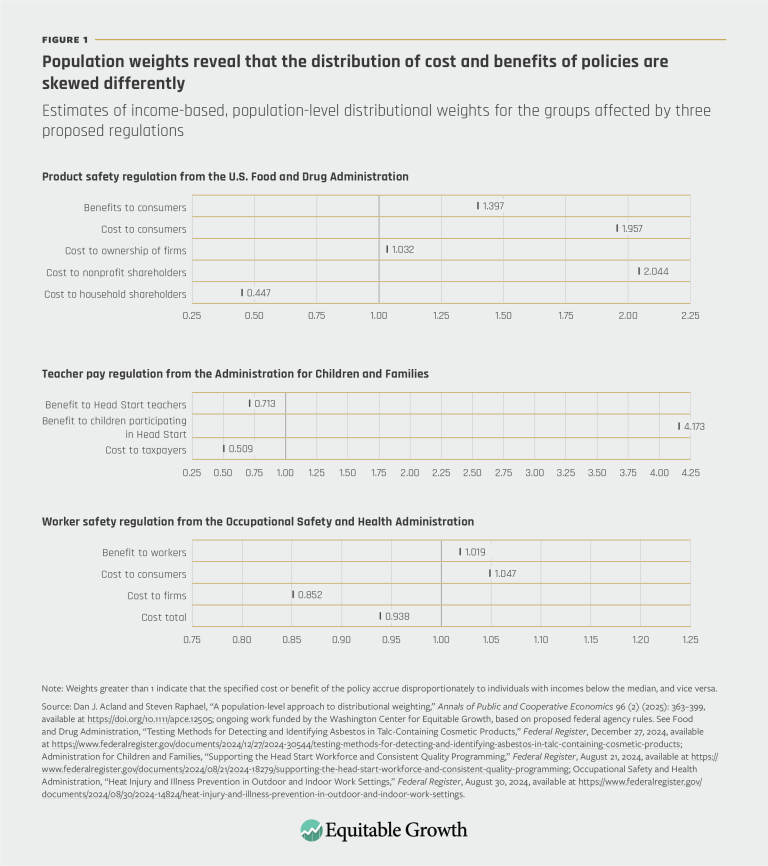
Population weights reveal that the distribution of cost and benefits of policies are skewed differently (opens in a new tab)
Visualizations Nov 13, 2025
 View Chart
(opens in a new tab)
View Chart
(opens in a new tab)
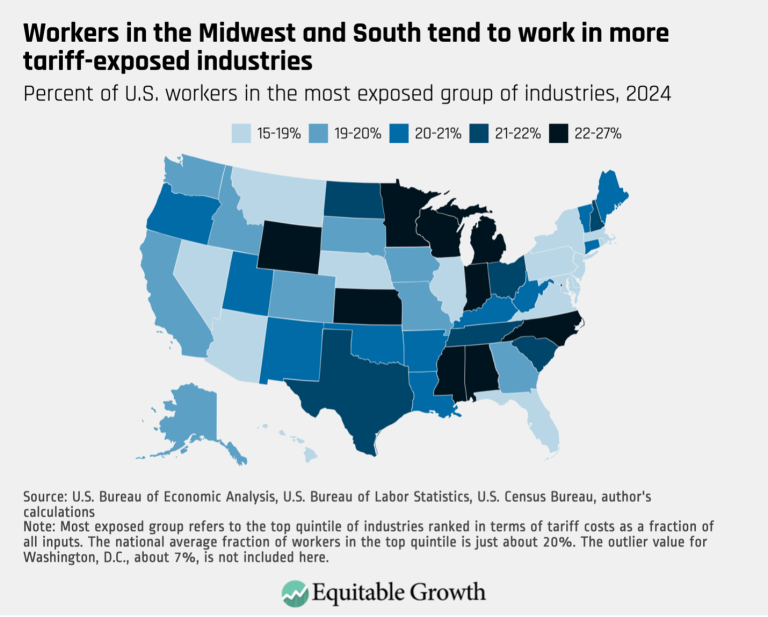
Workers in the Midwest and South tend to work in more tariff-exposed industries (opens in a new tab)
Visualizations Nov 3, 2025
 View Chart
(opens in a new tab)
View Chart
(opens in a new tab)
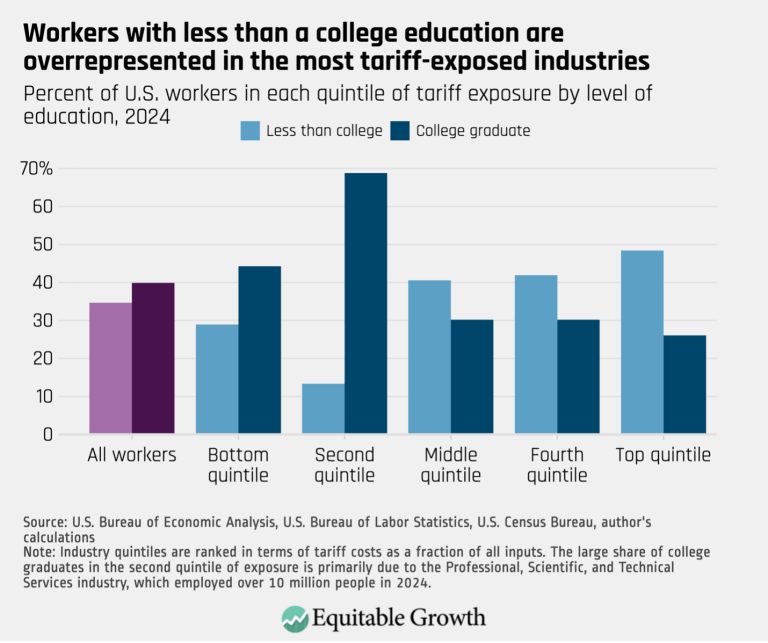
Workers with less than a college education are overrepresented in the most tariff-exposed industries (opens in a new tab)
Visualizations Nov 3, 2025
 View Chart
(opens in a new tab)
View Chart
(opens in a new tab)
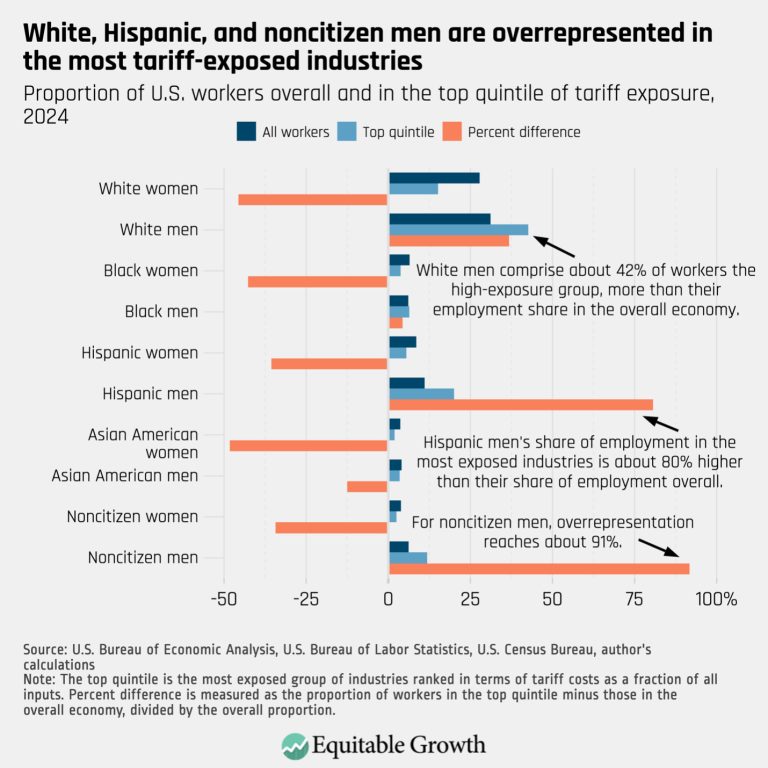
White, Hispanic, and noncitizen men are overrepresented in the most tariff-exposed industries (opens in a new tab)
Visualizations Nov 3, 2025
 View Chart
(opens in a new tab)
View Chart
(opens in a new tab)
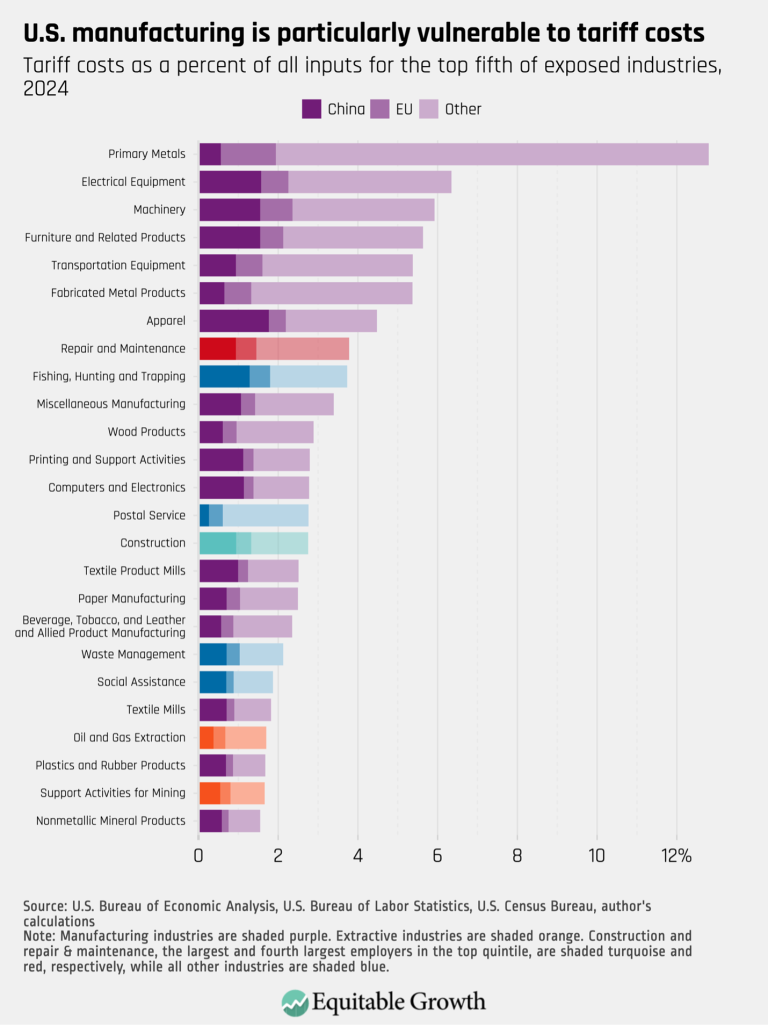
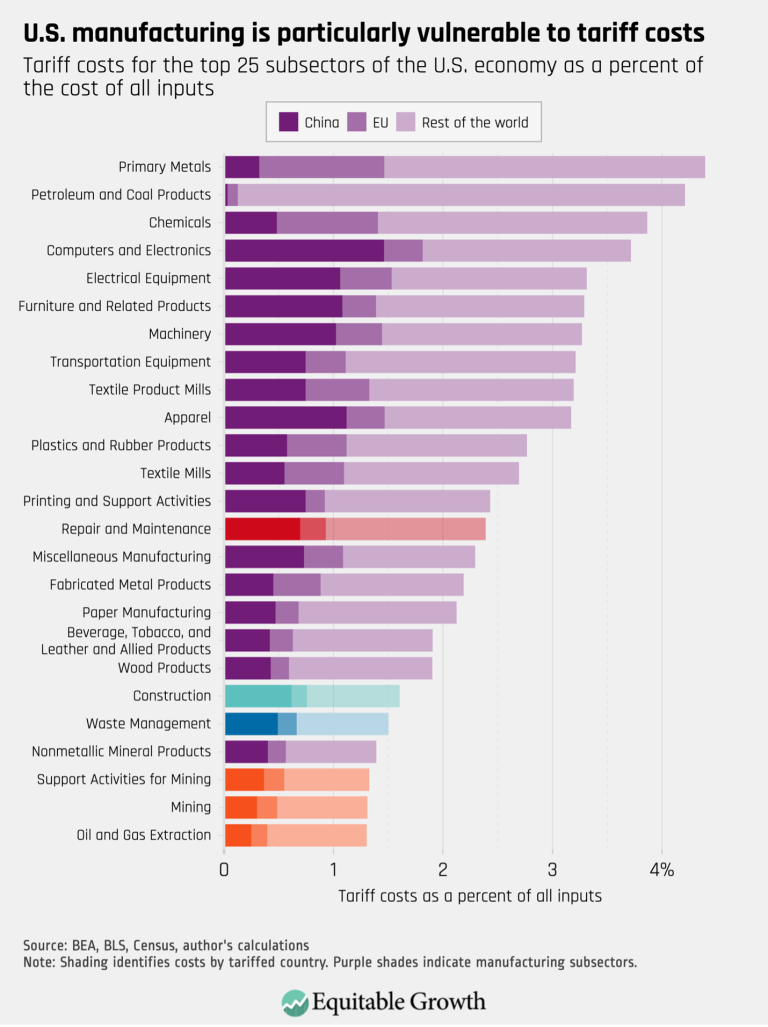
U.S. manufacturing is particularly vulnerable to tariff costs (opens in a new tab)
Visualizations Nov 3, 2025
 View Chart
(opens in a new tab)
View Chart
(opens in a new tab)
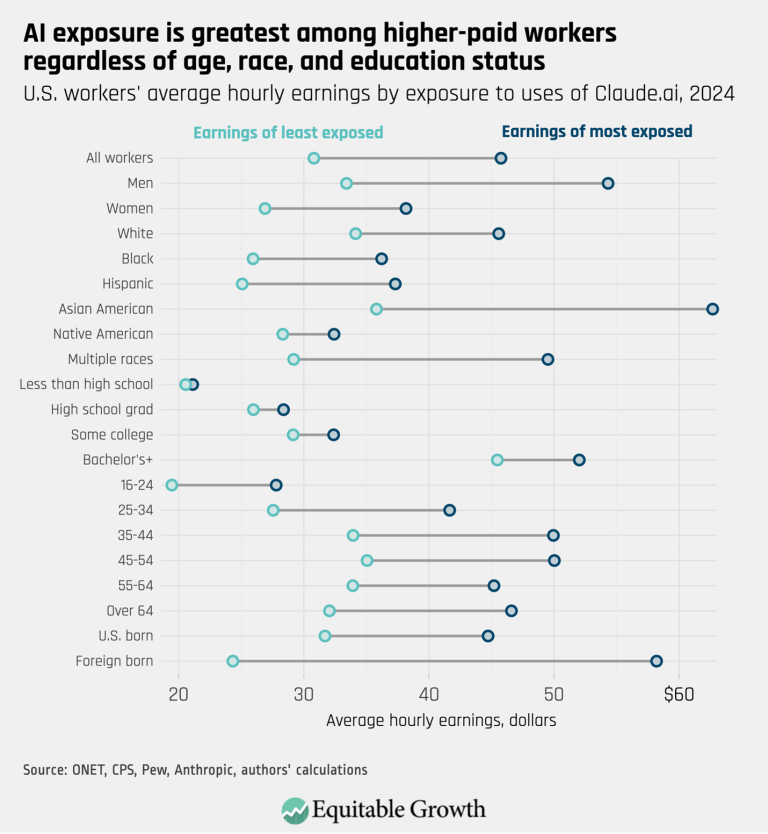
AI exposure is greatest among higher-paid workers regardless of age, race and education status (opens in a new tab)
Visualizations Oct 22, 2025
 View Chart
(opens in a new tab)
View Chart
(opens in a new tab)
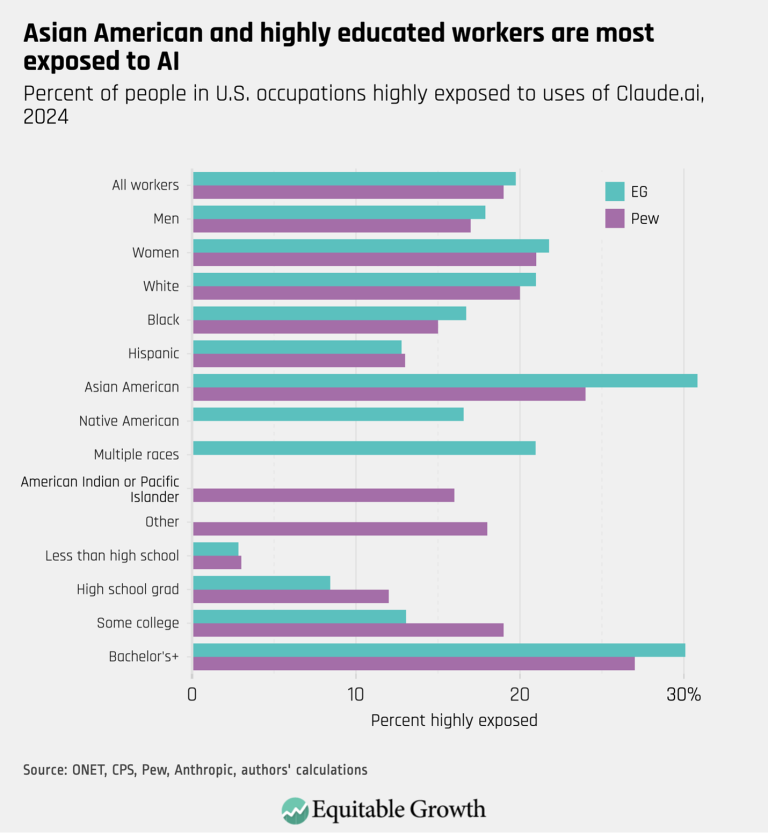
Asian American and highly educated workers are most exposed to AI (opens in a new tab)
Visualizations Oct 22, 2025
 View Chart
(opens in a new tab)
View Chart
(opens in a new tab)
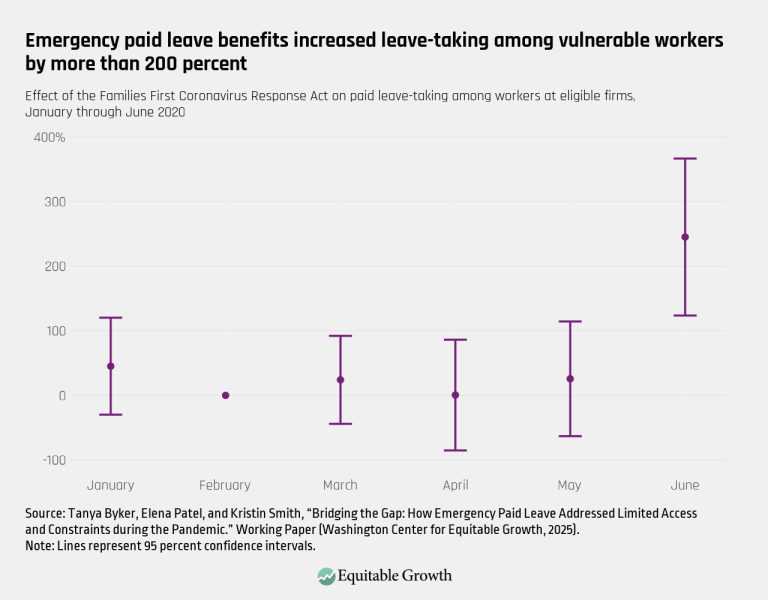
Emergency paid leave benefits increased leave-taking among vulnerable workers by more than 200 percent – Final (opens in a new tab)
Visualizations Sep 23, 2025
 View Chart
(opens in a new tab)
View Chart
(opens in a new tab)
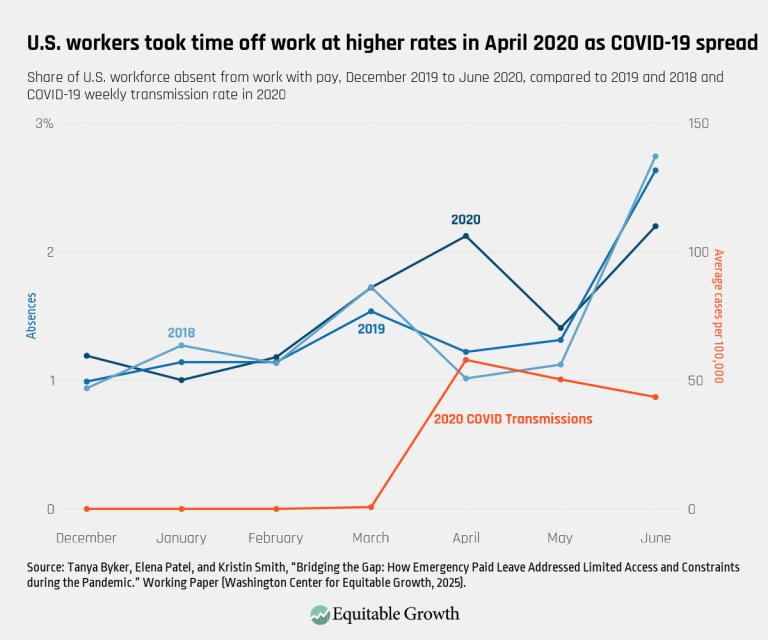
U.S. workers took time off work at higher rates in April 2020 as COVID-19 spread (opens in a new tab)
Visualizations Sep 23, 2025
 View Chart
(opens in a new tab)
View Chart
(opens in a new tab)
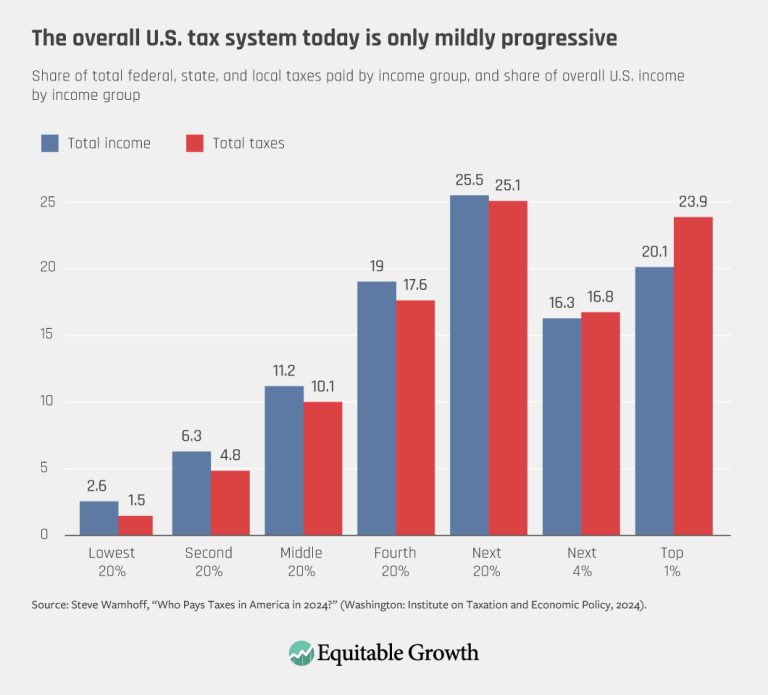
The overall U.S. tax system today is only mildly progressive (opens in a new tab)
Visualizations Sep 10, 2025
 View Chart
(opens in a new tab)
View Chart
(opens in a new tab)
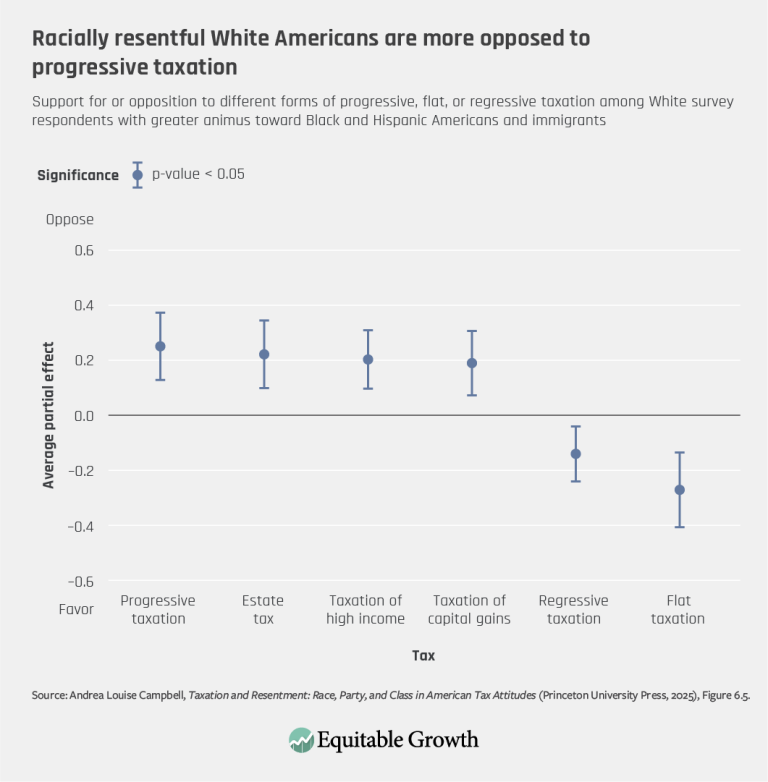
Racially resentful White Americans are more opposed to progressive taxation (opens in a new tab)
Visualizations Sep 9, 2025
 View Chart
(opens in a new tab)
View Chart
(opens in a new tab)
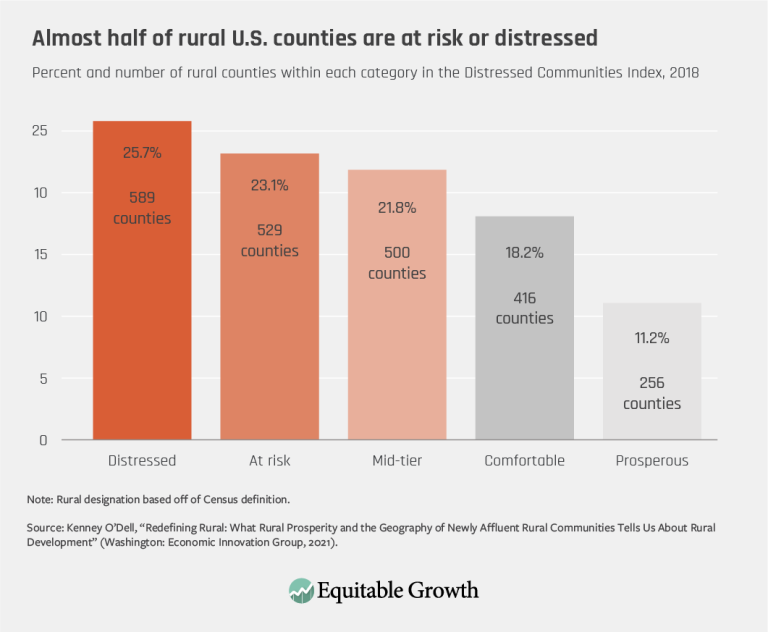
Almost half of rural U.S. counties are at risk or distressed (opens in a new tab)
Visualizations Sep 8, 2025
 View Chart
(opens in a new tab)
View Chart
(opens in a new tab)
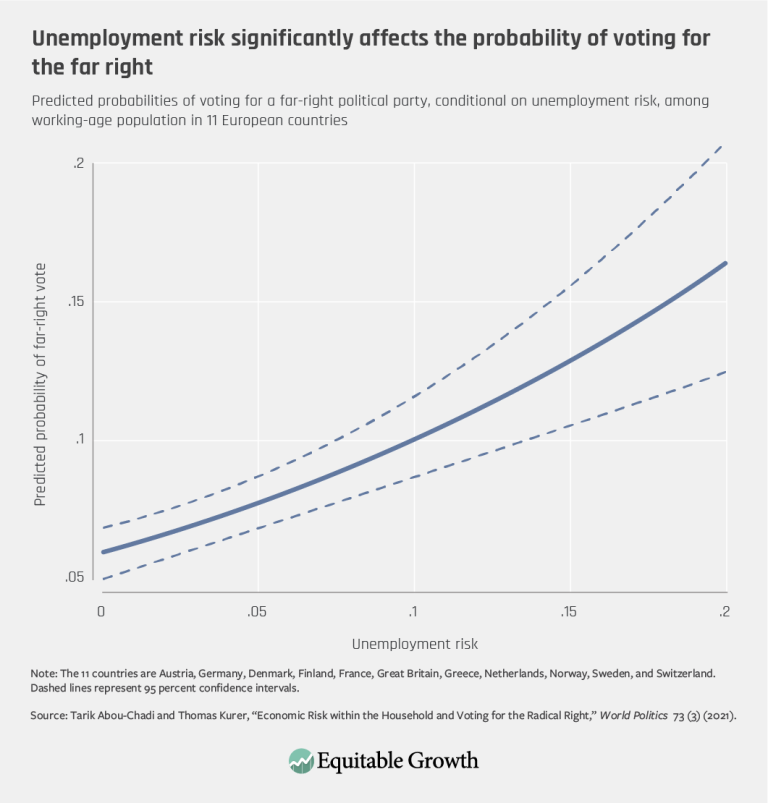
Unemployment risk significantly affects the probability of voting for the far right (opens in a new tab)
Visualizations Sep 5, 2025
 View Chart
(opens in a new tab)
View Chart
(opens in a new tab)
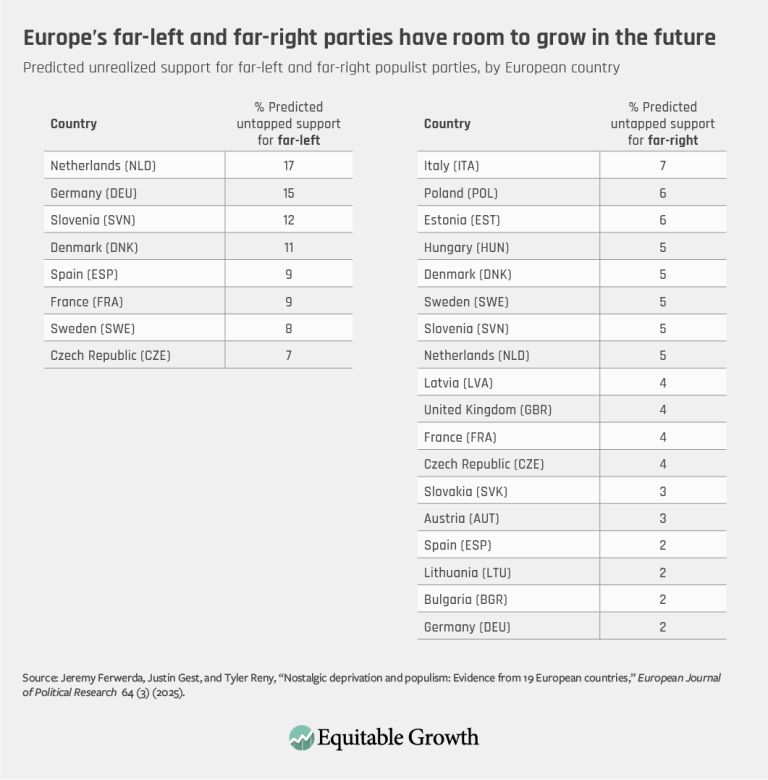
Europe’s far-left and far-right parties have room to grow in the future (opens in a new tab)
Visualizations Sep 4, 2025
 View Chart
(opens in a new tab)
View Chart
(opens in a new tab)
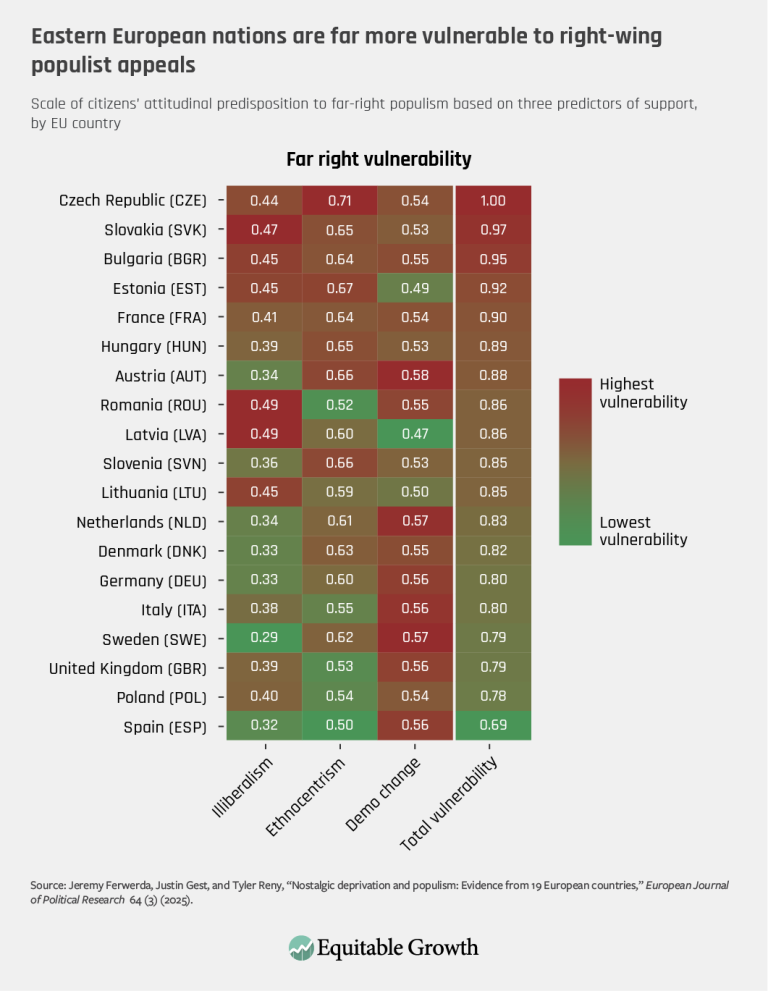
Eastern European nations are far more vulnerable to right-wing populist appeals (opens in a new tab)
Visualizations Sep 4, 2025
 View Chart
(opens in a new tab)
View Chart
(opens in a new tab)
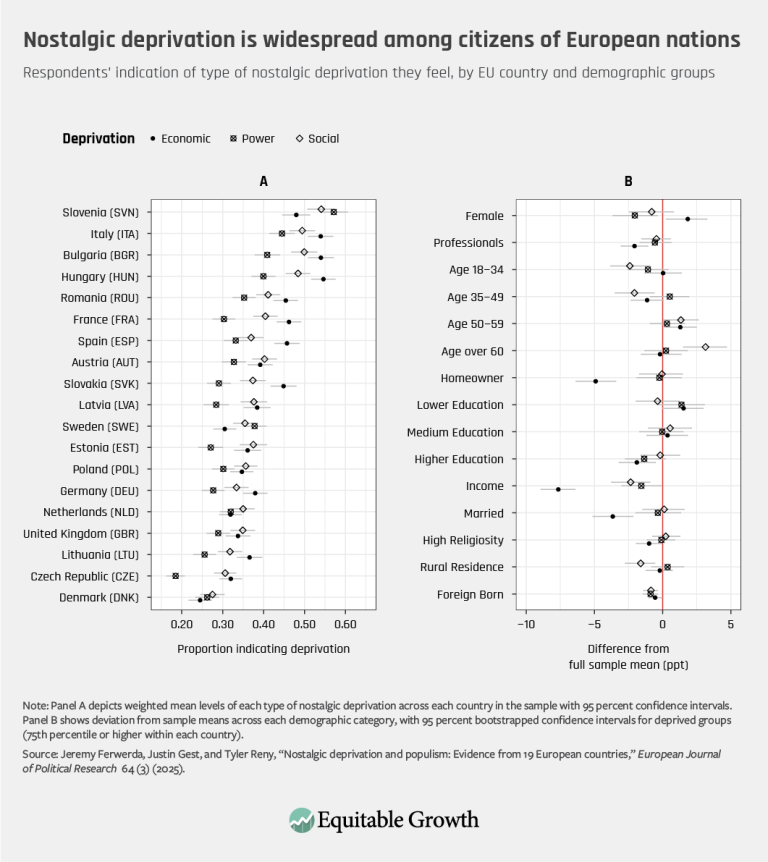
Nostalgic deprivation is widespread among citizens of European nations (opens in a new tab)
Visualizations Sep 4, 2025
 View Chart
(opens in a new tab)
View Chart
(opens in a new tab)
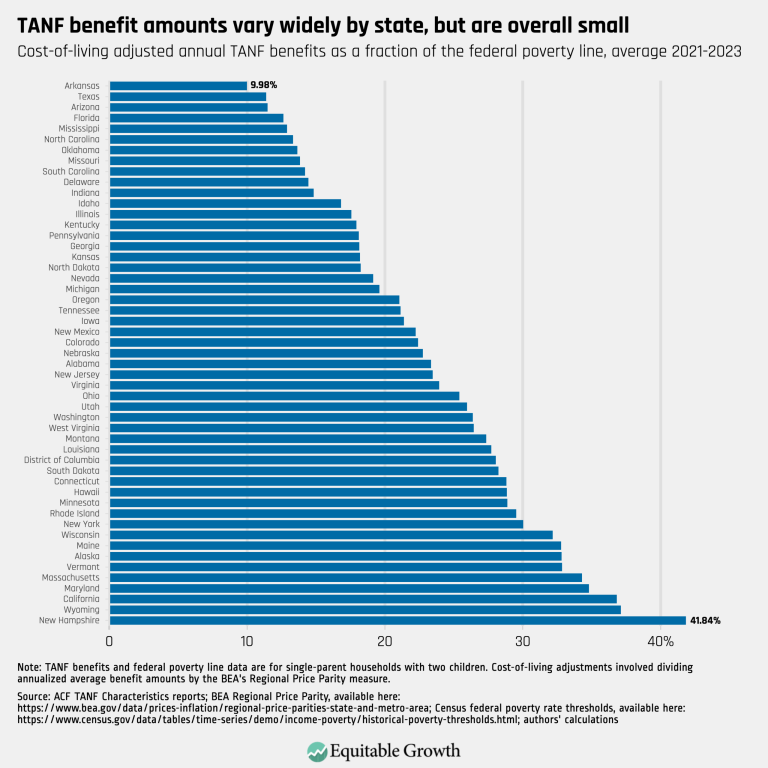
TANF benefit amounts vary widely by state, but are overall small – updated (opens in a new tab)
Visualizations Aug 26, 2025
 View Chart
(opens in a new tab)
View Chart
(opens in a new tab)
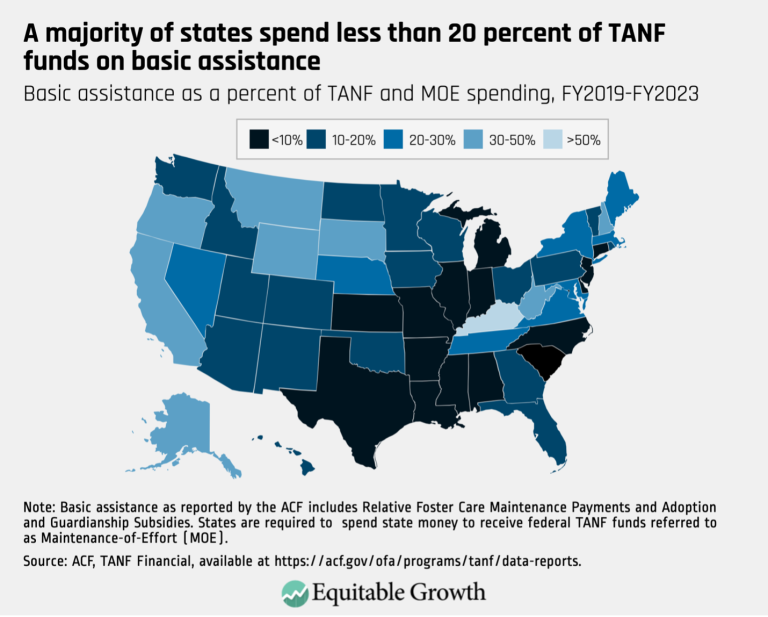
A majority of states spend less than 20 percent of TANF funds on basic assistance (opens in a new tab)
Visualizations Aug 26, 2025
 View Chart
(opens in a new tab)
View Chart
(opens in a new tab)
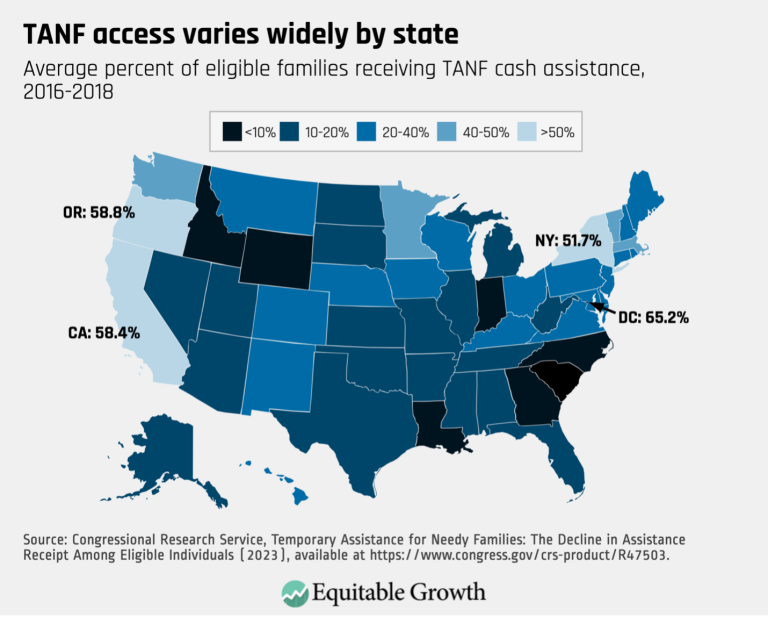
TANF access varies widely by state (opens in a new tab)
Visualizations Aug 26, 2025
 View Chart
(opens in a new tab)
View Chart
(opens in a new tab)
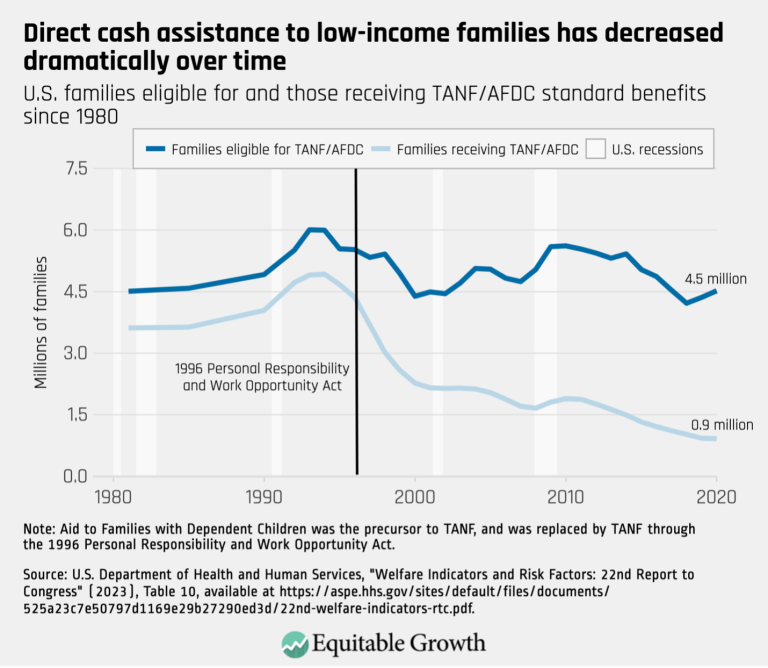
Direct cash assistance to low-income families has decreased dramatically over time (opens in a new tab)
Visualizations Aug 26, 2025
 View Chart
(opens in a new tab)
View Chart
(opens in a new tab)
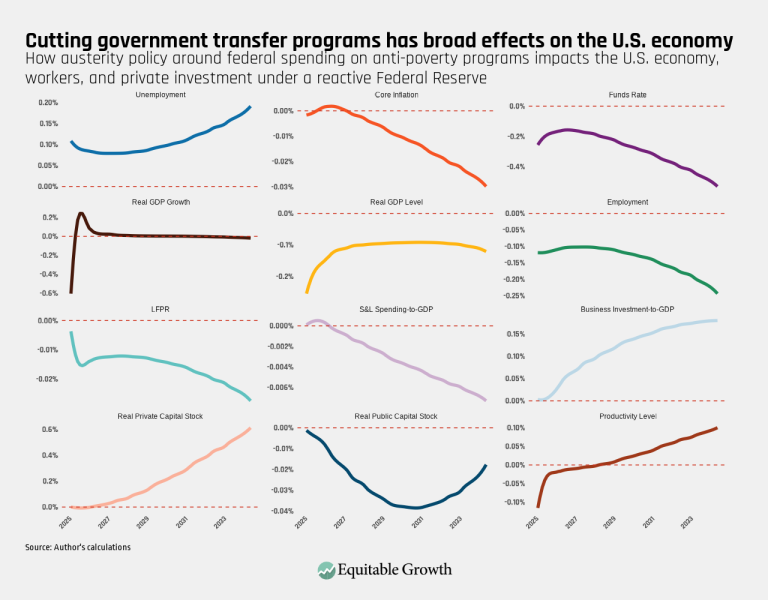
Cutting government transfer programs has broad effects on the U.S. economy (opens in a new tab)
Visualizations Aug 12, 2025
 View Chart
(opens in a new tab)
View Chart
(opens in a new tab)
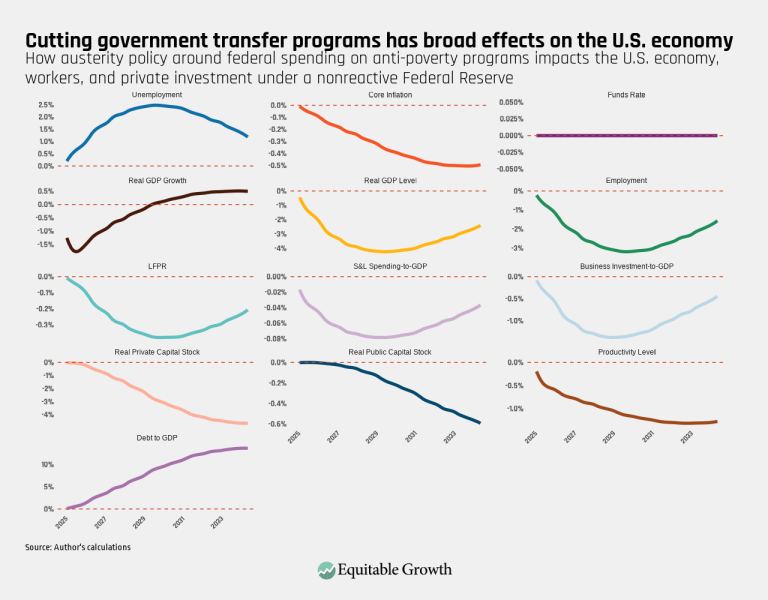
Cutting government transfer programs has broad effects on the U.S. economy (opens in a new tab)
Visualizations Aug 12, 2025
 View Chart
(opens in a new tab)
View Chart
(opens in a new tab)
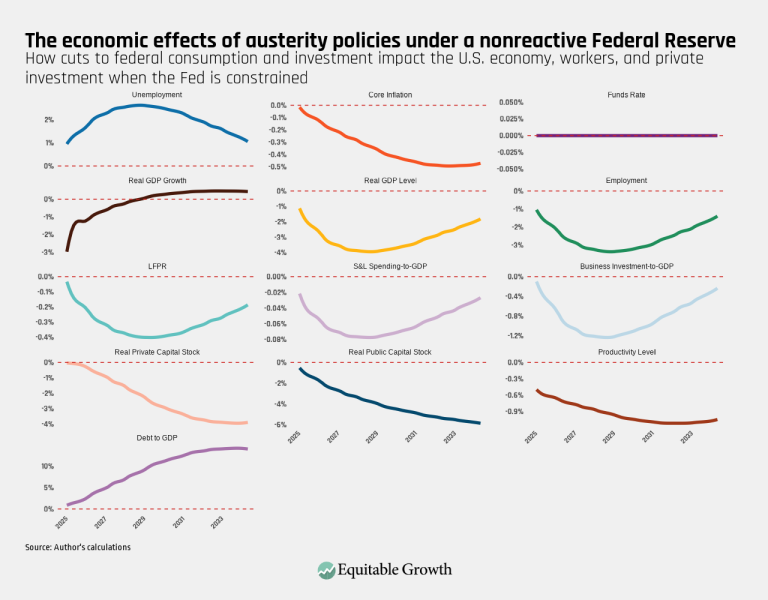
The economic effects of austerity policies under a nonreactive Federal Reserve – Final (opens in a new tab)
Visualizations Aug 12, 2025
 View Chart
(opens in a new tab)
View Chart
(opens in a new tab)
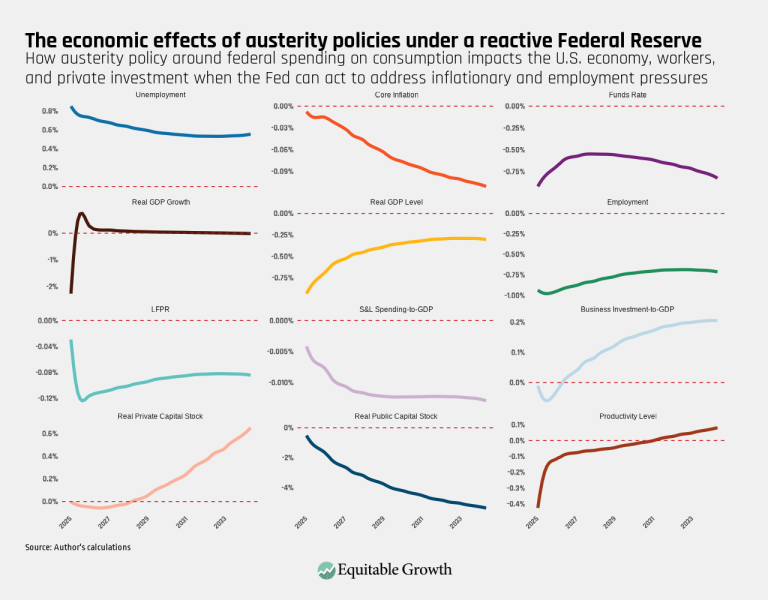
The economic effects of austerity policies under a reactive Federal Reserve (opens in a new tab)
Visualizations Aug 12, 2025
 View Chart
(opens in a new tab)
View Chart
(opens in a new tab)
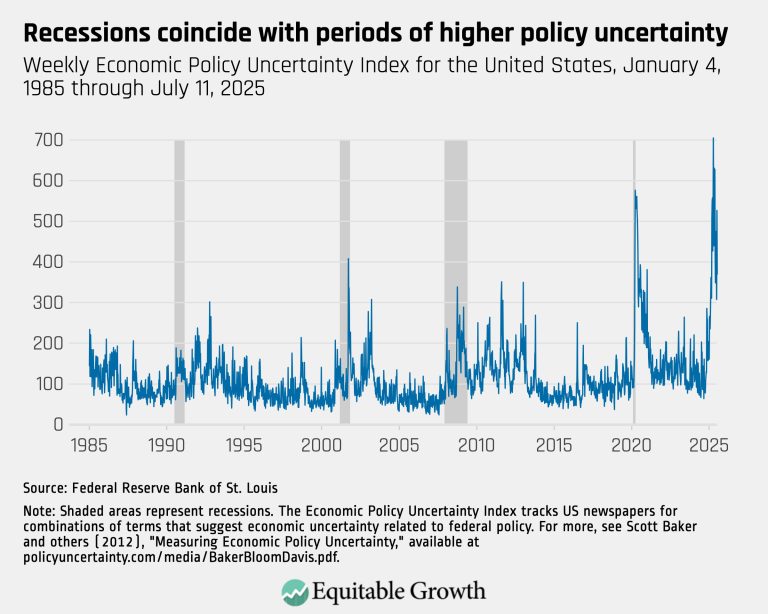
Recessions coincide with periods of higher policy uncertainty – updated (opens in a new tab)
Visualizations Aug 7, 2025
 View Chart
(opens in a new tab)
View Chart
(opens in a new tab)
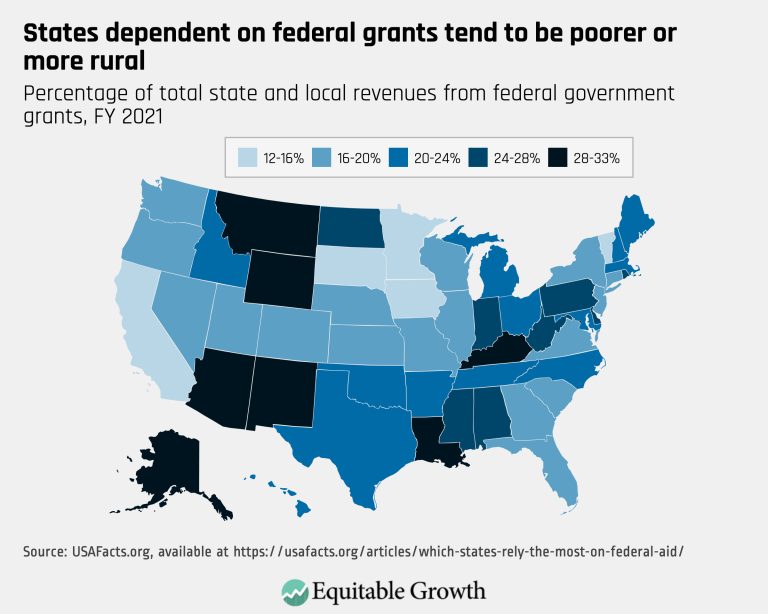
States dependent on federal grants tend to be poorer or more rural (opens in a new tab)
Visualizations Aug 7, 2025
 View Chart
(opens in a new tab)
View Chart
(opens in a new tab)
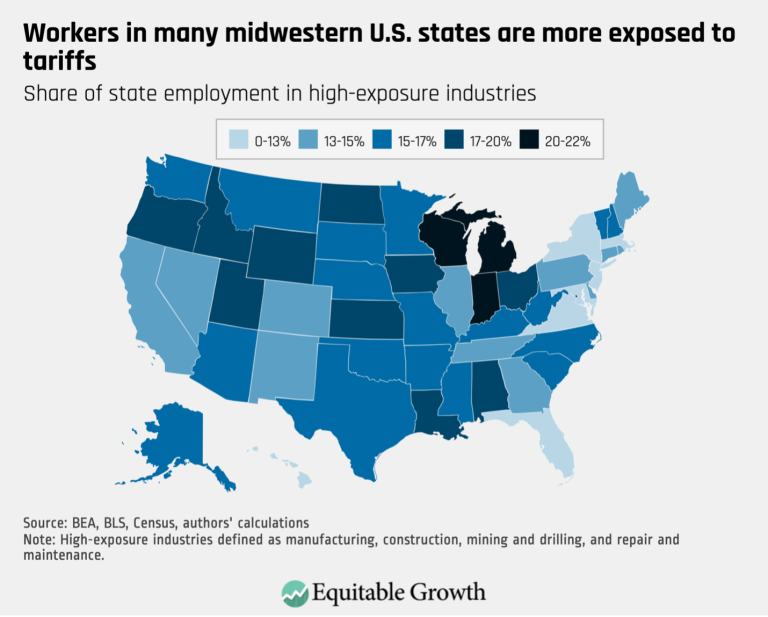
Workers in many midwestern U.S. states are more exposed to tariffs (opens in a new tab)
Visualizations Jul 28, 2025
 View Chart
(opens in a new tab)
View Chart
(opens in a new tab)
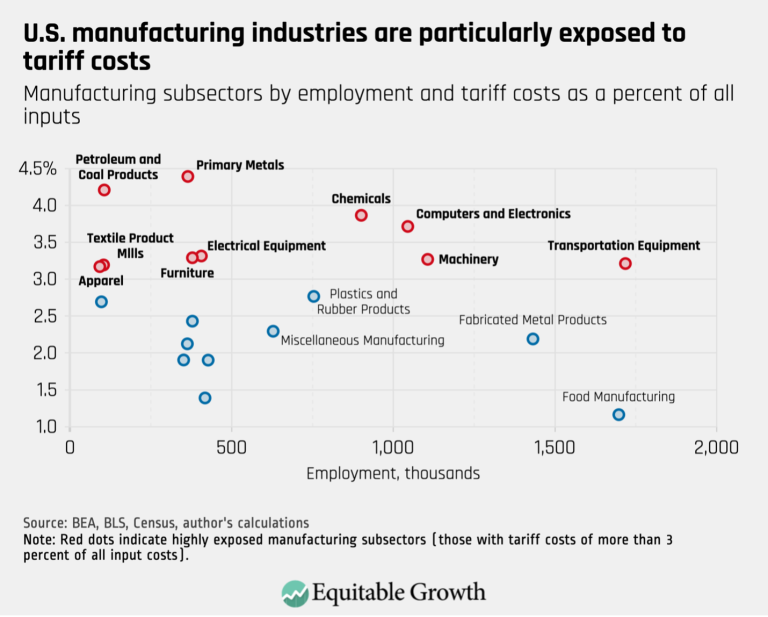
U.S. manufacturing industries are particularly exposed to tariff costs (opens in a new tab)
Visualizations Jul 28, 2025
 View Chart
(opens in a new tab)
View Chart
(opens in a new tab)
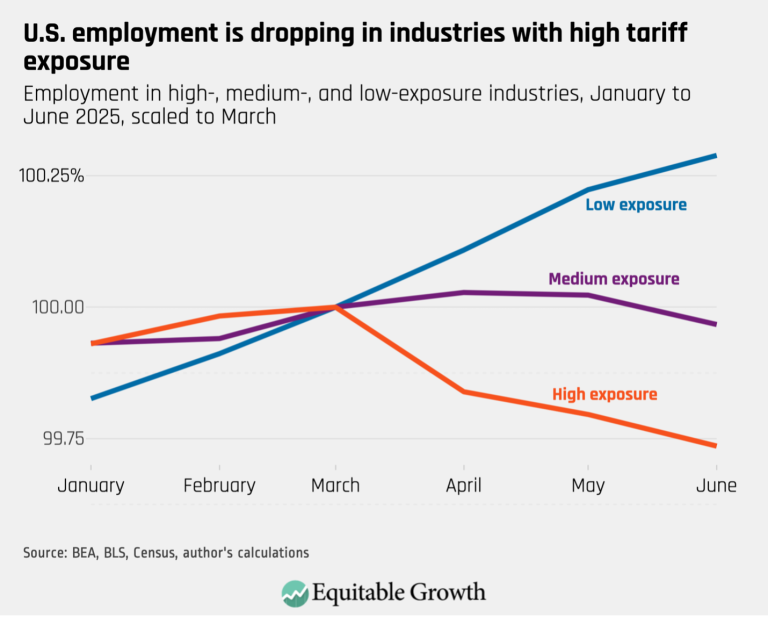
U.S. employment is dropping in industries with high tariff exposure (opens in a new tab)
Visualizations Jul 28, 2025
 View Chart
(opens in a new tab)
View Chart
(opens in a new tab)
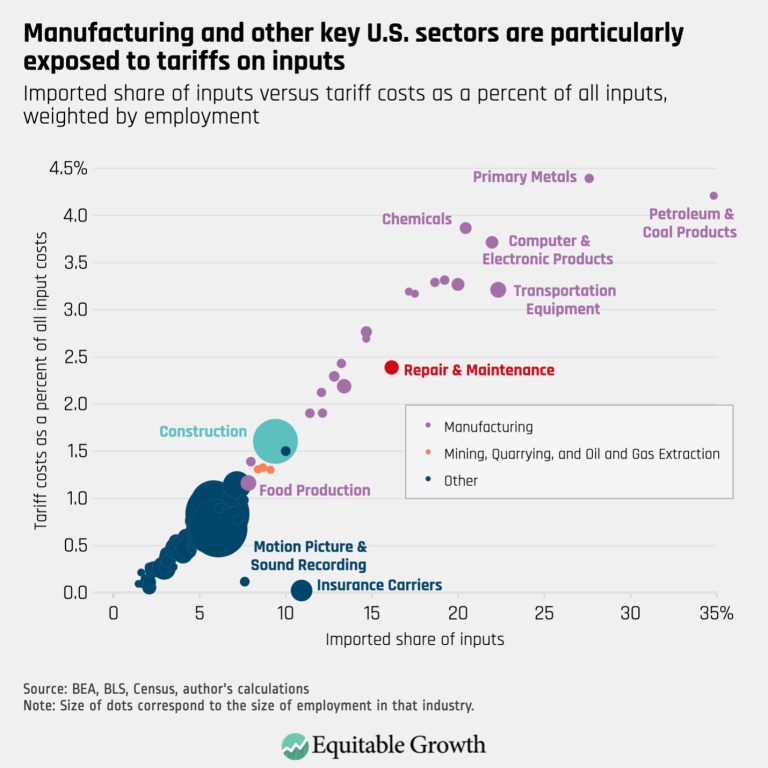
Manufacturing and other key U.S. sectors are particularly exposed to tariffs on inputs (opens in a new tab)
Visualizations Jul 28, 2025
 View Chart
(opens in a new tab)
View Chart
(opens in a new tab)
U.S. manufacturing is particularly vulnerable to tariff costs (opens in a new tab)
Visualizations Jul 28, 2025
 View Chart
(opens in a new tab)
View Chart
(opens in a new tab)
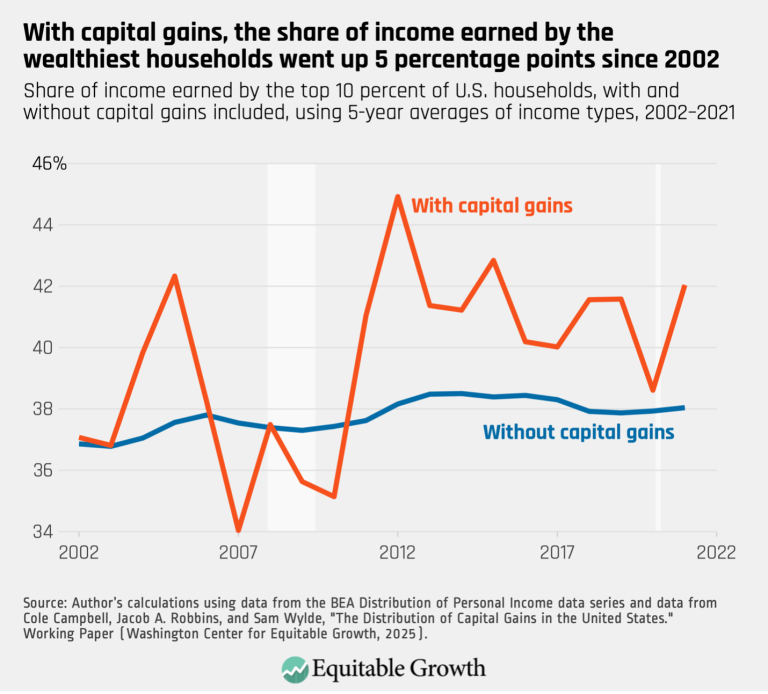
With capital gains, the share of income earned by the wealthiest households went up 5 percentage points since 2002 (opens in a new tab)
Visualizations Jul 14, 2025
 View Chart
(opens in a new tab)
View Chart
(opens in a new tab)
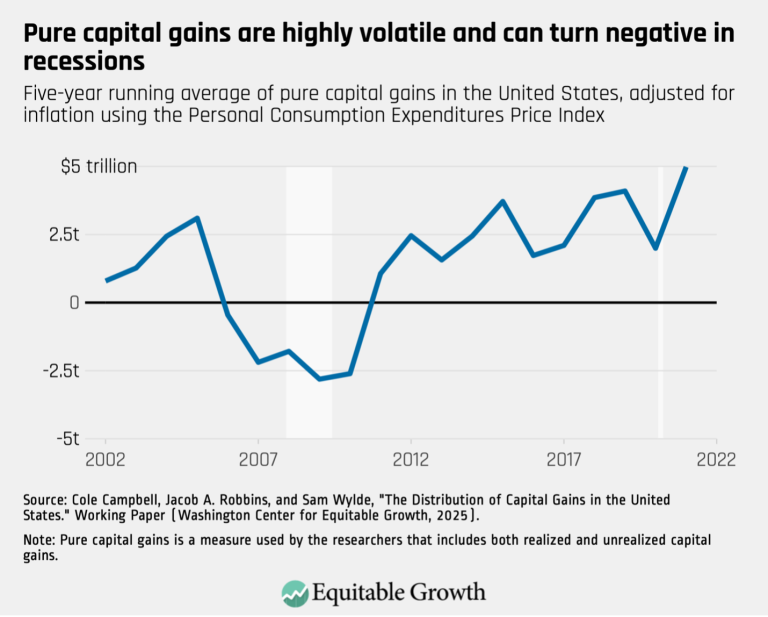
Pure capital gains are highly volatile and can turn negative in recessions (opens in a new tab)
Visualizations Jul 14, 2025
 View Chart
(opens in a new tab)
View Chart
(opens in a new tab)
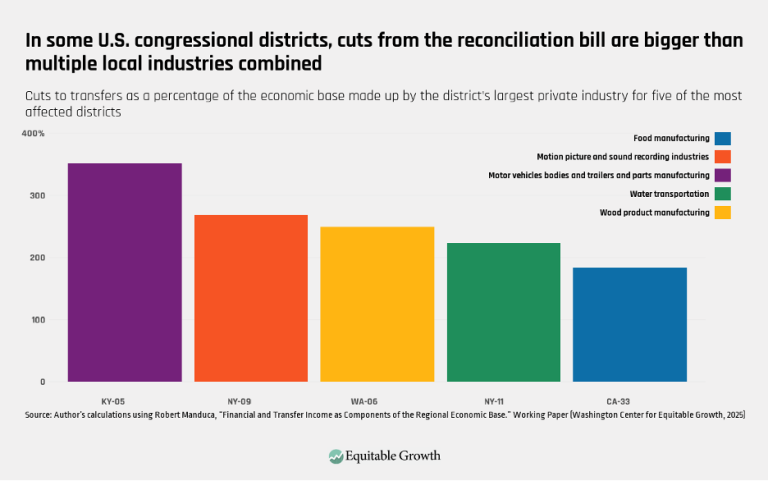
In some U.S. congressional districts, cuts from the reconciliation bill are bigger than multiple local industries combined (opens in a new tab)
Visualizations Jul 10, 2025
 View Chart
(opens in a new tab)
View Chart
(opens in a new tab)
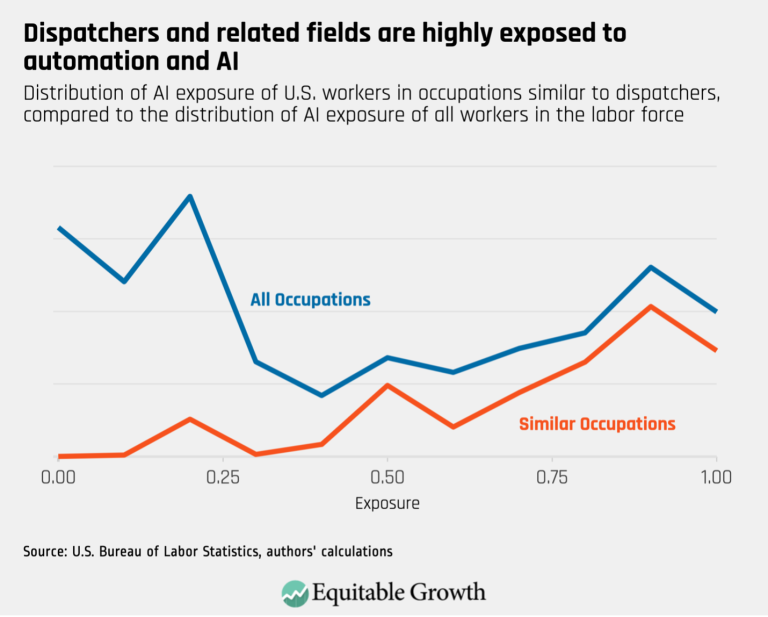
Dispatchers and related fields are highly exposed to automation and AI (opens in a new tab)
Visualizations Jul 10, 2025
 View Chart
(opens in a new tab)
View Chart
(opens in a new tab)
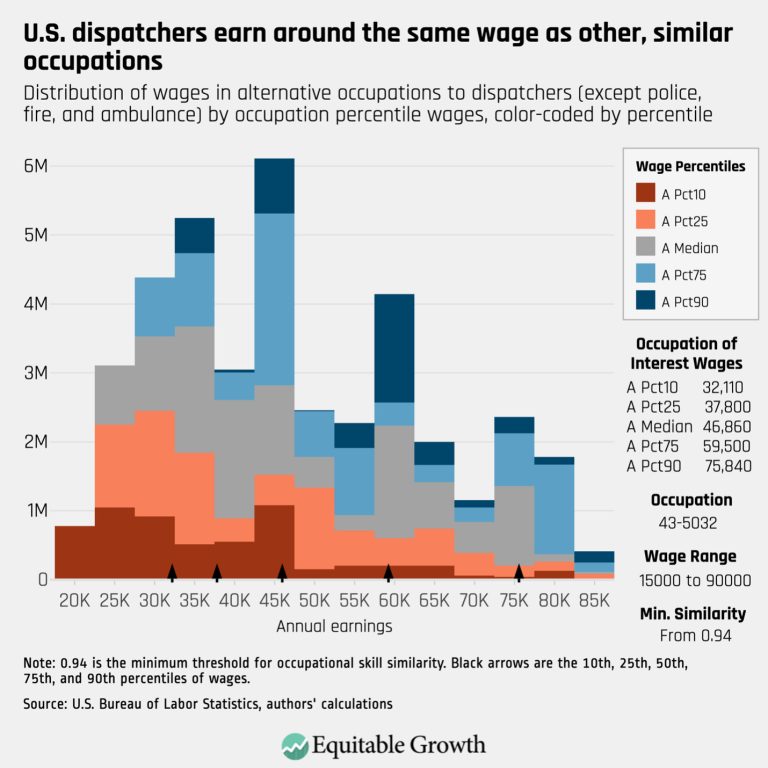
U.S. dispatchers earn around the same wage as other, similar occupations (opens in a new tab)
Visualizations Jul 10, 2025
 View Chart
(opens in a new tab)
View Chart
(opens in a new tab)
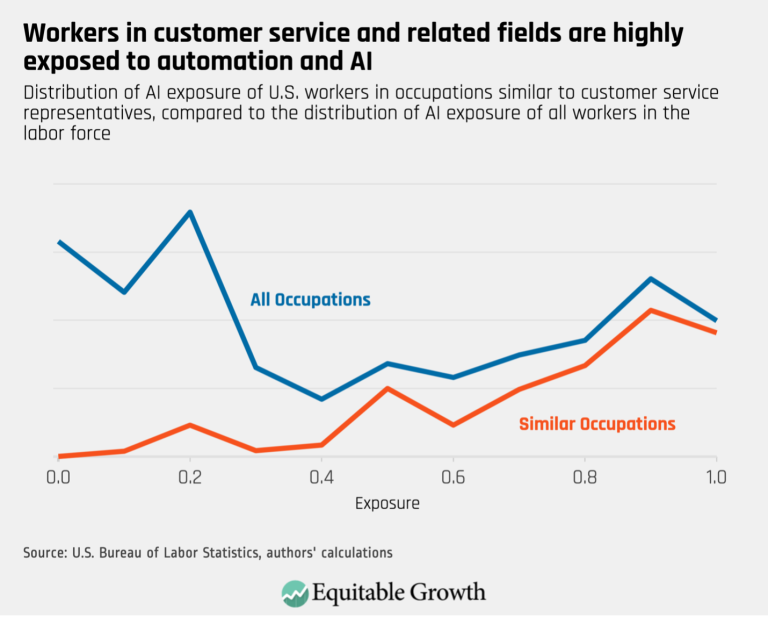
Workers in customer service and related fields are highly exposed to automation and AI (opens in a new tab)
Visualizations Jul 10, 2025
 View Chart
(opens in a new tab)
View Chart
(opens in a new tab)
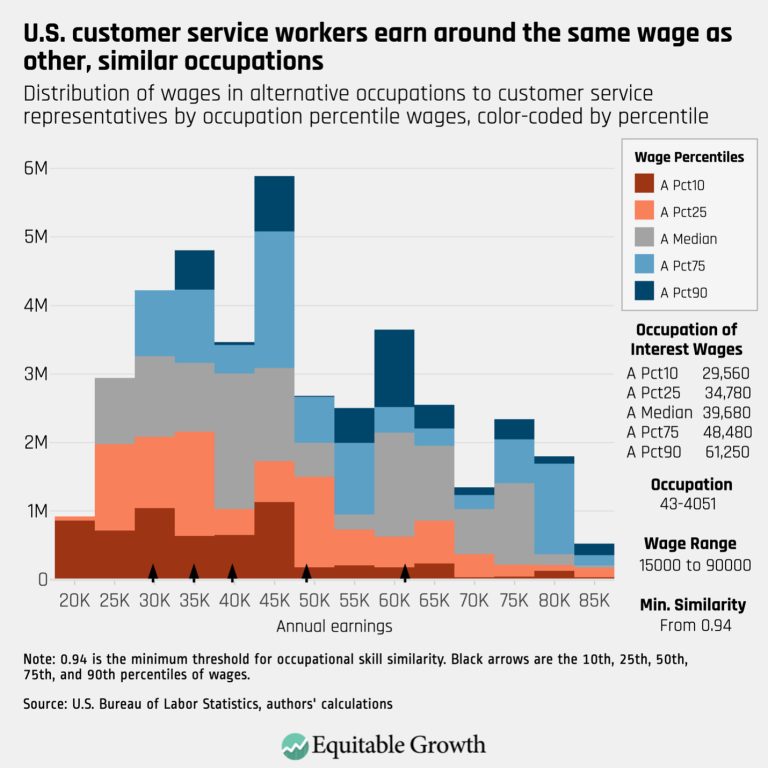
U.S. customer service workers earn around the same wage as other, similar occupations (opens in a new tab)
Visualizations Jul 10, 2025
 View Chart
(opens in a new tab)
View Chart
(opens in a new tab)
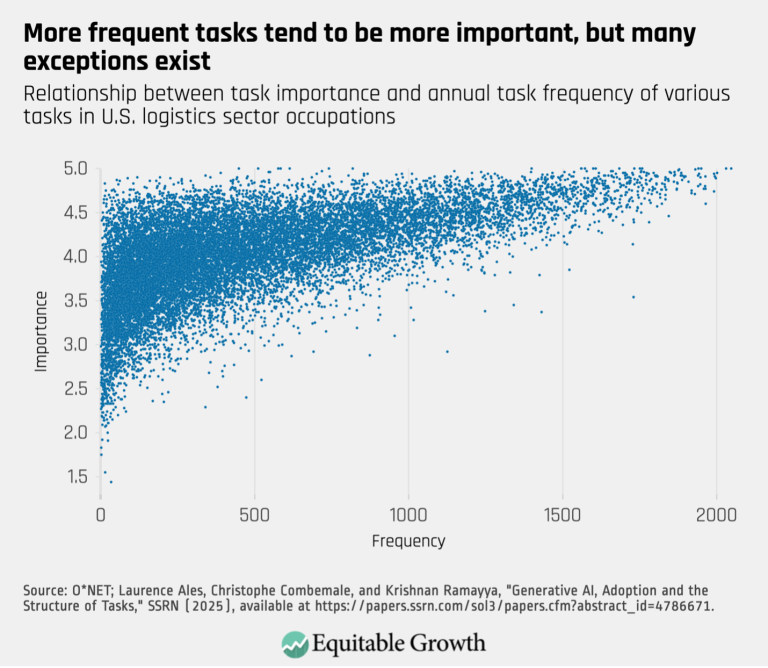
More frequent tasks tend to be more important, but many exceptions exist (opens in a new tab)
Visualizations Jul 9, 2025
 View Chart
(opens in a new tab)
View Chart
(opens in a new tab)
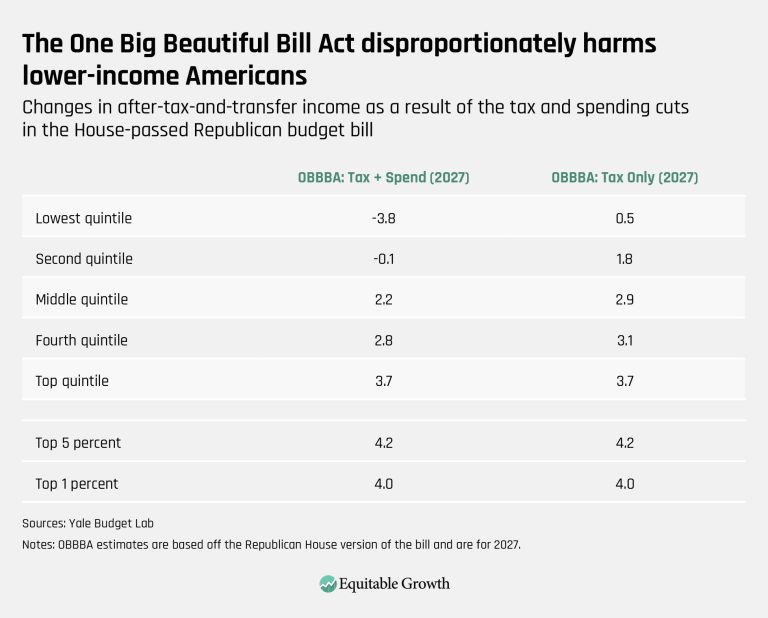
The One Big Beautiful Bill Act disproportionately harms lower-income Americans (opens in a new tab)
Visualizations Jul 3, 2025
 View Chart
(opens in a new tab)
View Chart
(opens in a new tab)
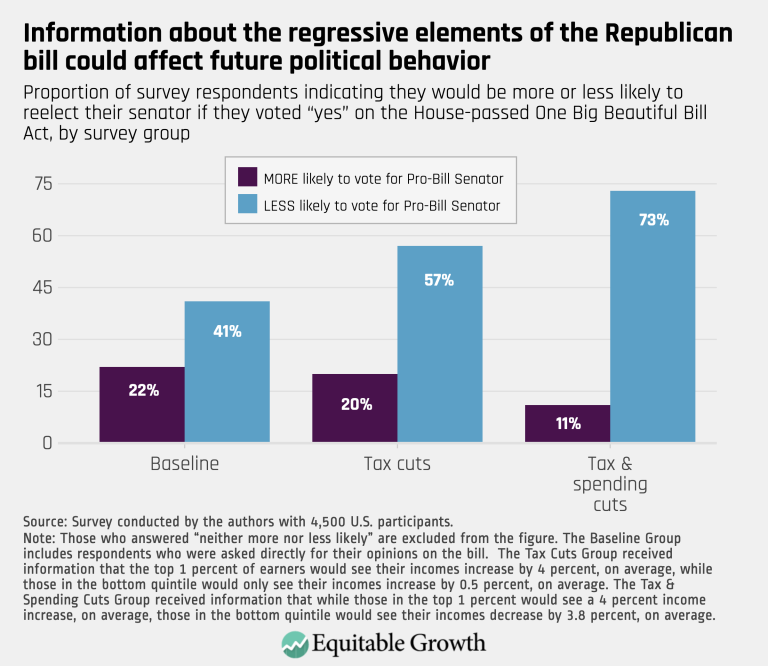
Information about the regressive elements of the Republican bill could affect future political behavior (opens in a new tab)
Visualizations Jul 2, 2025
 View Chart
(opens in a new tab)
View Chart
(opens in a new tab)
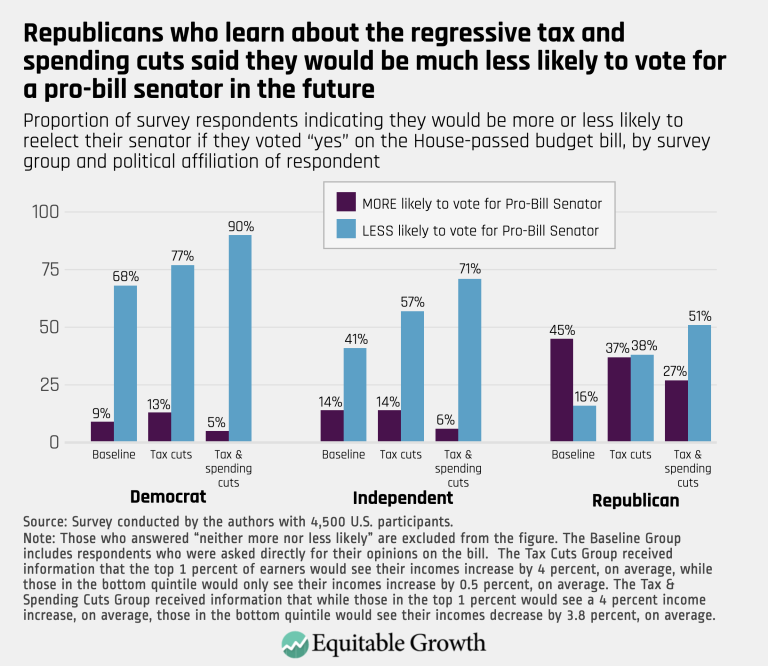
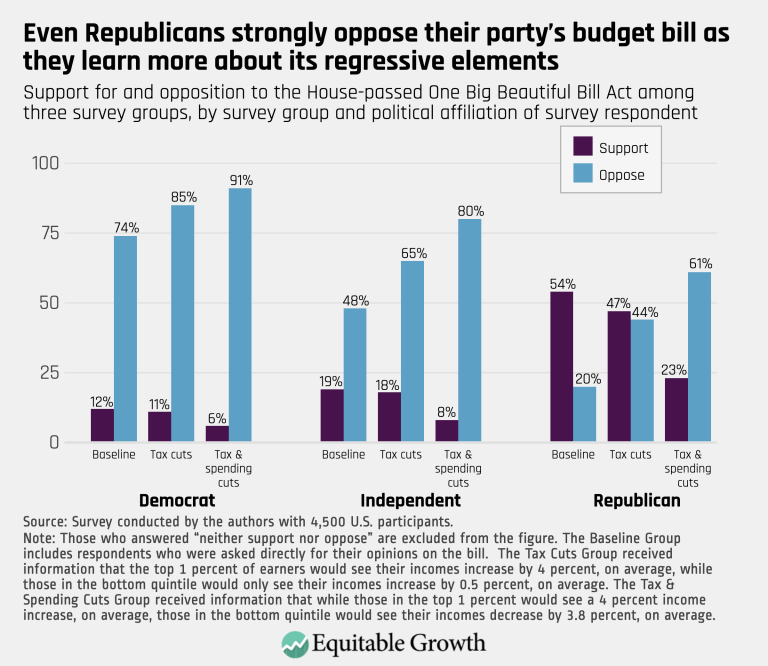
Even Republicans strongly oppose their party’s budget bill as they learn more about its regressive elements (opens in a new tab)
Visualizations Jul 2, 2025
 View Chart
(opens in a new tab)
View Chart
(opens in a new tab)
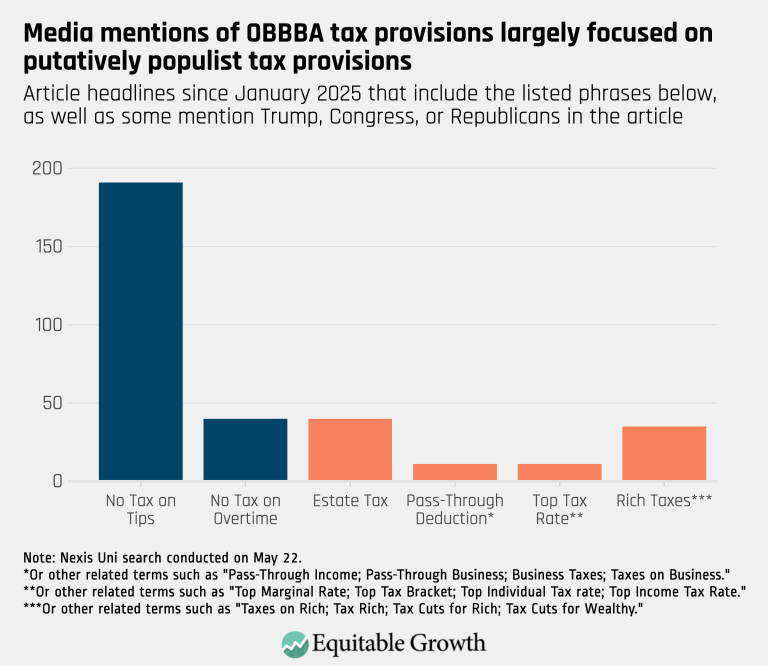
Media mentions of OBBBA tax provisions largely focused on putatively populist tax provisions (opens in a new tab)
Visualizations Jul 2, 2025
 View Chart
(opens in a new tab)
View Chart
(opens in a new tab)
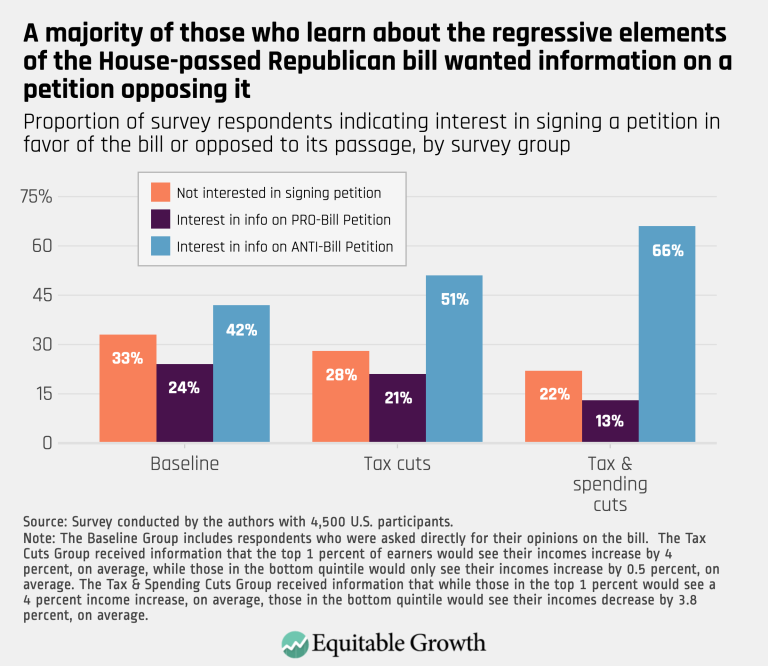
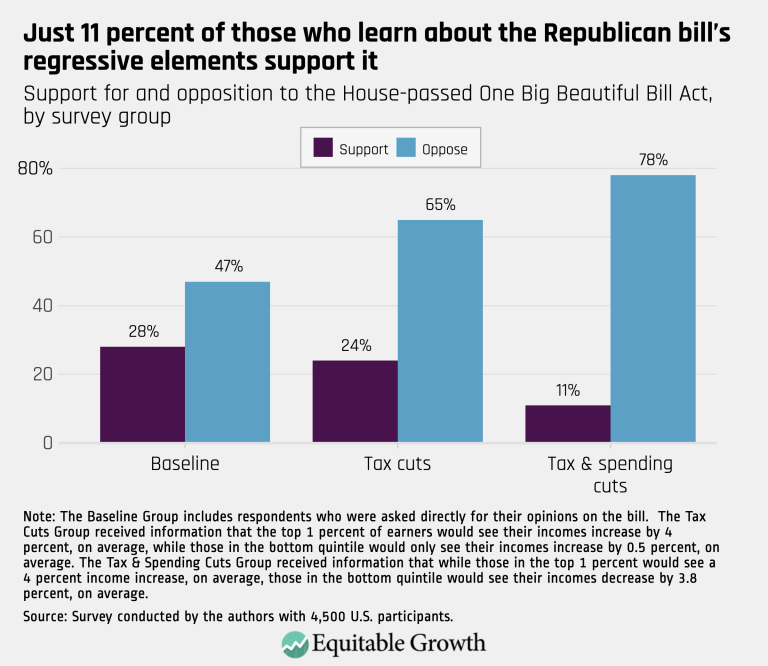
Just 11 percent of those who learn about the Republican bill’s regressive elements support it (opens in a new tab)
Visualizations Jul 2, 2025
 View Chart
(opens in a new tab)
View Chart
(opens in a new tab)
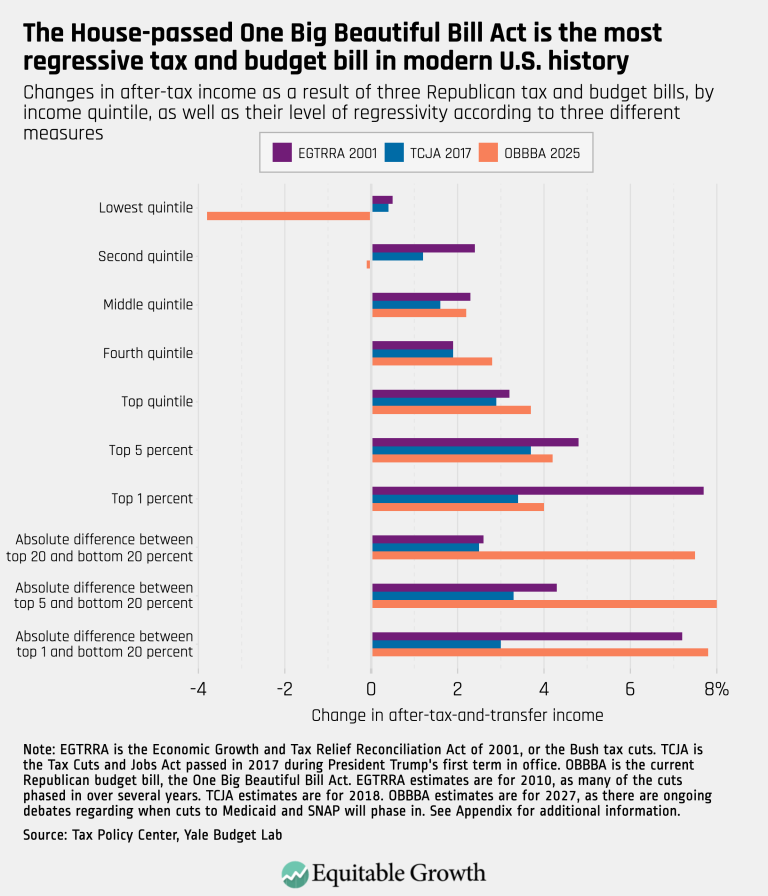
The House-passed One Big Beautiful Bill Act is the most regressive tax and budget bill in modern U.S. history (opens in a new tab)
Visualizations Jun 27, 2025
 View Chart
(opens in a new tab)
View Chart
(opens in a new tab)
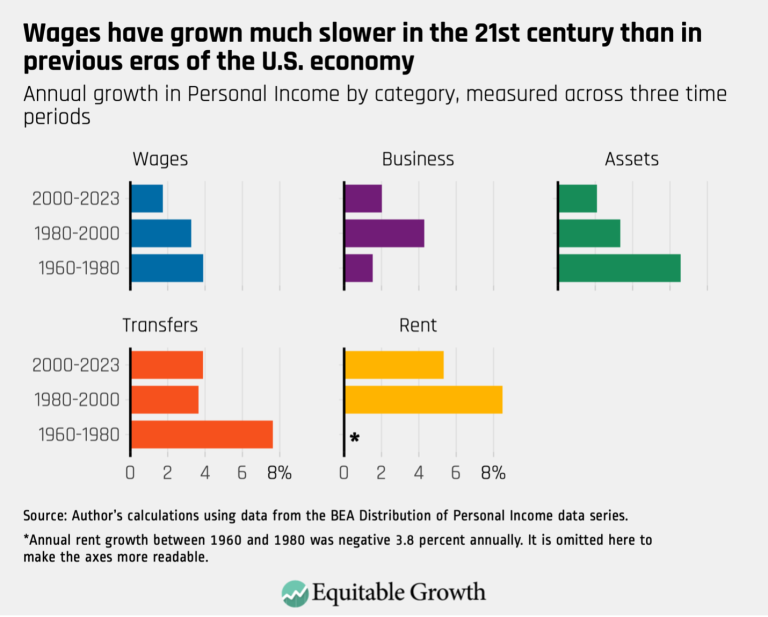
Wages have grown much slower in the 21st century than in previous eras of the U.S. economy (opens in a new tab)
Visualizations Jun 25, 2025
 View Chart
(opens in a new tab)
View Chart
(opens in a new tab)
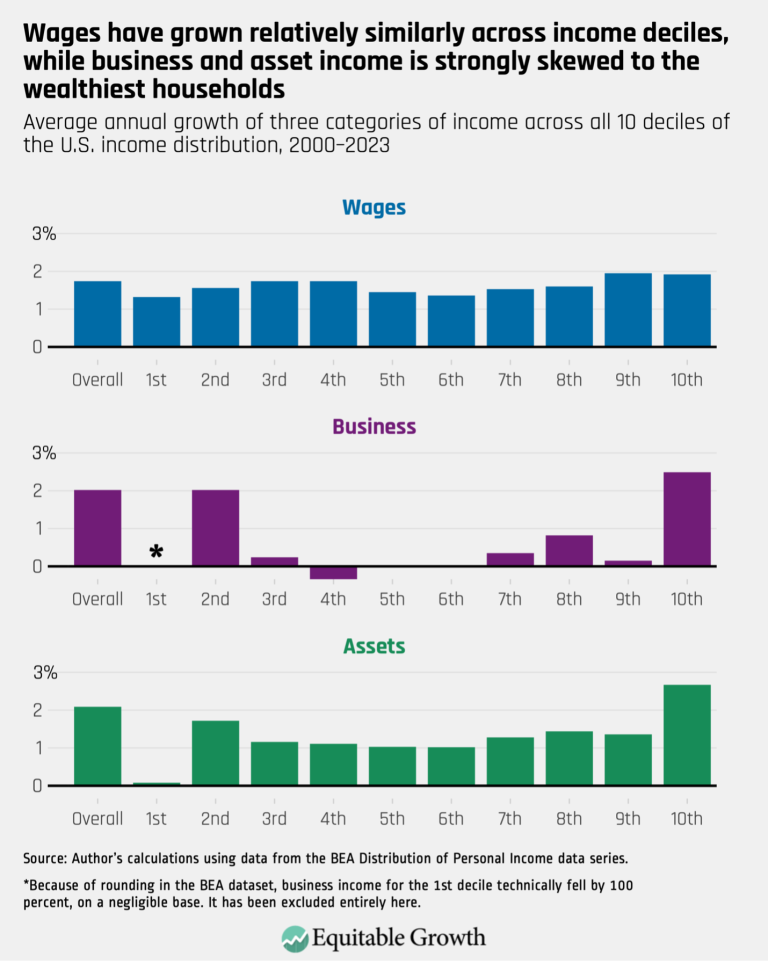
Wages have grown relatively similarly across income deciles, while business and asset income is strongly skewed to the wealthiest households (opens in a new tab)
Visualizations Jun 25, 2025
 View Chart
(opens in a new tab)
View Chart
(opens in a new tab)
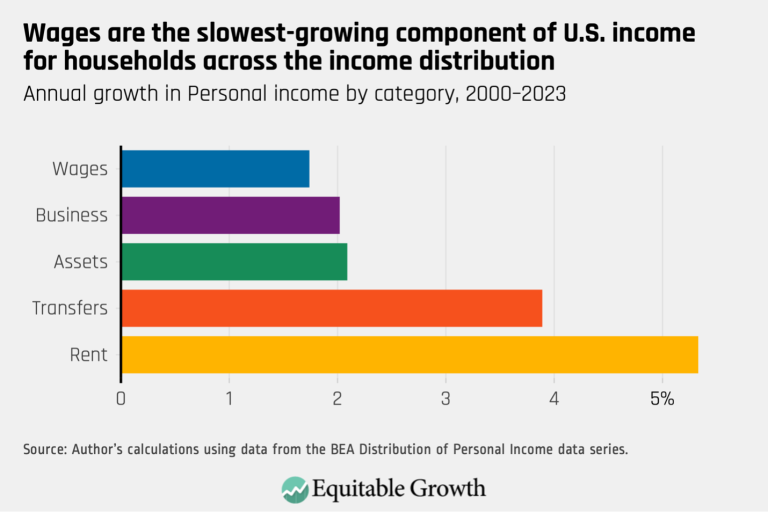
Wages are the slowest-growing component of U.S. income for households across the income distribution (opens in a new tab)
Visualizations Jun 25, 2025
 View Chart
(opens in a new tab)
View Chart
(opens in a new tab)
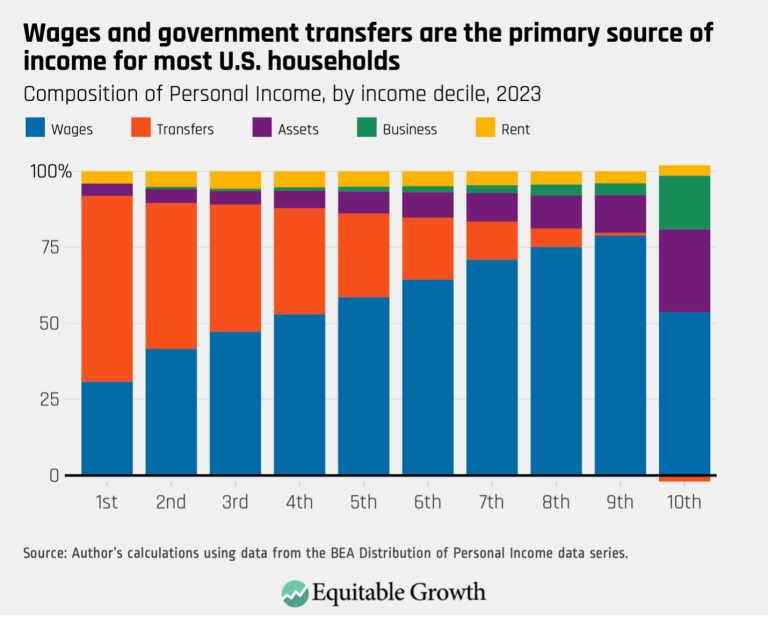
Wages and government transfers are the primary source of income for most U.S. households (opens in a new tab)
Visualizations Jun 25, 2025
 View Chart
(opens in a new tab)
View Chart
(opens in a new tab)
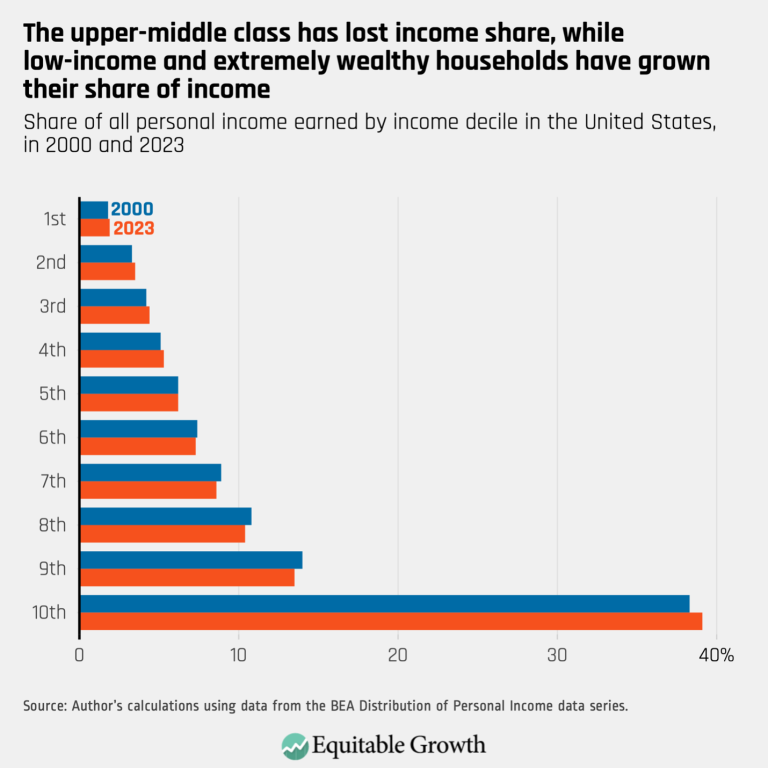
The upper-middle class has lost income share, while low-income and extremely wealthy households have grown their share of income (opens in a new tab)
Visualizations Jun 25, 2025
 View Chart
(opens in a new tab)
View Chart
(opens in a new tab)
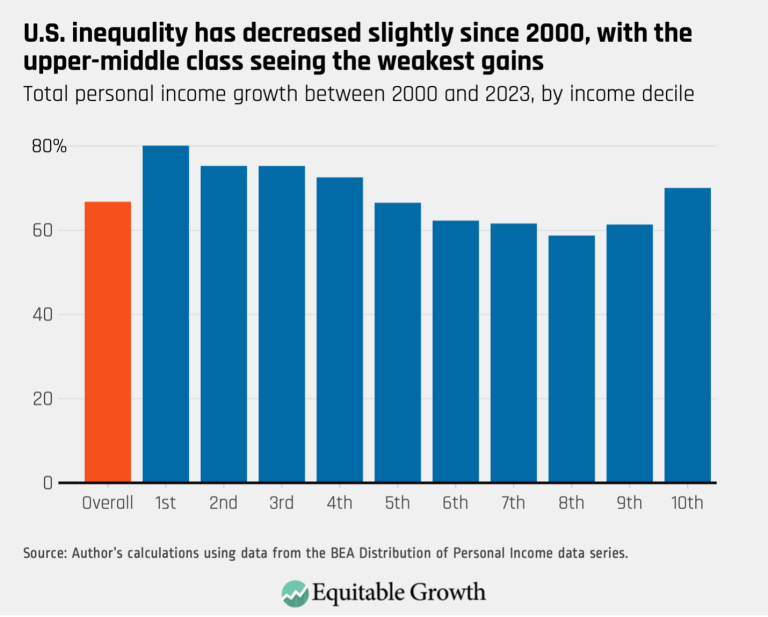
U.S. inequality has decreased slightly since 2000, with the upper-middle class seeing the weakest gains (opens in a new tab)
Visualizations Jun 25, 2025
 View Chart
(opens in a new tab)
View Chart
(opens in a new tab)
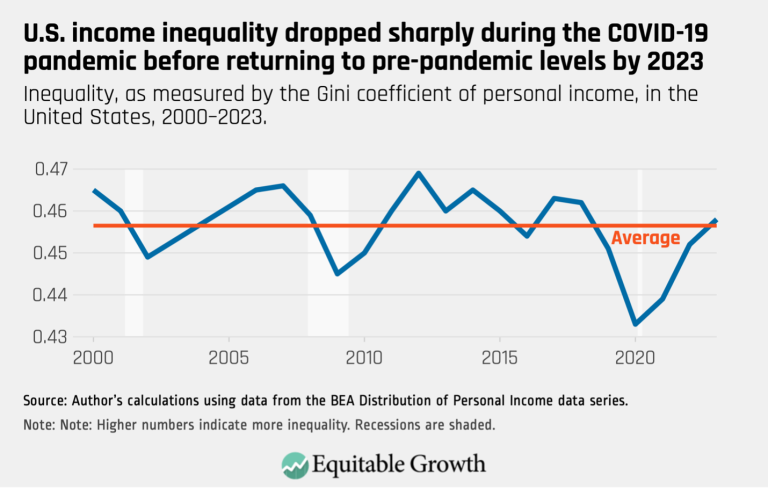
U.S. income inequality dropped sharply during the COVID-19 pandemic before returning to pre-pandemic levels by 2023 (opens in a new tab)
Visualizations Jun 25, 2025
 View Chart
(opens in a new tab)
View Chart
(opens in a new tab)
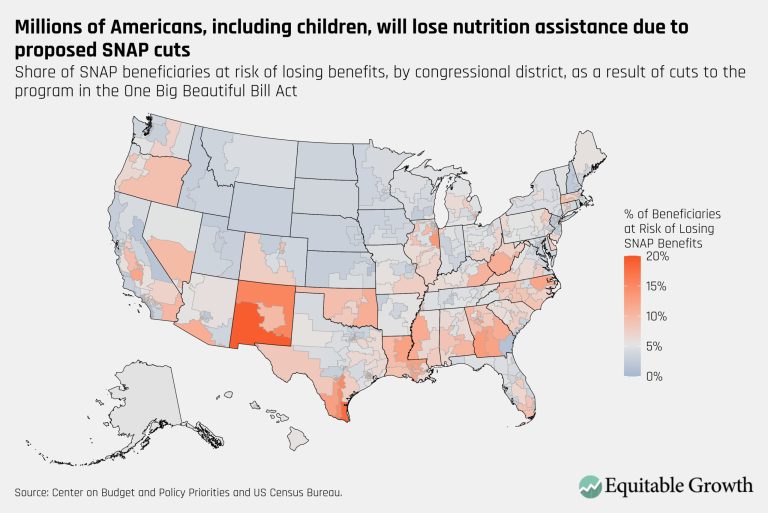
Millions of Americans, including children, will lose nutrition assistance due to proposed SNAP cuts – updated (opens in a new tab)
Visualizations Jun 24, 2025
 View Chart
(opens in a new tab)
View Chart
(opens in a new tab)
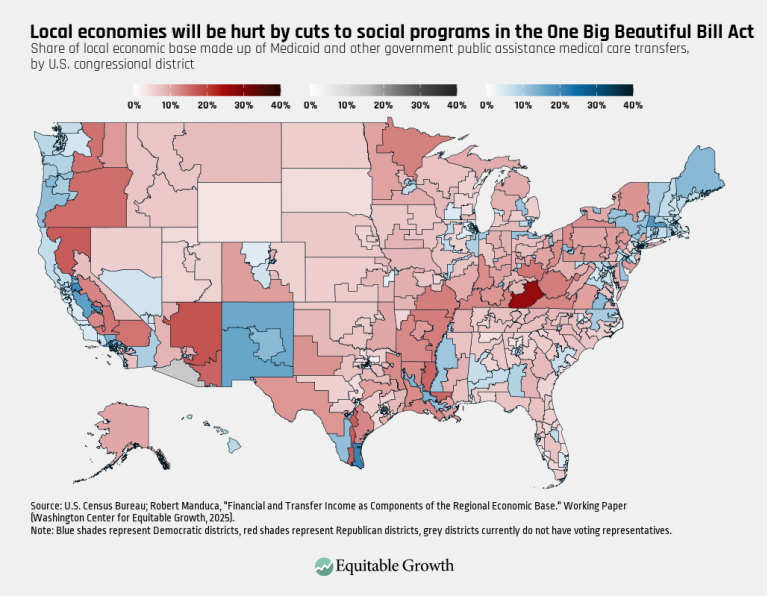
Local economies will be hurt by cuts to social programs in the One Big Beautiful Bill Act (opens in a new tab)
Visualizations Jun 24, 2025
 View Chart
(opens in a new tab)
View Chart
(opens in a new tab)
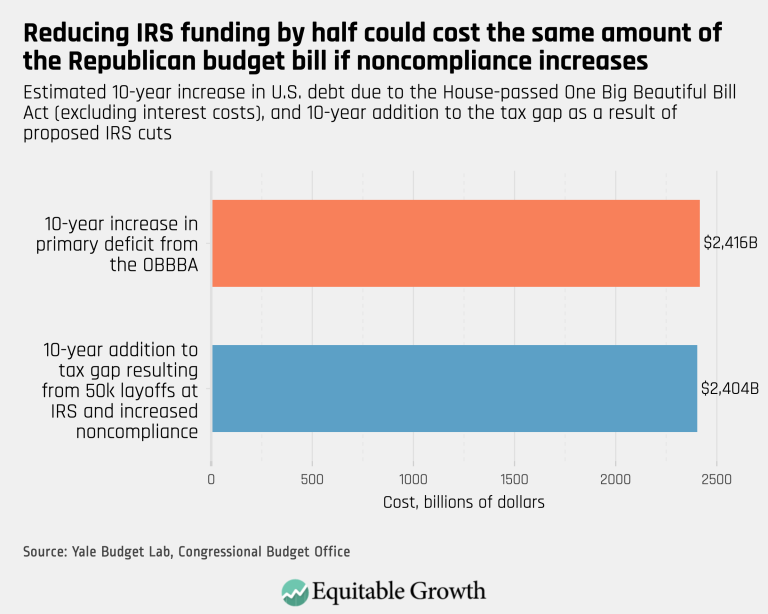
Reducing IRS funding by half could cost the same amount of the Republican budget bill in noncompliance increases (opens in a new tab)
Visualizations Jun 23, 2025
 View Chart
(opens in a new tab)
View Chart
(opens in a new tab)
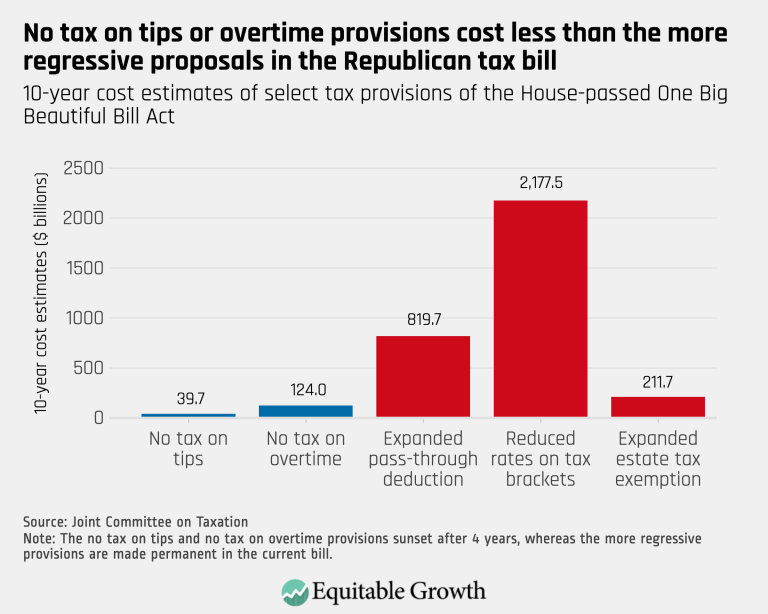
No tax on tips or overtime provisions cost less than the more regressive proposals in the Republican tax bill (opens in a new tab)
Visualizations Jun 23, 2025
 View Chart
(opens in a new tab)
View Chart
(opens in a new tab)
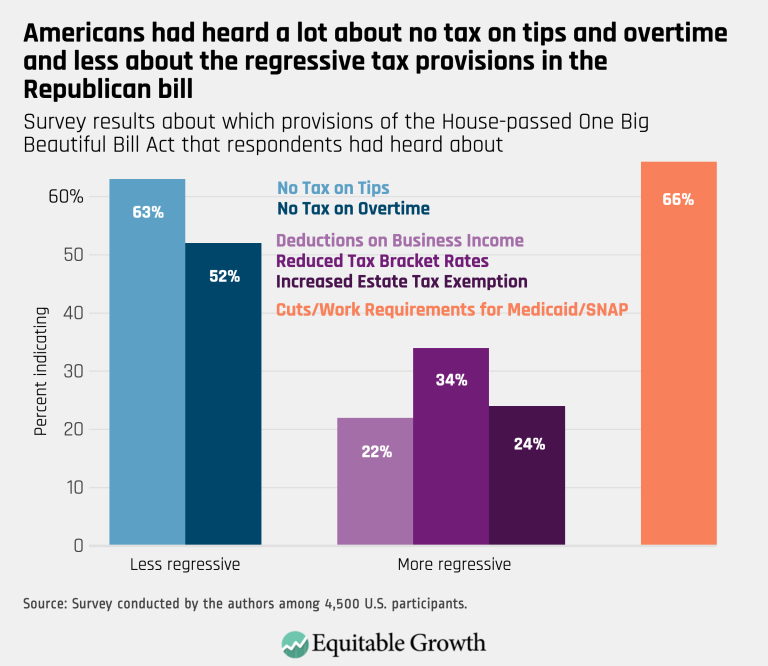
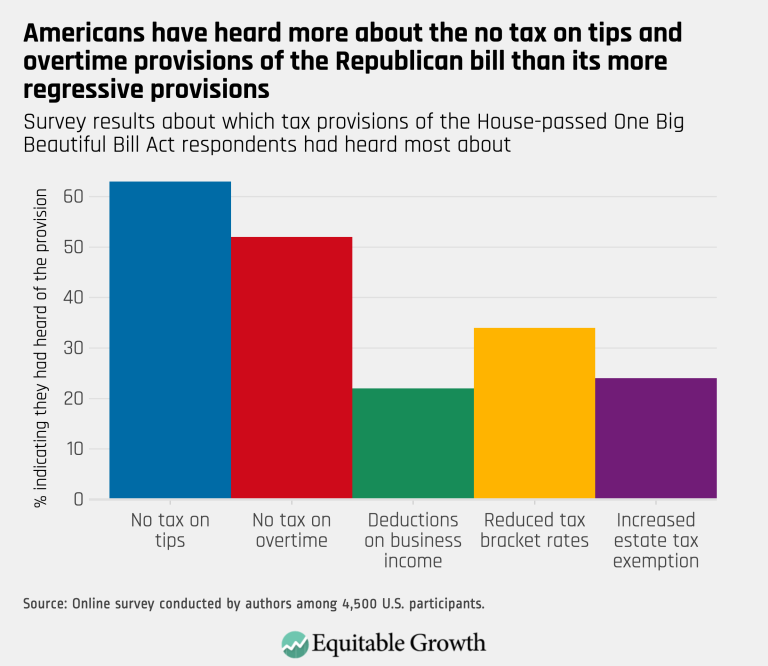
Americans have heard more about the no tax on tips and overtime provisions of the Republican bill than its more regressive provisions (opens in a new tab)
Visualizations Jun 23, 2025
 View Chart
(opens in a new tab)
View Chart
(opens in a new tab)
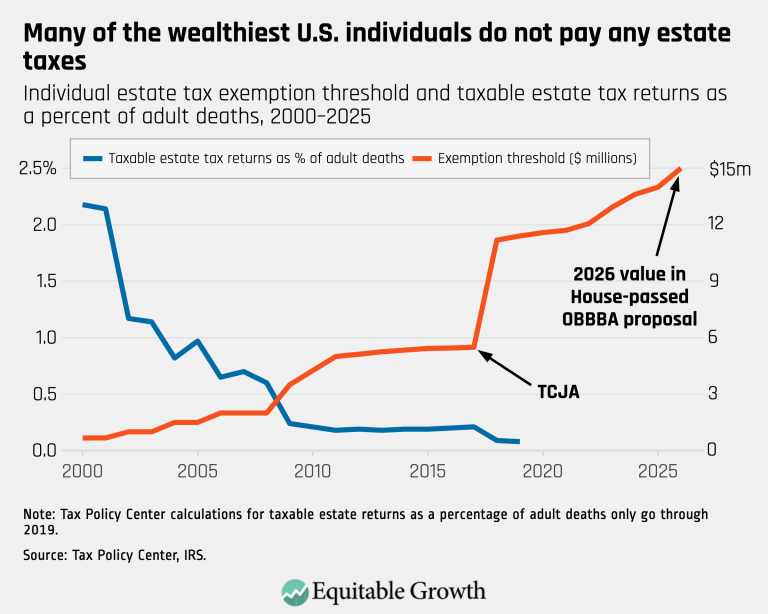
Many of the wealthiest U.S. individuals do not pay any estate taxes (opens in a new tab)
Visualizations Jun 23, 2025
 View Chart
(opens in a new tab)
View Chart
(opens in a new tab)
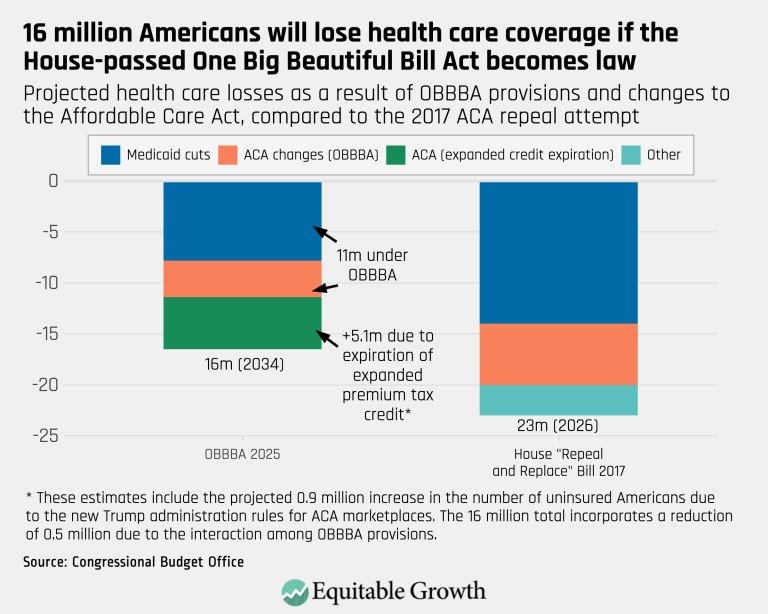
16 million Americans will lose health care coverage if the House-passed One Big Beautiful Bill Act becomes law (opens in a new tab)
Visualizations Jun 23, 2025
 View Chart
(opens in a new tab)
View Chart
(opens in a new tab)
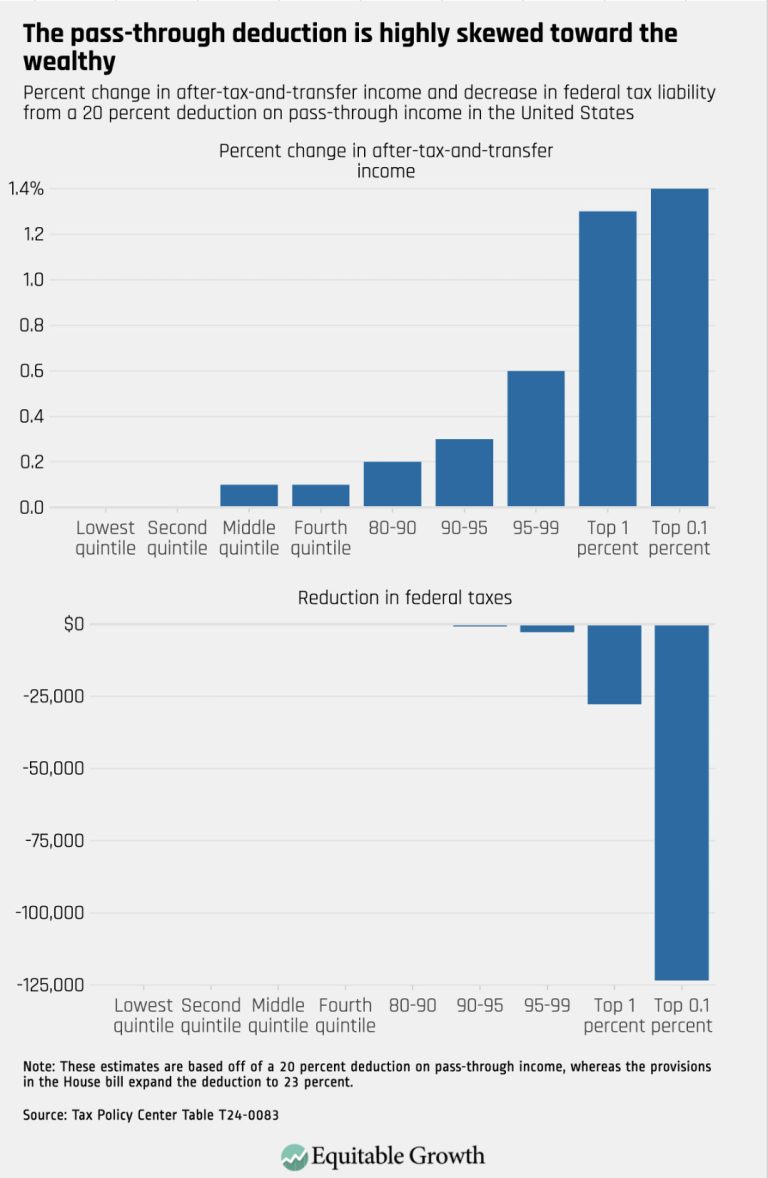
The pass-through deduction is highly skewed toward the wealthy (opens in a new tab)
Visualizations Jun 20, 2025
 View Chart
(opens in a new tab)
View Chart
(opens in a new tab)
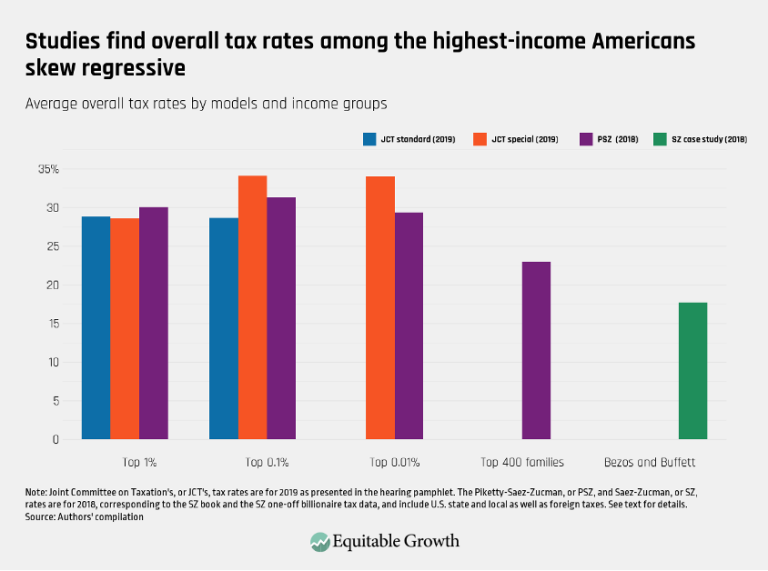
Studies find overall tax rates among the highest-income Americans skew regressive (opens in a new tab)
Visualizations Jun 10, 2025
 View Chart
(opens in a new tab)
View Chart
(opens in a new tab)
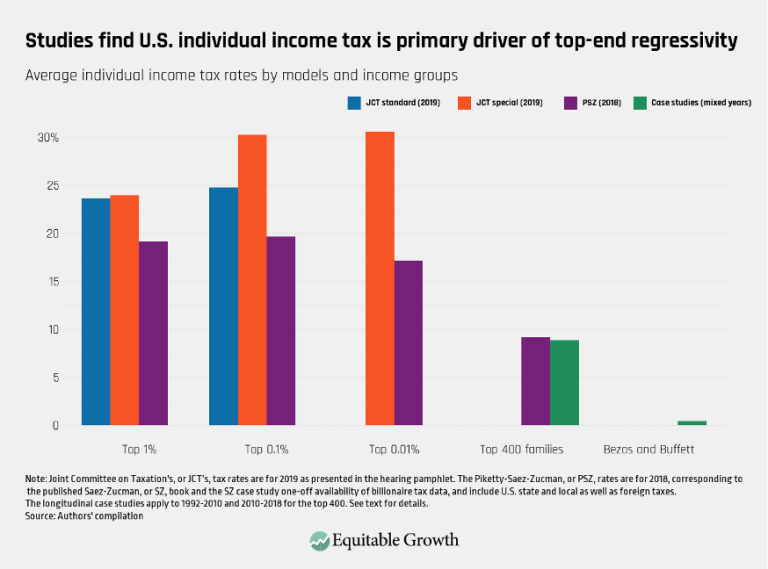
Studies find U.S. individual income tax is primary driver of top-end regressivity (opens in a new tab)
Visualizations Jun 10, 2025
 View Chart
(opens in a new tab)
View Chart
(opens in a new tab)
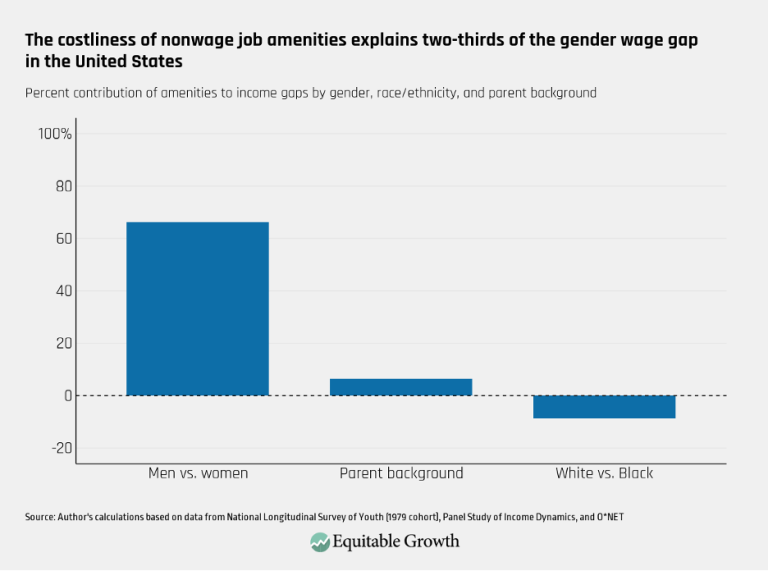
The costliness of nonwage job amenities explains two-thirds of the gender wage gap in the United States (opens in a new tab)
Visualizations Jun 10, 2025
 View Chart
(opens in a new tab)
View Chart
(opens in a new tab)
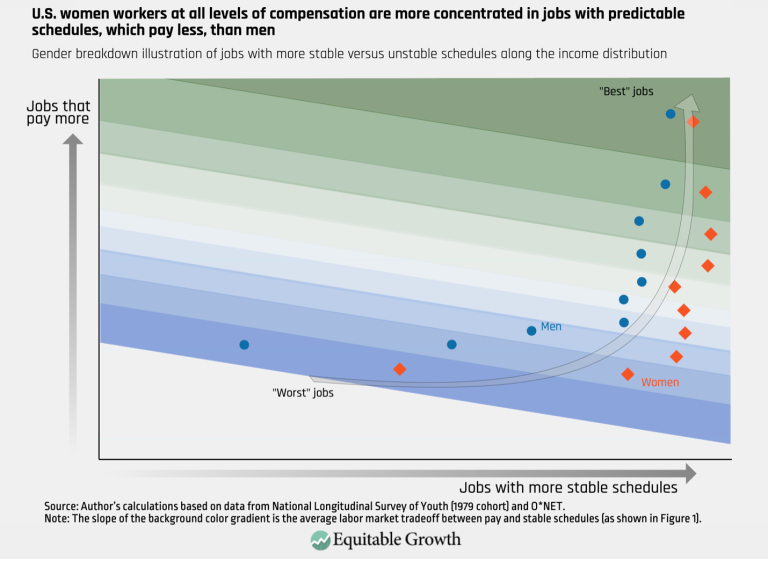
U.S. women workers at all levels of compensation are more concentrated in jobs with predictable schedules, which pay less, than men (opens in a new tab)
Visualizations Jun 10, 2025
 View Chart
(opens in a new tab)
View Chart
(opens in a new tab)
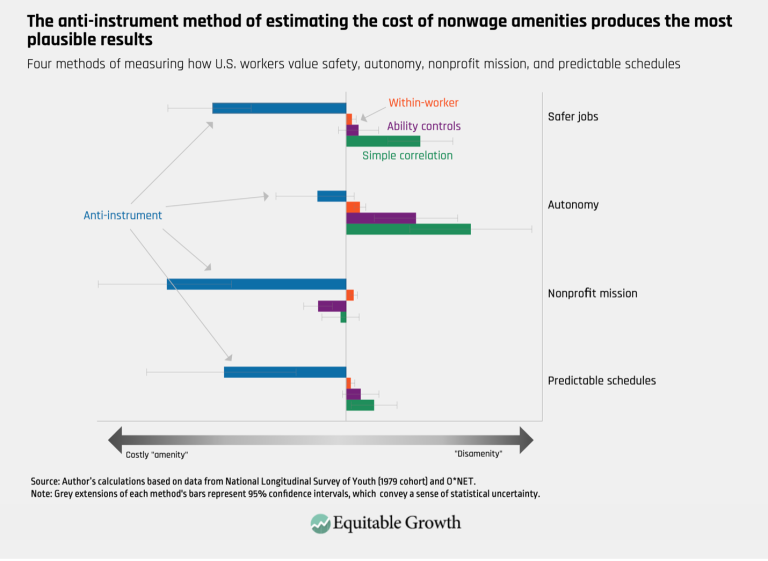
The anti-instrument method of estimating the cost of nonwage amenities produces the most plausible results (opens in a new tab)
Visualizations Jun 10, 2025
 View Chart
(opens in a new tab)
View Chart
(opens in a new tab)
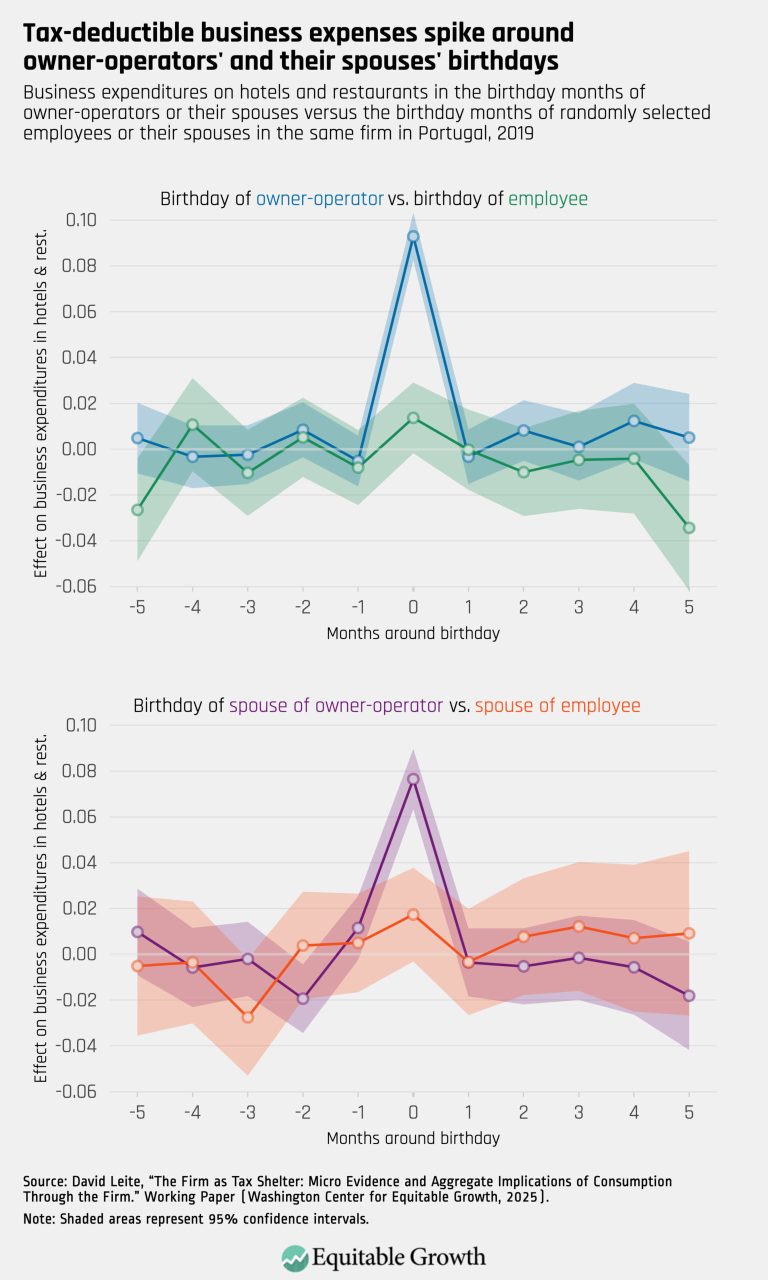
Tax-deductible business expenses spike around owner-operators’ and their spouses’ birthdays – updated (opens in a new tab)
Visualizations Jun 5, 2025
 View Chart
(opens in a new tab)
View Chart
(opens in a new tab)
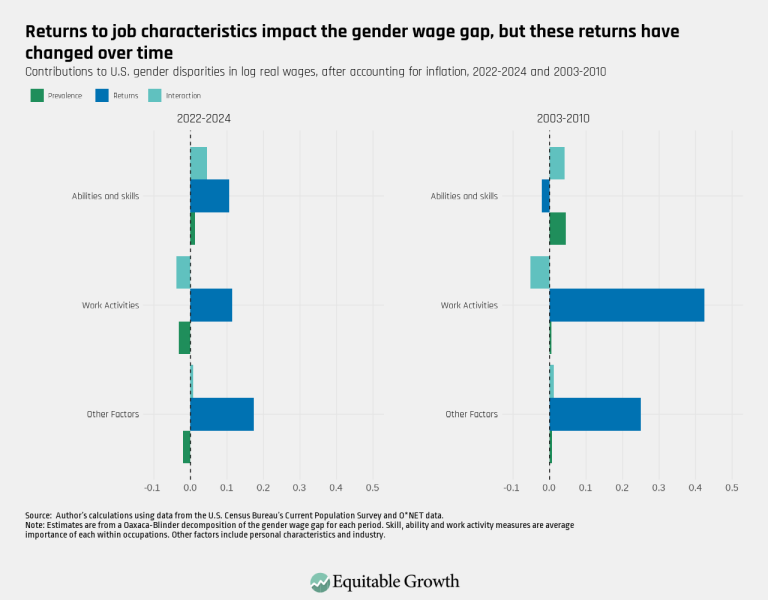
Returns to job characteristics impact the gender wage gap, but these returns have changed over time (opens in a new tab)
Visualizations Jun 4, 2025
 View Chart
(opens in a new tab)
View Chart
(opens in a new tab)
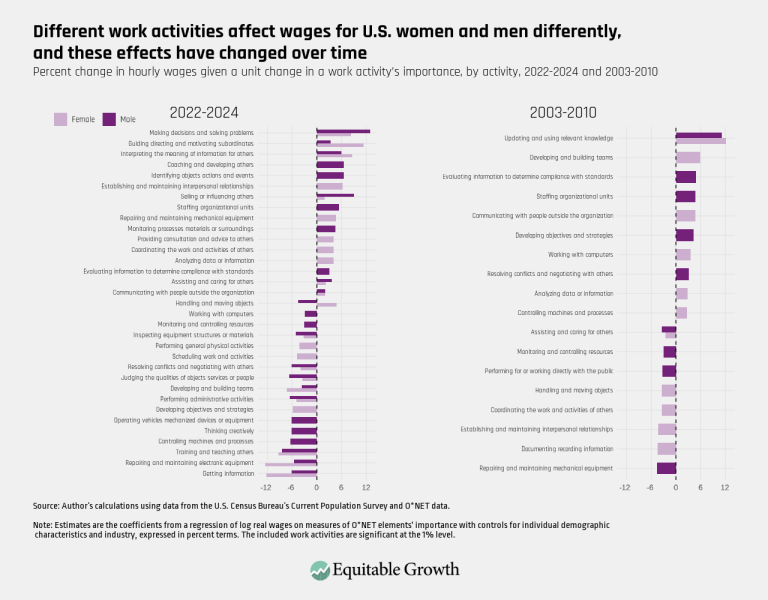
Different work activities affect wages for U.S. women and men differently, and these effects have changed over time (opens in a new tab)
Visualizations Jun 4, 2025
 View Chart
(opens in a new tab)
View Chart
(opens in a new tab)
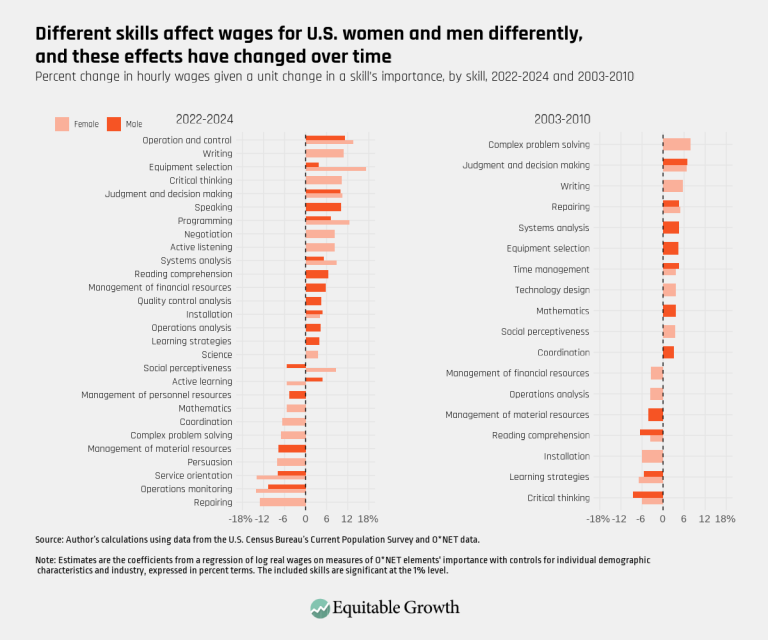
Different skills affect wages for U.S. women and men differently, and these effects have changed over time (opens in a new tab)
Visualizations Jun 4, 2025
 View Chart
(opens in a new tab)
View Chart
(opens in a new tab)
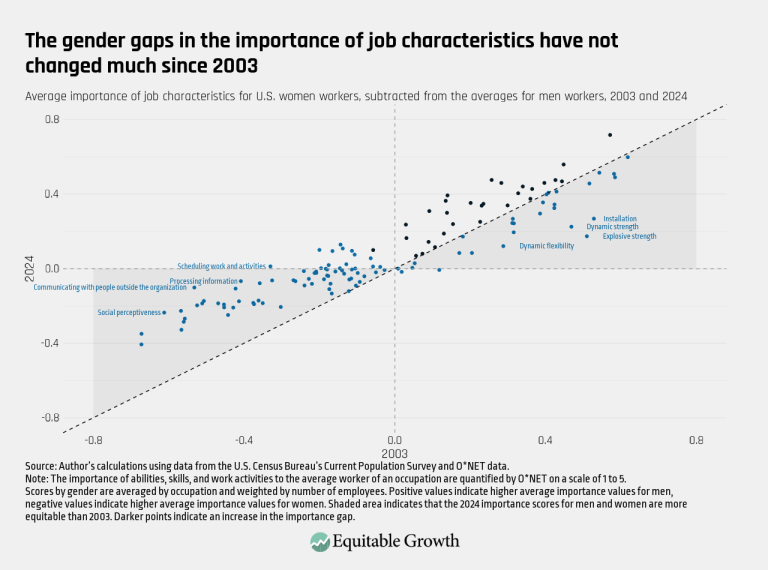
The gender gaps in the importance of job characteristics have not changed much since 2003 (opens in a new tab)
Visualizations Jun 4, 2025
 View Chart
(opens in a new tab)
View Chart
(opens in a new tab)
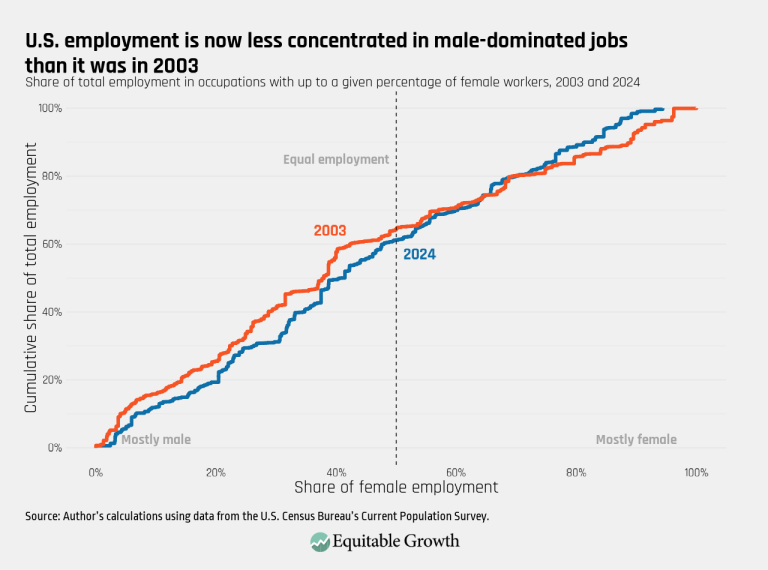
U.S. employment is now less concentrated in male-dominated jobs than it was in 2003 (opens in a new tab)
Visualizations Jun 4, 2025
 View Chart
(opens in a new tab)
View Chart
(opens in a new tab)
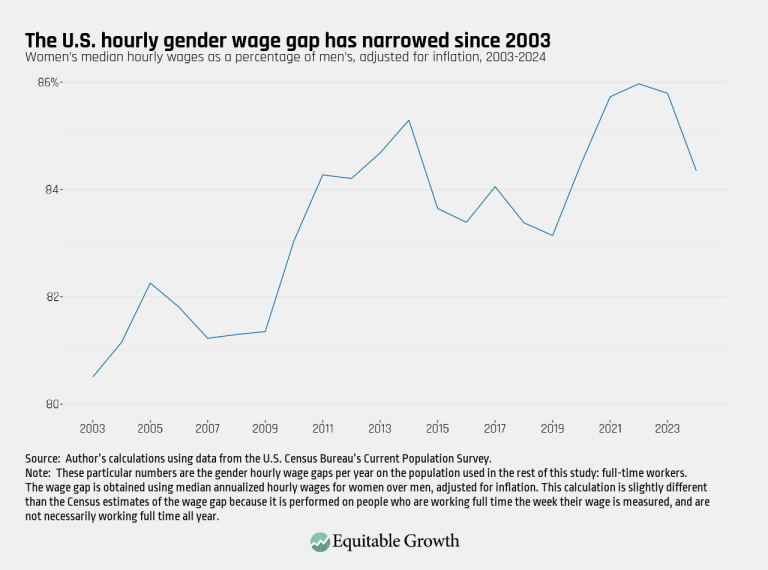
The U.S. hourly gender wage gap has narrowed since 2003 – updated (opens in a new tab)
Visualizations Jun 4, 2025
 View Chart
(opens in a new tab)
View Chart
(opens in a new tab)
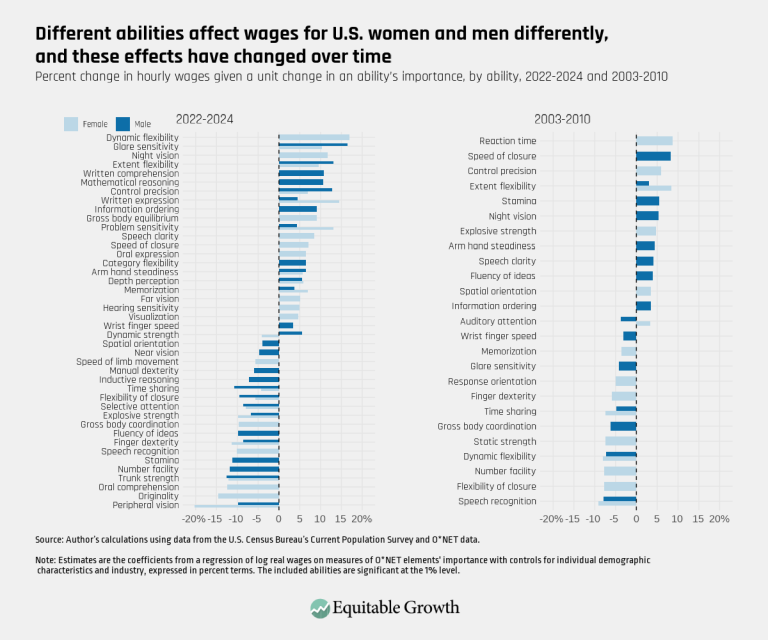
Different abilities affect wages for U.S. women and men differently, and these effects have changed over time – updated (opens in a new tab)
Visualizations Jun 4, 2025
 View Chart
(opens in a new tab)
View Chart
(opens in a new tab)
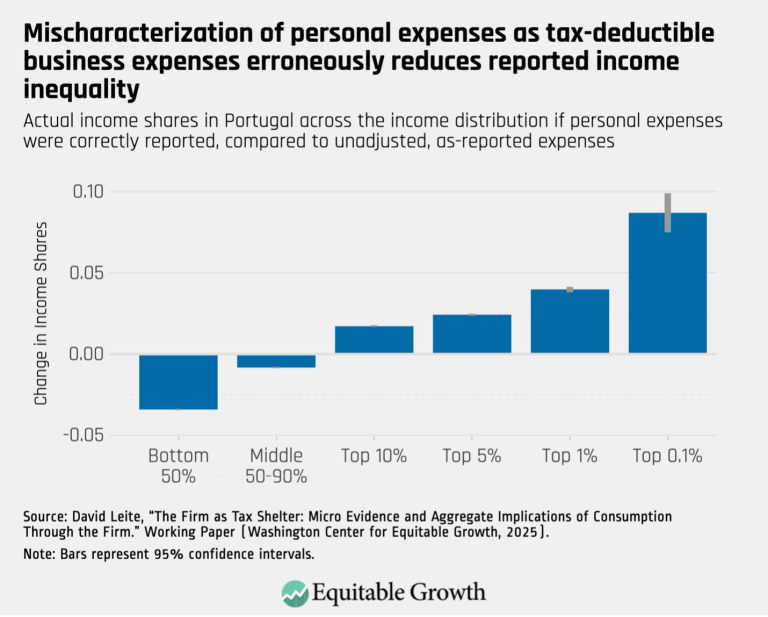
Mischaracterization of personal expenses as tax-deductible business expenses erroneously reduces reported income inequality (opens in a new tab)
Visualizations May 22, 2025
 View Chart
(opens in a new tab)
View Chart
(opens in a new tab)
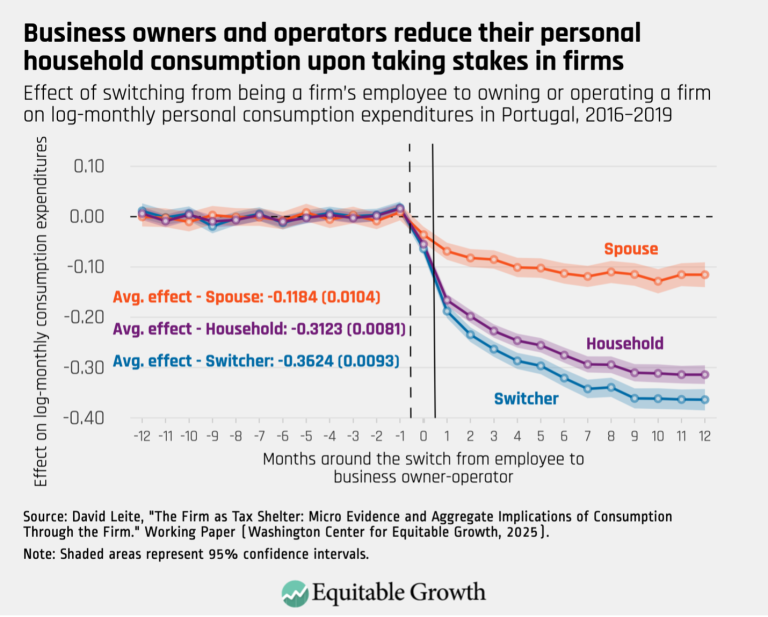
Business owners and operators reduce their personal household consumption upon taking stakes in firms (opens in a new tab)
Visualizations May 21, 2025
 View Chart
(opens in a new tab)
View Chart
(opens in a new tab)
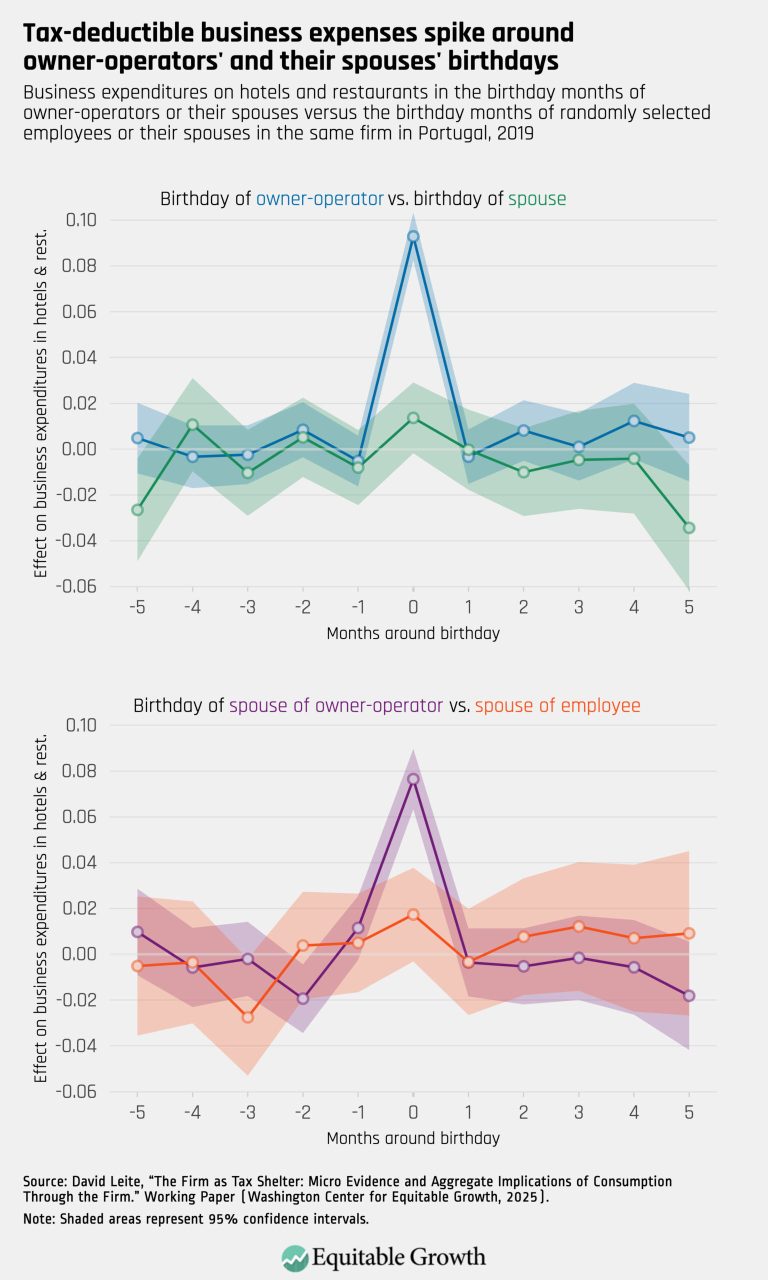
Tax-deductible business expenses spike around owner-operators’ and their spouses’ birthdays (opens in a new tab)
Visualizations May 21, 2025
 View Chart
(opens in a new tab)
View Chart
(opens in a new tab)
rinz fig 1 (opens in a new tab)
Visualizations May 9, 2025
 View Chart
(opens in a new tab)
View Chart
(opens in a new tab)
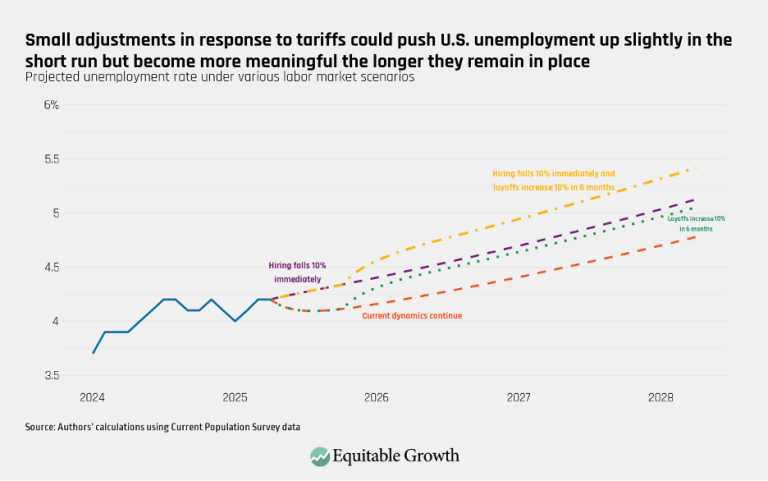
Small adjustments in response to tariffs could push U.S. unemployment up slightly in the short run but become more meaningful the longer they remain in place (opens in a new tab)
Visualizations May 9, 2025
 View Chart
(opens in a new tab)
View Chart
(opens in a new tab)
rinz fig 3 (opens in a new tab)
Visualizations May 9, 2025
 View Chart
(opens in a new tab)
View Chart
(opens in a new tab)
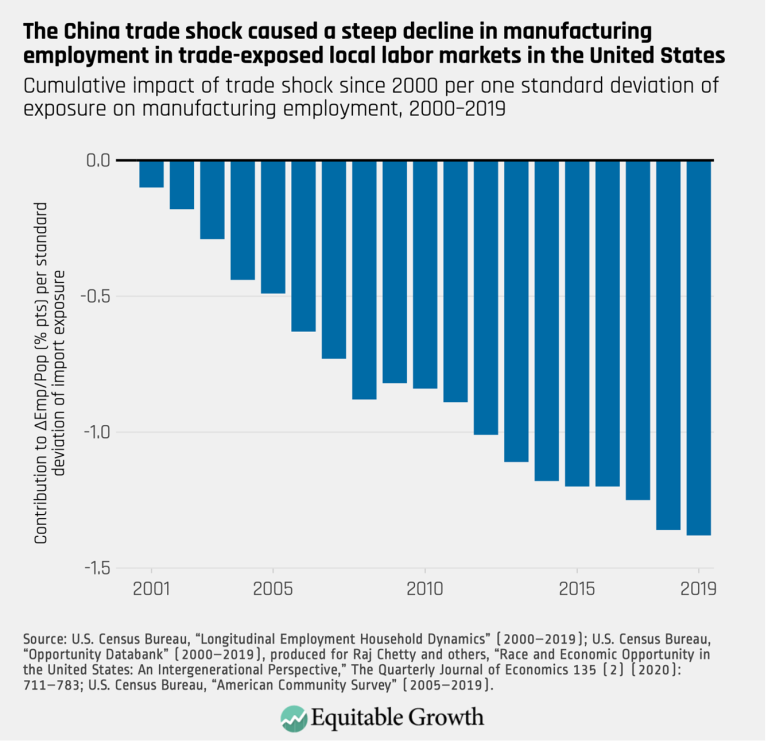
The China trade shock caused a steep decline in manufacturing employment in trade-exposed local labor markets in the United States (opens in a new tab)
Visualizations May 8, 2025
 View Chart
(opens in a new tab)
View Chart
(opens in a new tab)
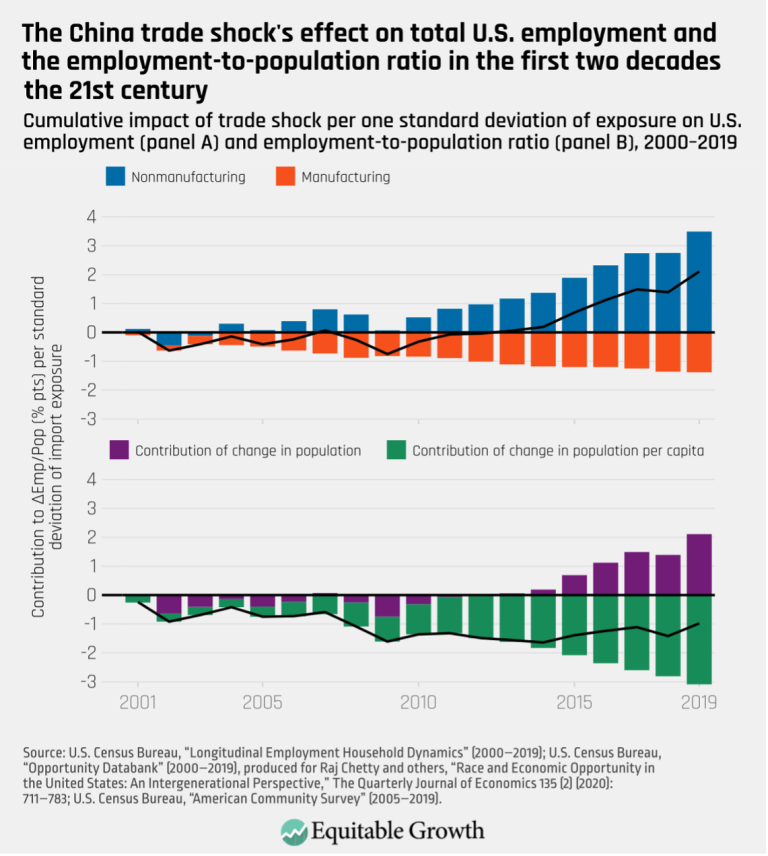
The China trade shock’s effect on total U.S. employment and the employment-to-population ratio in the first two decades the 21st century (opens in a new tab)
Visualizations May 8, 2025
 View Chart
(opens in a new tab)
View Chart
(opens in a new tab)
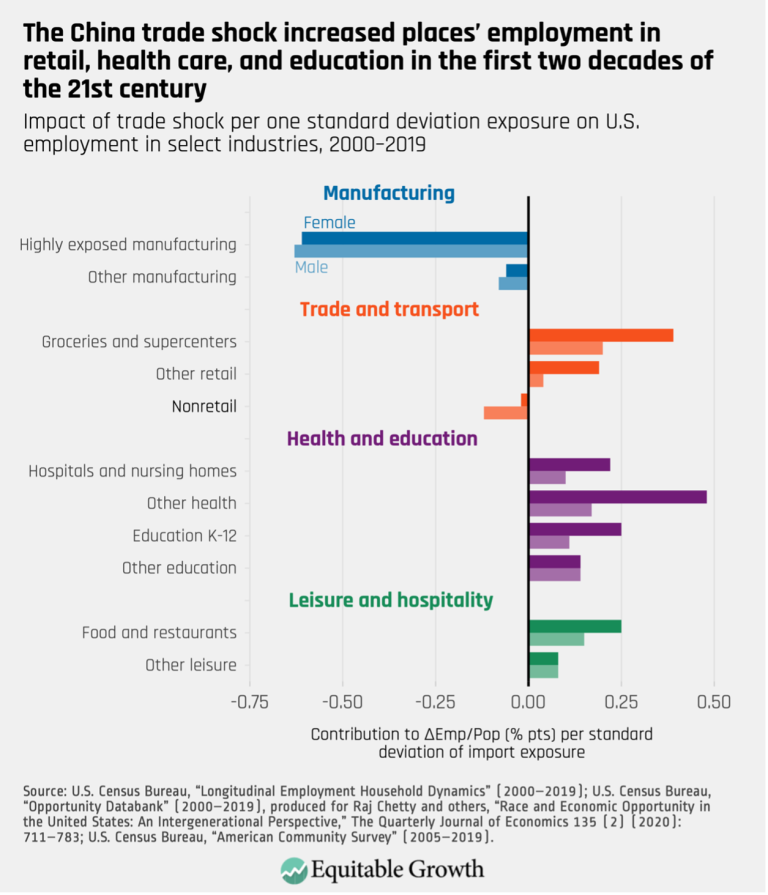
The China trade shock increased places’ employment in retail, health care, and education in the first two decades of the 21st century (opens in a new tab)
Visualizations May 8, 2025
 View Chart
(opens in a new tab)
View Chart
(opens in a new tab)
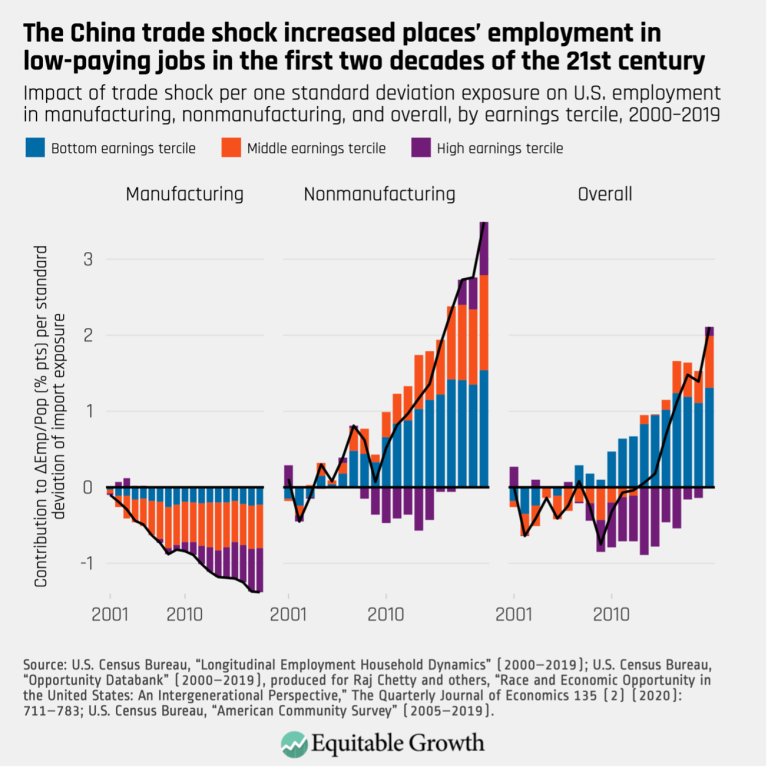
The China trade shock increased places’ employment in low-paying jobs in the first two decades of the 21st century (opens in a new tab)
Visualizations May 8, 2025
 View Chart
(opens in a new tab)
View Chart
(opens in a new tab)
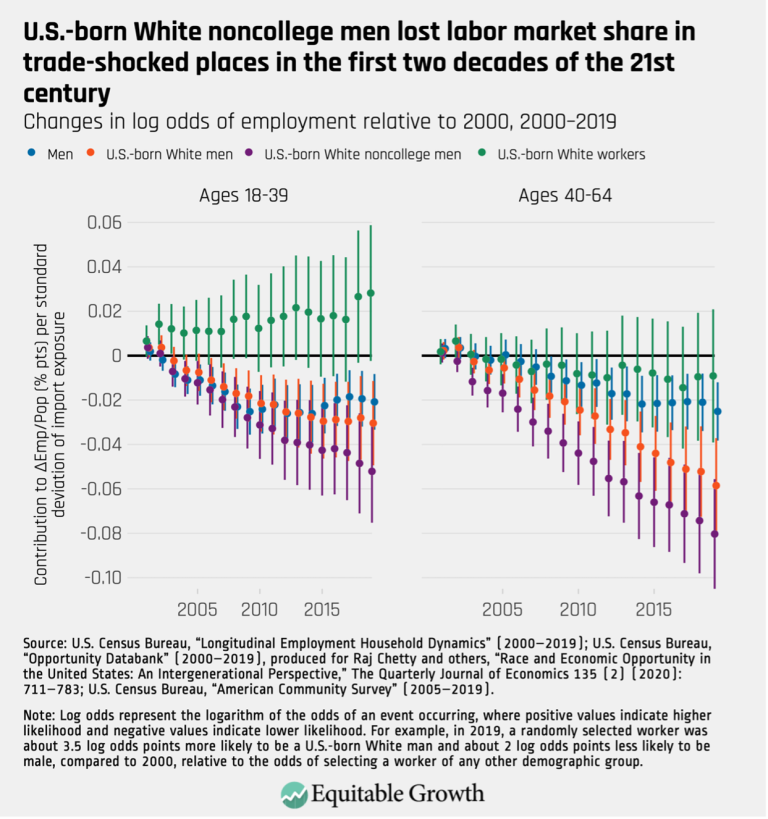
U.S.-born White noncollege men lost labor market share in trade-shocked places in the first two decades of the 21st century (opens in a new tab)
Visualizations May 8, 2025
 View Chart
(opens in a new tab)
View Chart
(opens in a new tab)
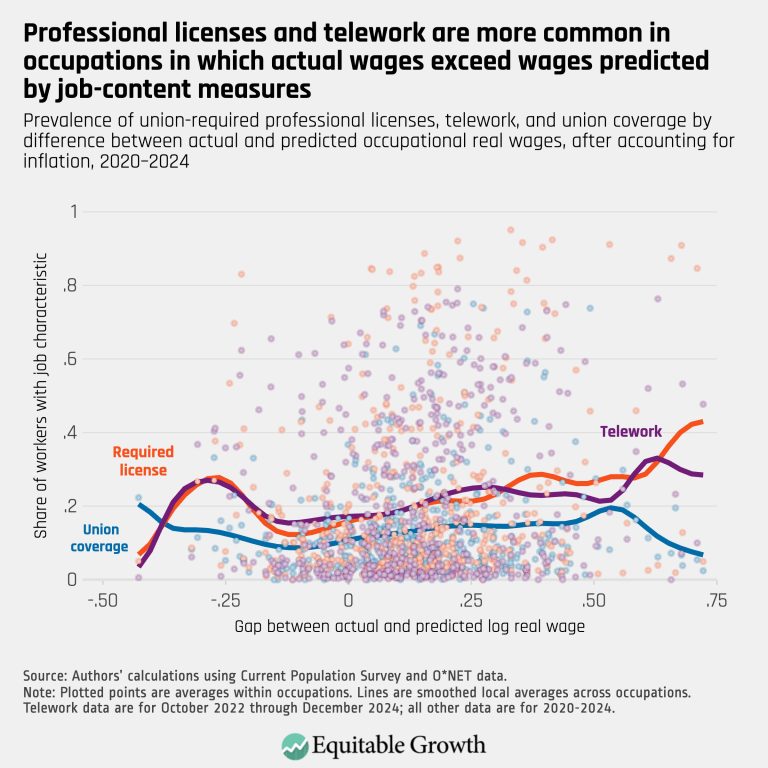
Professional licenses and telework are more common in occupations in which actual wages exceed wages predicted by job-content measures (opens in a new tab)
Visualizations May 6, 2025
 View Chart
(opens in a new tab)
View Chart
(opens in a new tab)
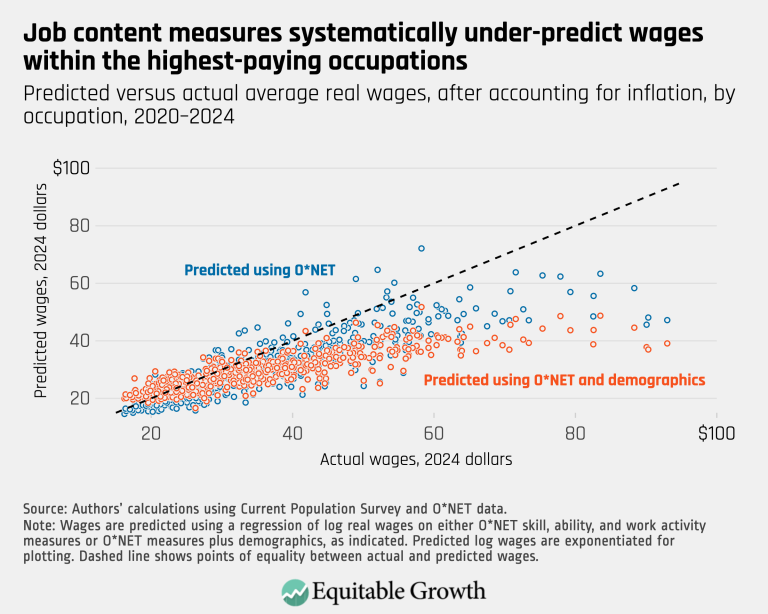
playfair (2) (opens in a new tab)
Visualizations May 6, 2025
 View Chart
(opens in a new tab)
View Chart
(opens in a new tab)
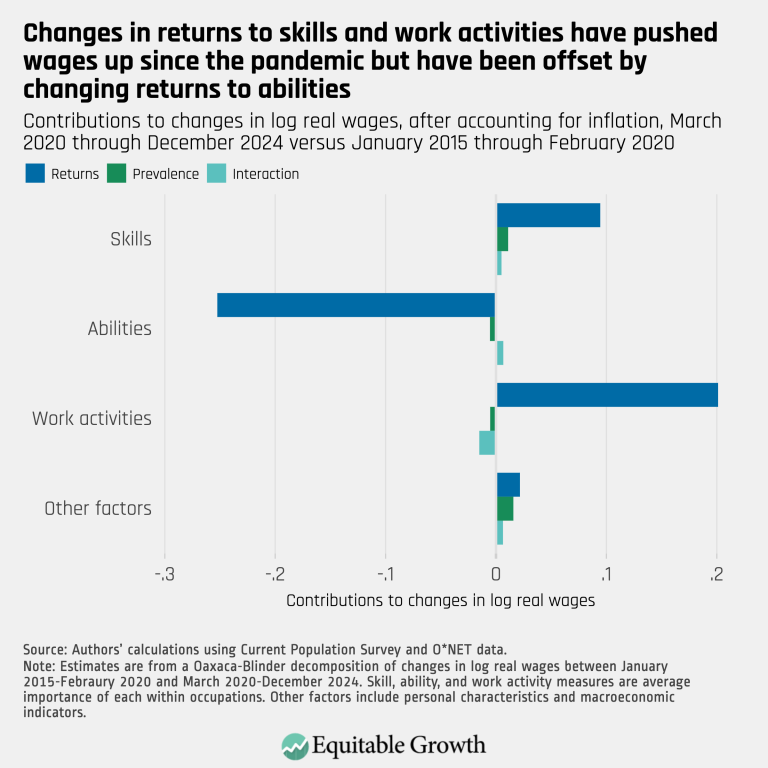
playfair (opens in a new tab)
Visualizations May 6, 2025
 View Chart
(opens in a new tab)
View Chart
(opens in a new tab)
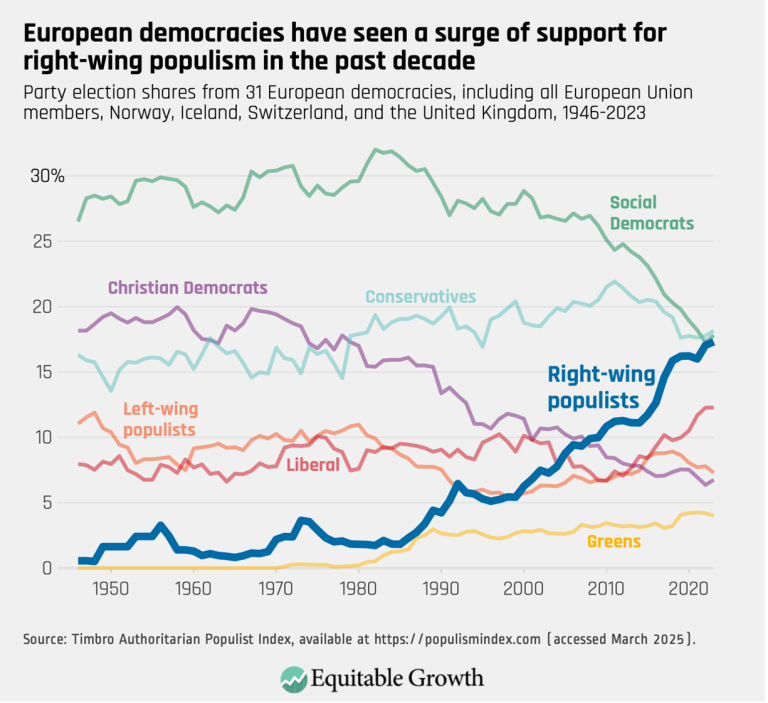
European democracies have seen a surge of support for right-wing populism in the past decade (opens in a new tab)
Visualizations Apr 29, 2025
 View Chart
(opens in a new tab)
View Chart
(opens in a new tab)
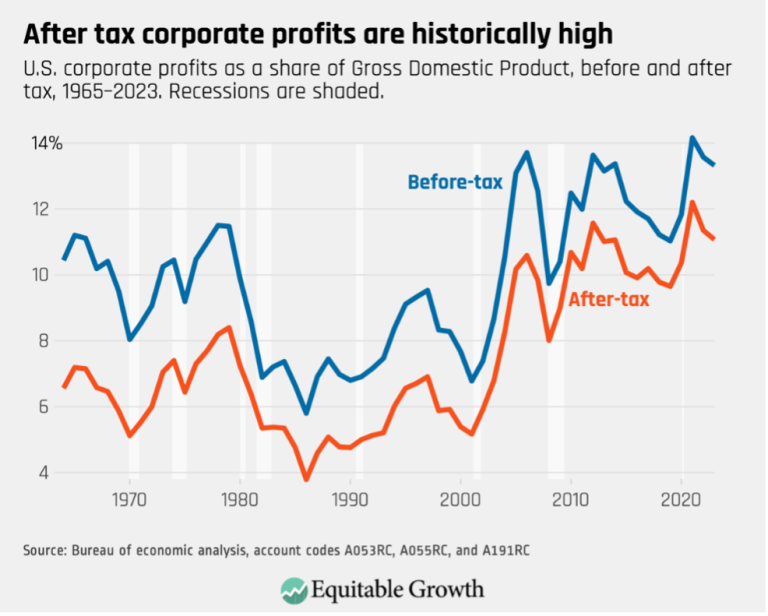
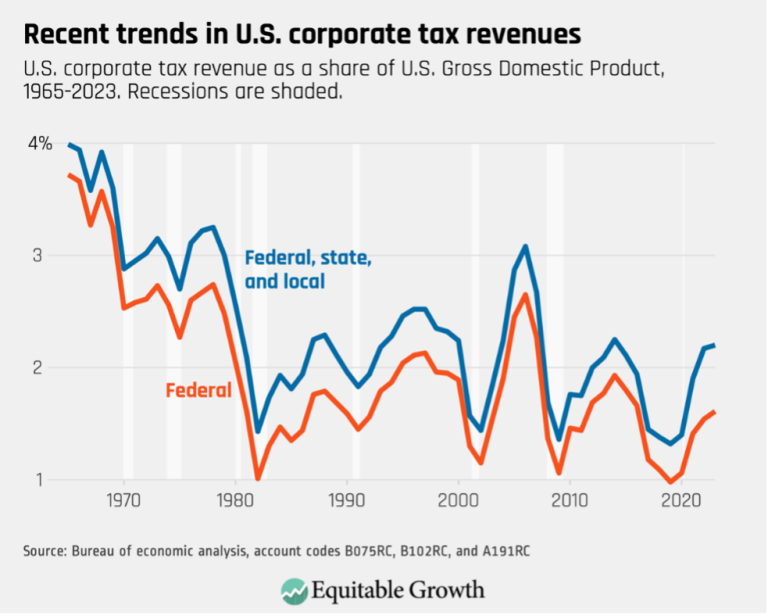
After tax corporate profits are historically high (opens in a new tab)
Visualizations Apr 3, 2025
 View Chart
(opens in a new tab)
View Chart
(opens in a new tab)
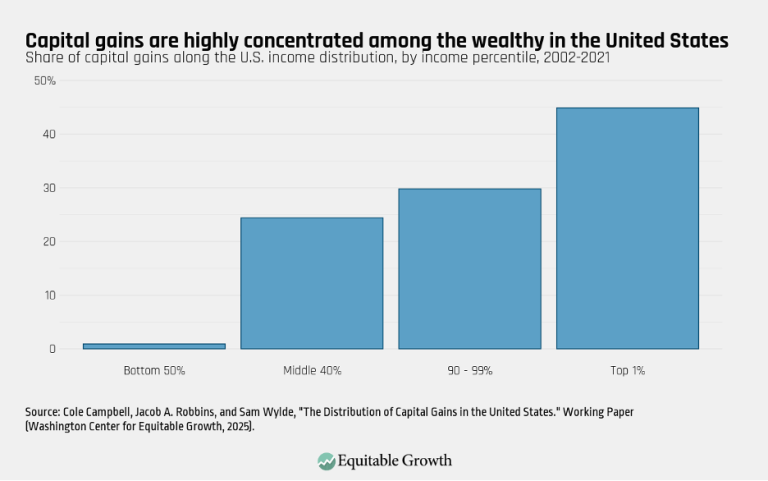
Capital gains are highly concentrated among the wealthy in the United States (opens in a new tab)
Visualizations Feb 26, 2025
 View Chart
(opens in a new tab)
View Chart
(opens in a new tab)
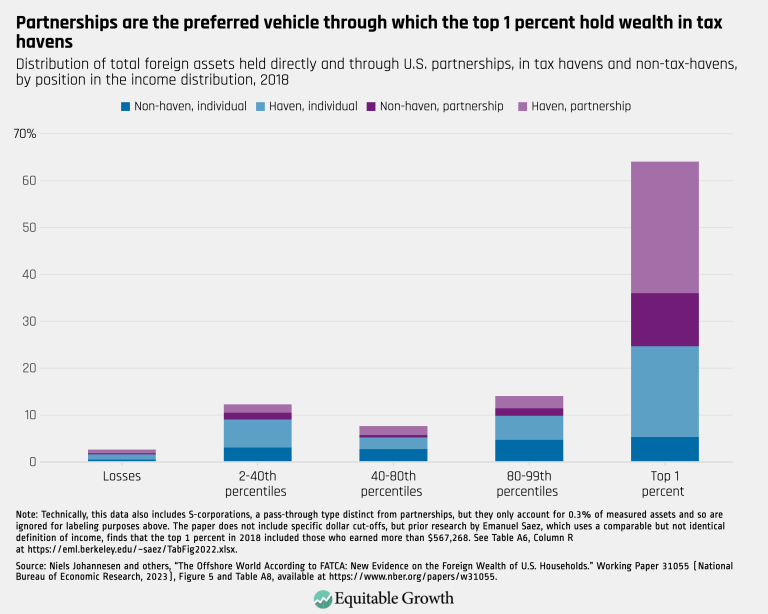
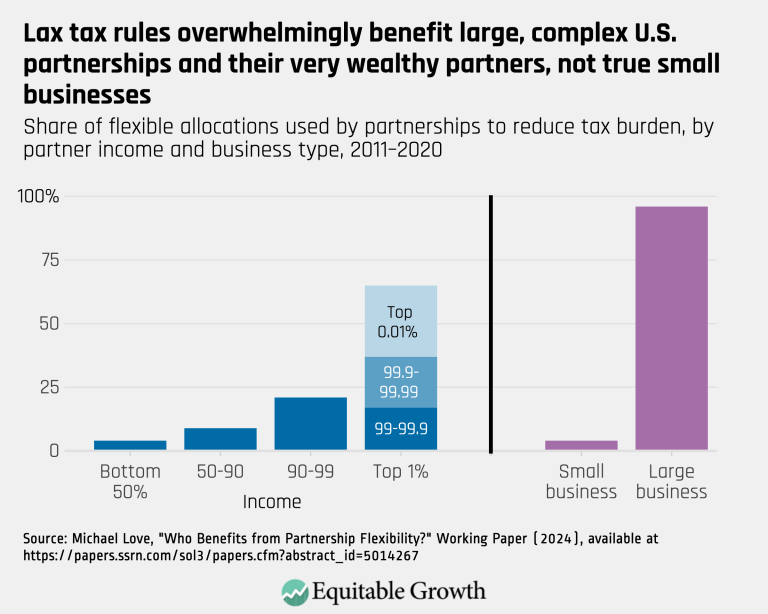
Partnerships are the preferred vehicle through which the top 1 percent hold wealth in tax havens (opens in a new tab)
Visualizations Feb 11, 2025
 View Chart
(opens in a new tab)
View Chart
(opens in a new tab)
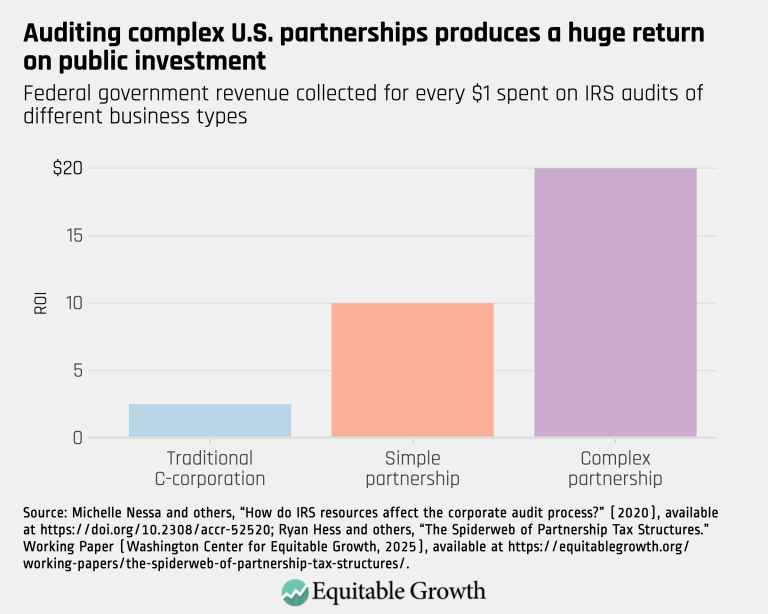
Auditing complex U.S. partnerships produces a huge return on public investment (opens in a new tab)
Visualizations Feb 11, 2025
 View Chart
(opens in a new tab)
View Chart
(opens in a new tab)
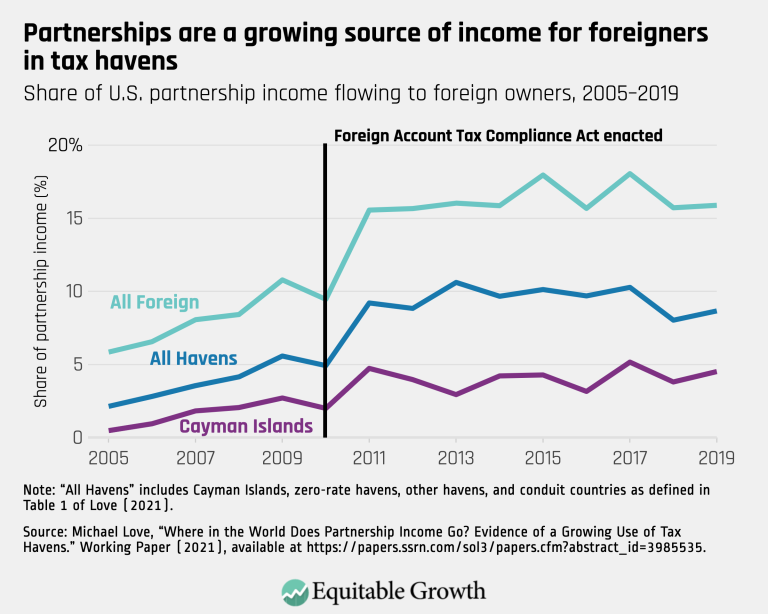
Partnerships are a growing source of income for foreigners in tax havens (opens in a new tab)
Visualizations Feb 11, 2025
 View Chart
(opens in a new tab)
View Chart
(opens in a new tab)
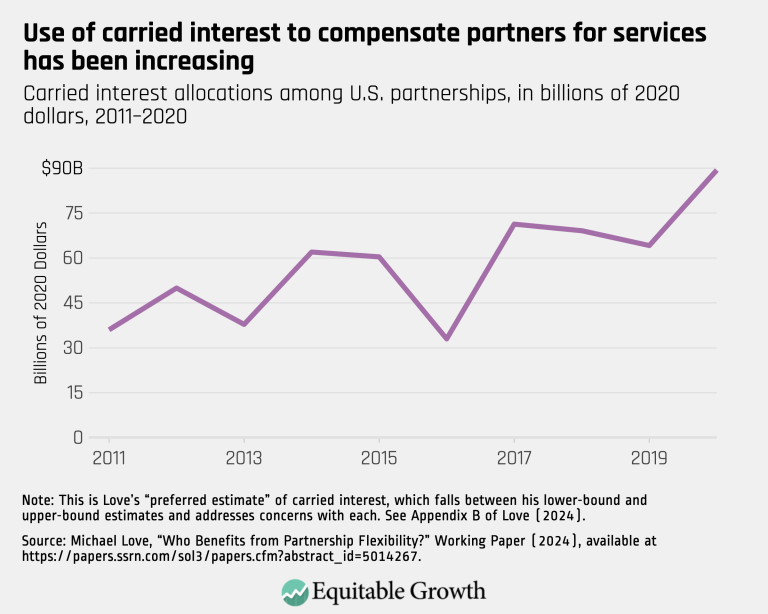
Use of carried interest to compensate partners for services has been increasing (opens in a new tab)
Visualizations Feb 11, 2025
 View Chart
(opens in a new tab)
View Chart
(opens in a new tab)
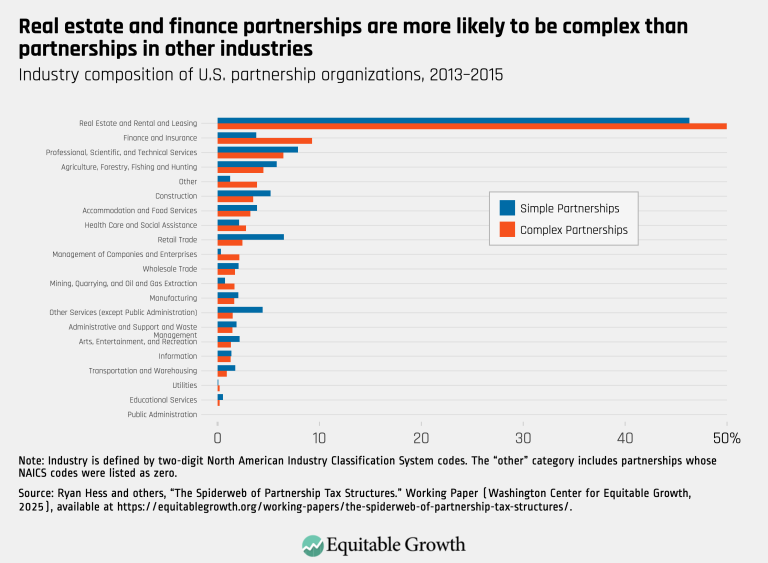
Real estate and finance partnerships are more likely to be complex than partnerships in other industries (opens in a new tab)
Visualizations Feb 11, 2025
 View Chart
(opens in a new tab)
View Chart
(opens in a new tab)
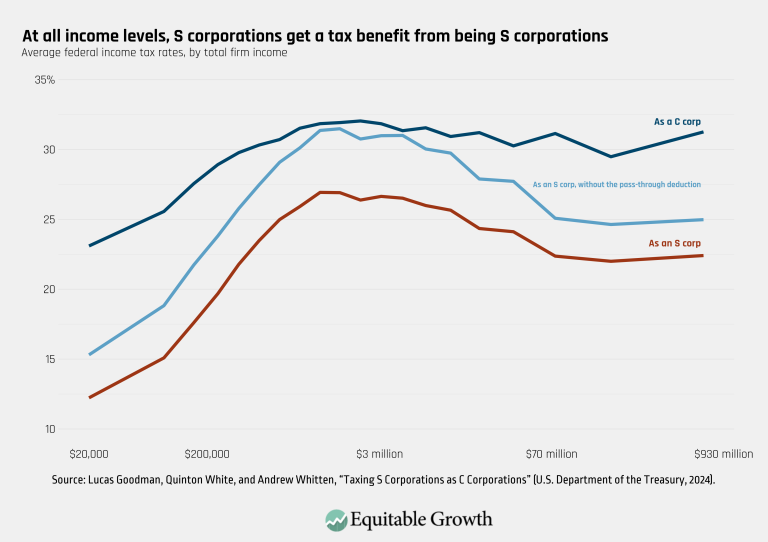
At all income levels, S corporations get a tax benefit from being S corporations (opens in a new tab)
Visualizations Dec 16, 2024
 View Chart
(opens in a new tab)
View Chart
(opens in a new tab)
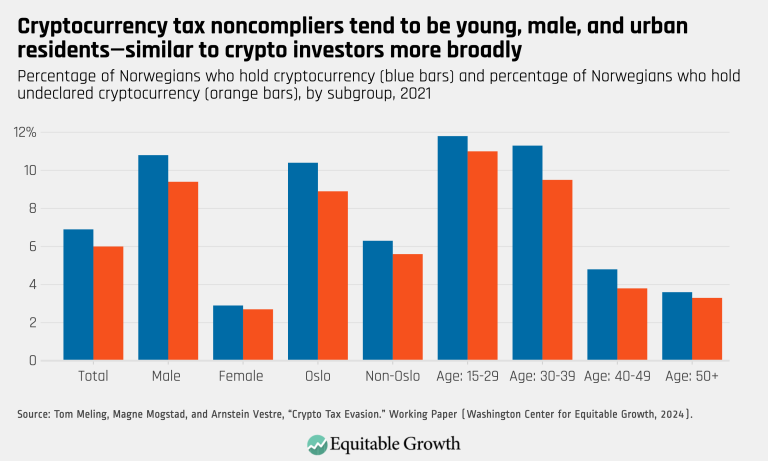
Cryptocurrency tax noncompliers tend to be young, male, and urban residents-similar to crypto investors more broadly (opens in a new tab)
Visualizations Nov 20, 2024
 View Chart
(opens in a new tab)
View Chart
(opens in a new tab)
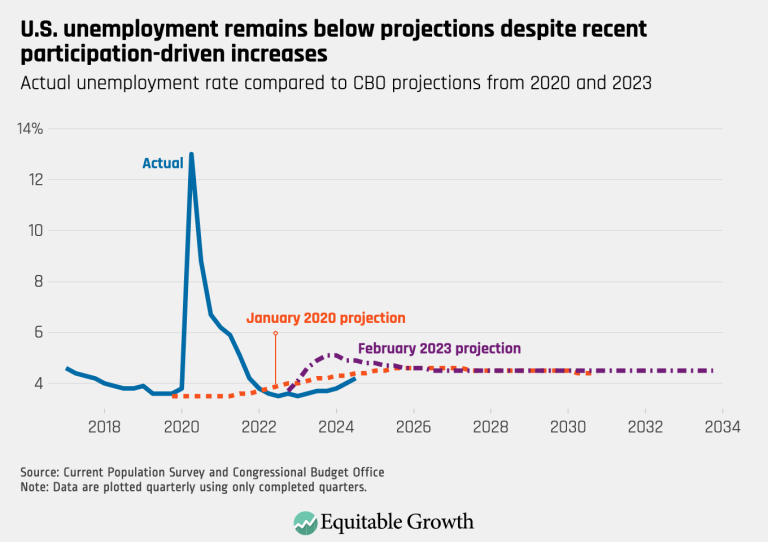
U.S. unemployment remains below projections despite recent participation-driven increases (opens in a new tab)
Visualizations Nov 5, 2024
 View Chart
(opens in a new tab)
View Chart
(opens in a new tab)
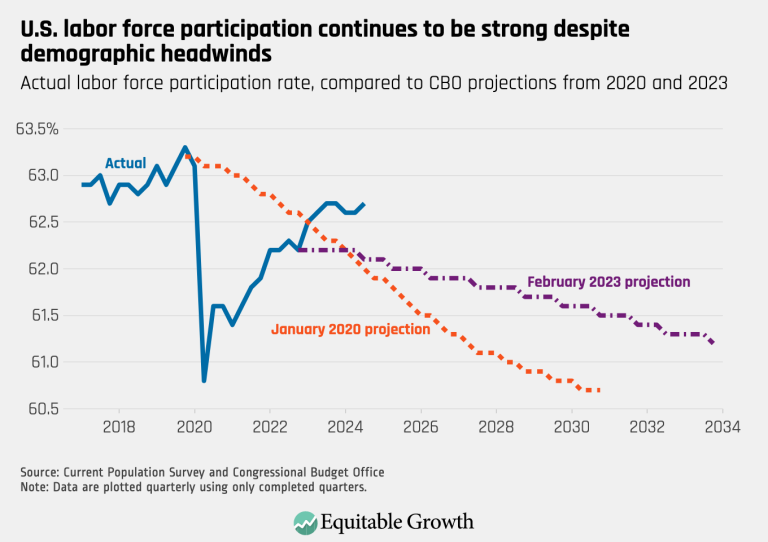
U.S. labor force participation continues to be strong despite demographic headwinds (opens in a new tab)
Visualizations Nov 5, 2024
 View Chart
(opens in a new tab)
View Chart
(opens in a new tab)
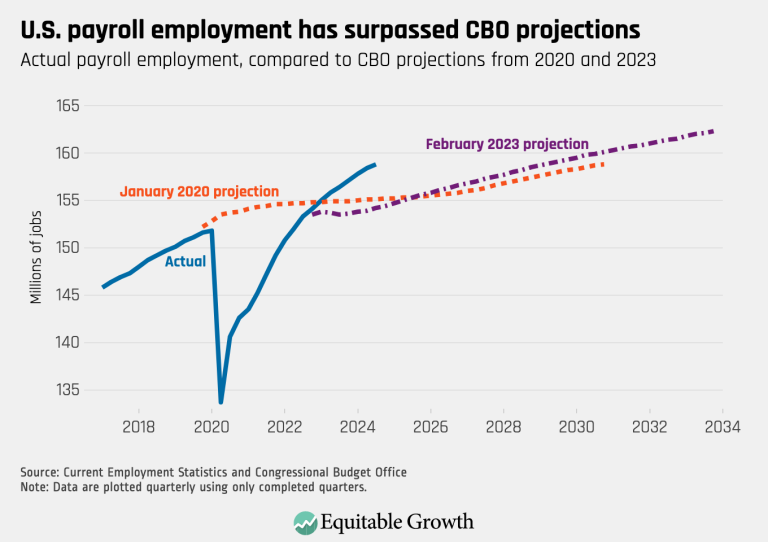
U.S. payroll employment has surpassed CBO projections (opens in a new tab)
Visualizations Nov 5, 2024
 View Chart
(opens in a new tab)
View Chart
(opens in a new tab)
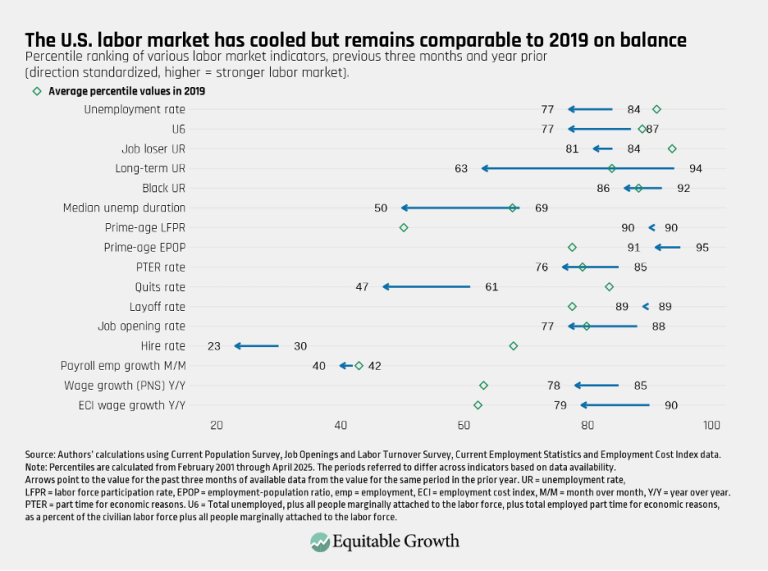
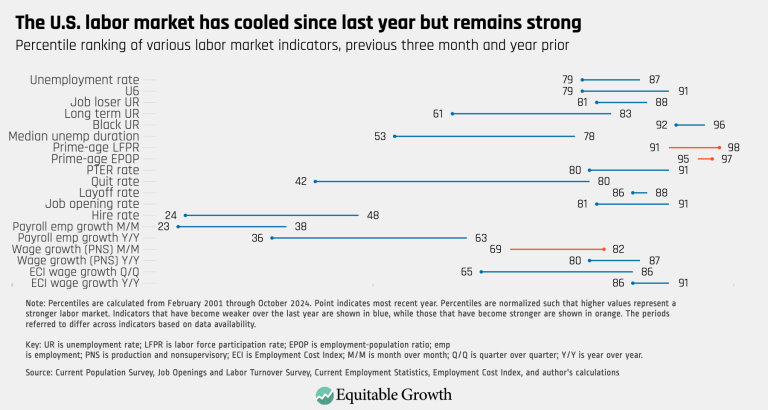
The U.S. labor market has cooled since last year but remains strong (opens in a new tab)
Visualizations Nov 4, 2024
 View Chart
(opens in a new tab)
View Chart
(opens in a new tab)
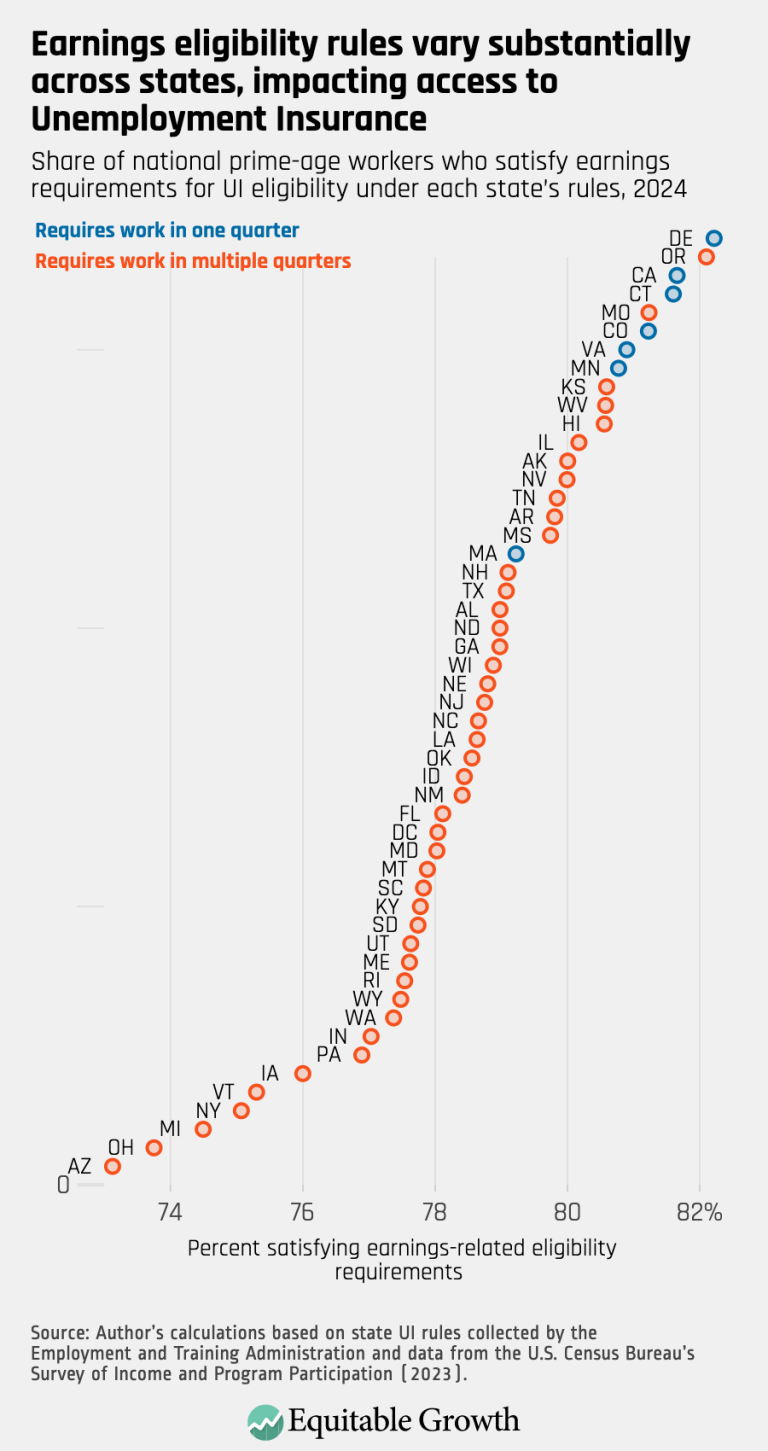
Earnings eligibility rules vary substantially across states, impacting access to Unemployment Insurance (opens in a new tab)
Visualizations Oct 24, 2024
 View Chart
(opens in a new tab)
View Chart
(opens in a new tab)
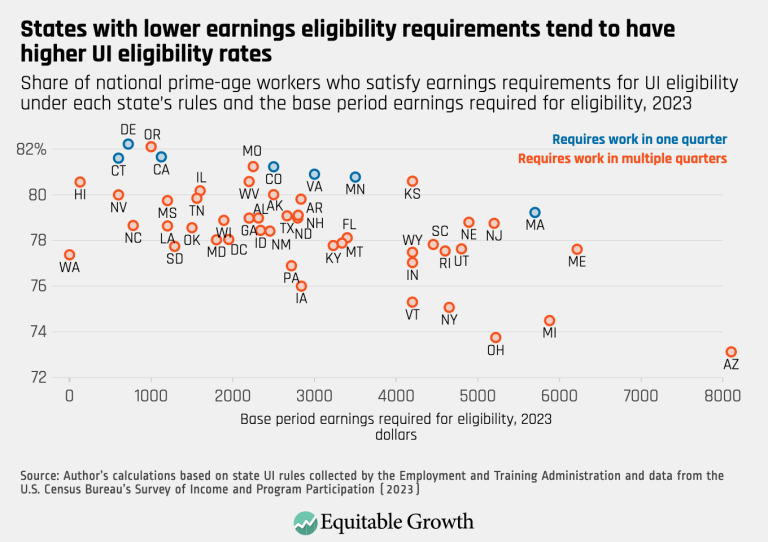
States with lower earnings eligibility requirements tend to have higher UI eligibility rates (opens in a new tab)
Visualizations Oct 24, 2024
 View Chart
(opens in a new tab)
View Chart
(opens in a new tab)
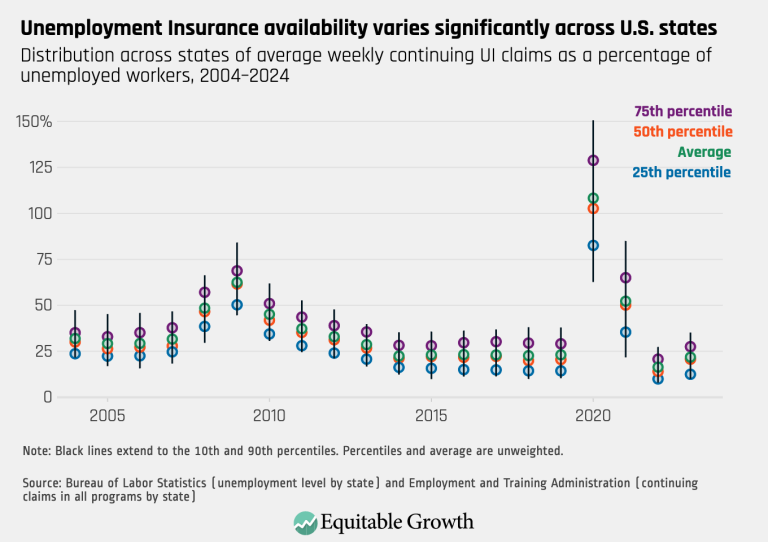
Unemployment Insurance availability varies significantly across U.S. states (opens in a new tab)
Visualizations Oct 24, 2024
 View Chart
(opens in a new tab)
View Chart
(opens in a new tab)
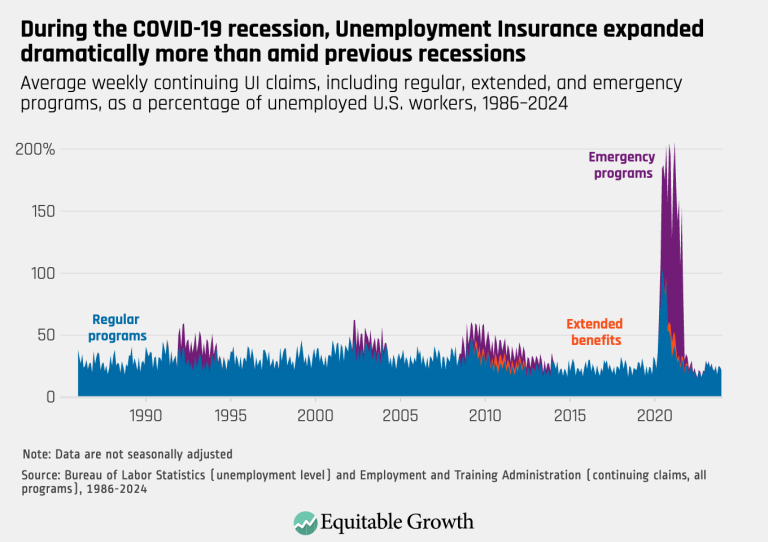
During the COVID-19 recession, Unemployment Insurance expanded dramatically more than amid previous recessions (opens in a new tab)
Visualizations Oct 24, 2024
 View Chart
(opens in a new tab)
View Chart
(opens in a new tab)
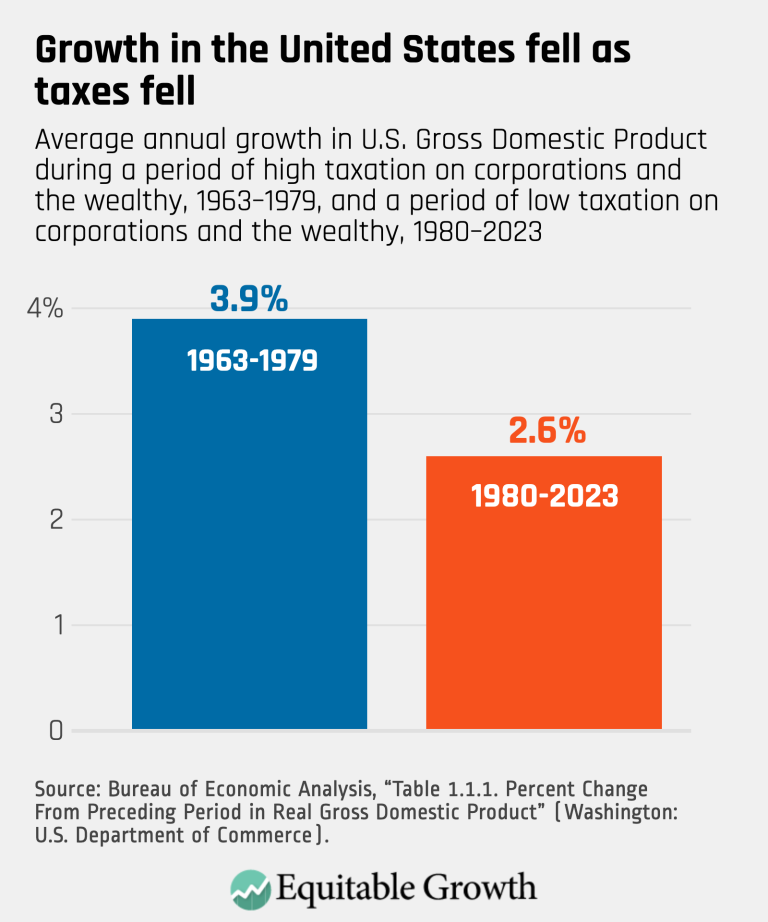
Growth in the United States fell as taxes fell – updated (opens in a new tab)
Visualizations Oct 15, 2024
 View Chart
(opens in a new tab)
View Chart
(opens in a new tab)
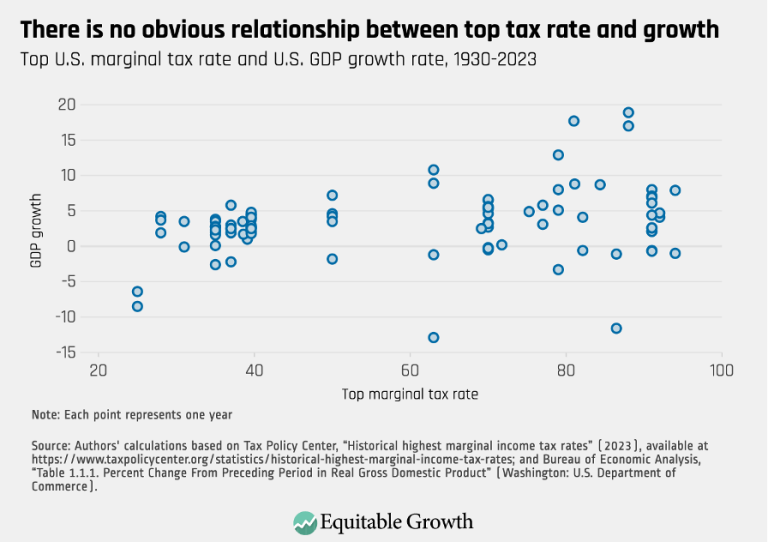
There is no obvious relationship between top tax rate and growth rate (opens in a new tab)
Visualizations Oct 15, 2024
 View Chart
(opens in a new tab)
View Chart
(opens in a new tab)
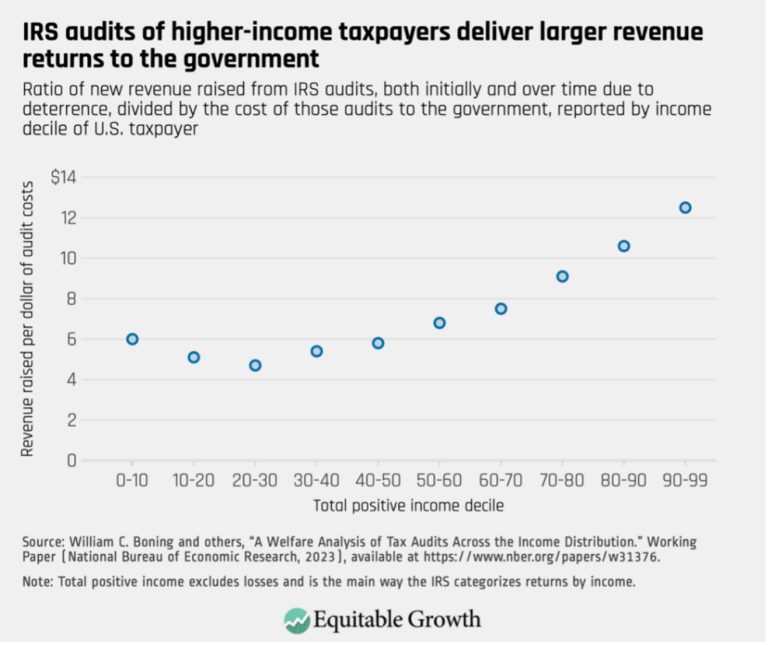
IRS audits of higher-income taxpayers deliver larger revenue returns to the government (opens in a new tab)
Visualizations Oct 15, 2024
 View Chart
(opens in a new tab)
View Chart
(opens in a new tab)
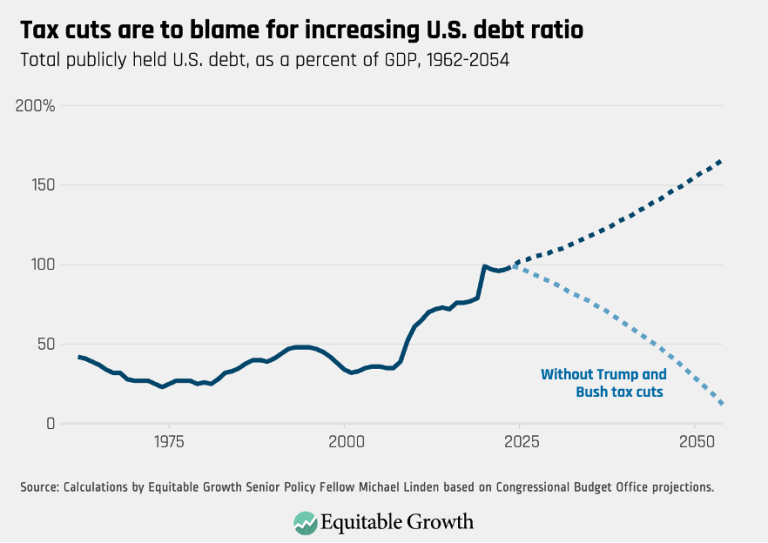
Tax cuts are to blame for increasing U.S. debt ratio (opens in a new tab)
Visualizations Oct 15, 2024
 View Chart
(opens in a new tab)
View Chart
(opens in a new tab)
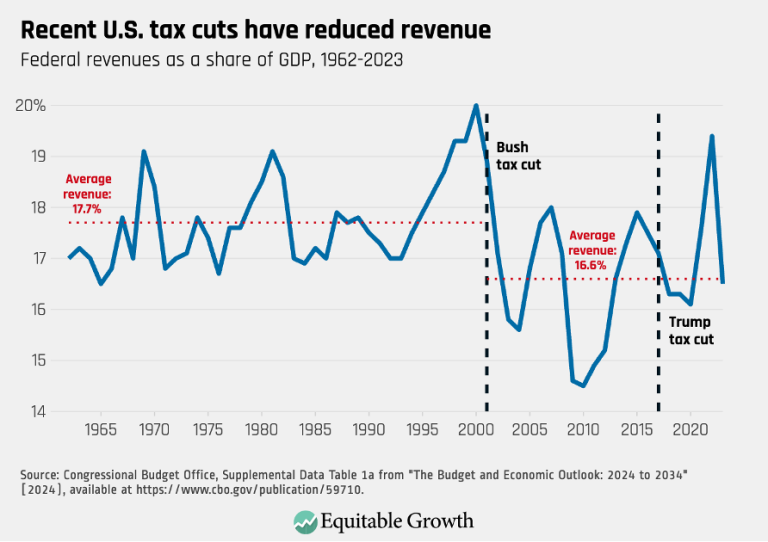
Recent U.S. tax cuts have reduced revenue (opens in a new tab)
Visualizations Oct 15, 2024
 View Chart
(opens in a new tab)
View Chart
(opens in a new tab)
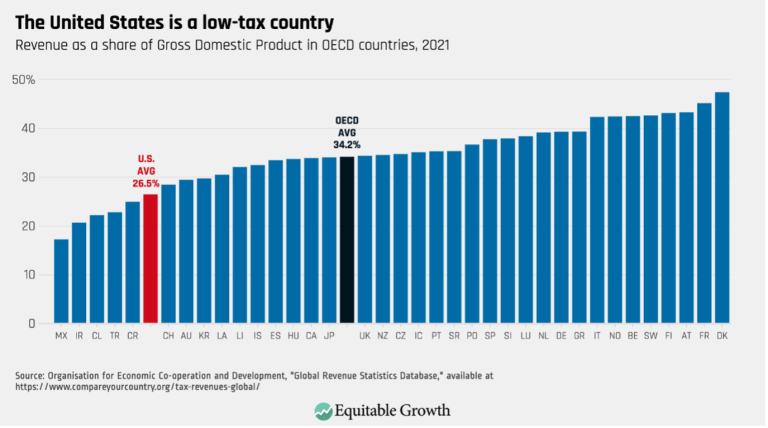
The United States is a low-tax country (opens in a new tab)
Visualizations Oct 15, 2024
 View Chart
(opens in a new tab)
View Chart
(opens in a new tab)
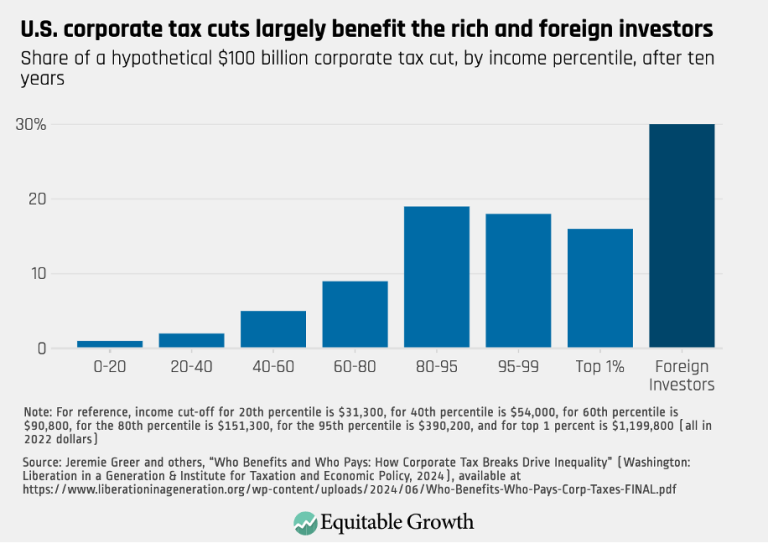
U.S. corporate tax cuts largely benefit the rich and foreign investors (opens in a new tab)
Visualizations Oct 15, 2024
 View Chart
(opens in a new tab)
View Chart
(opens in a new tab)
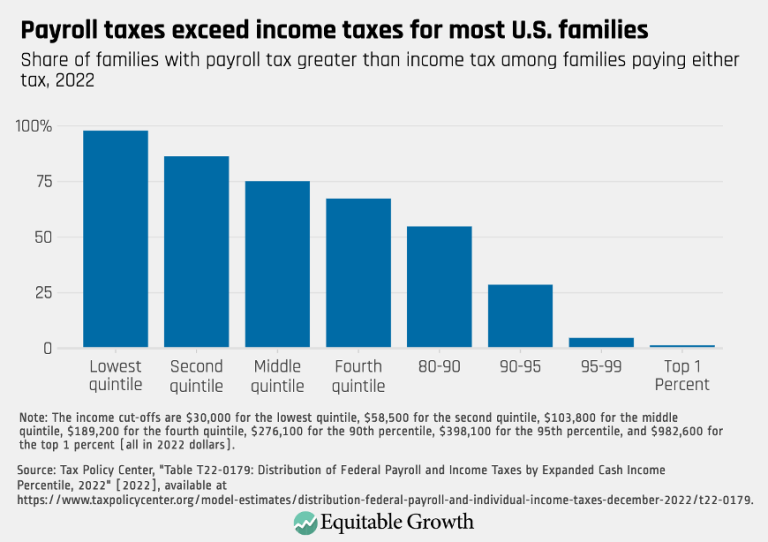
Payroll taxes exceed income taxes for most U.S. families (opens in a new tab)
Visualizations Oct 15, 2024
 View Chart
(opens in a new tab)
View Chart
(opens in a new tab)
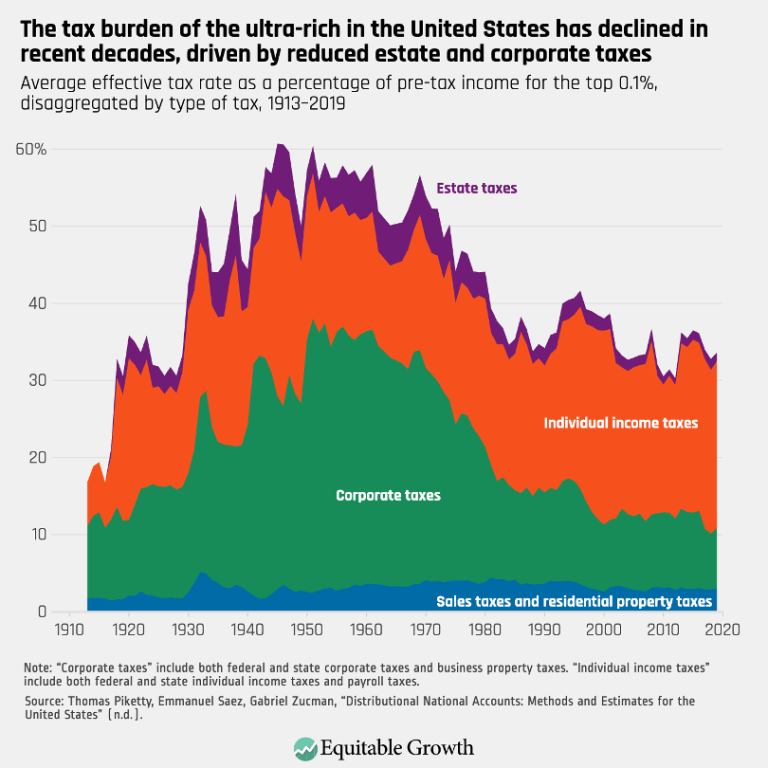
The Tax burden of the ultra-rich in the United States has declined in recent decades, driven by reduced estate and corporate taxes (opens in a new tab)
Visualizations Oct 15, 2024
 View Chart
(opens in a new tab)
View Chart
(opens in a new tab)
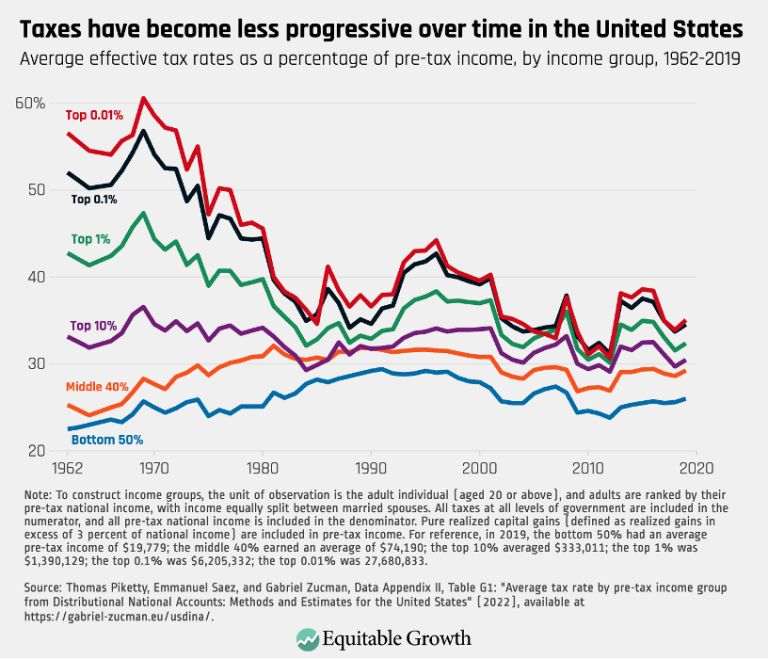
Taxes have become less progressive over time in the United States (opens in a new tab)
Visualizations Oct 15, 2024
 View Chart
(opens in a new tab)
View Chart
(opens in a new tab)
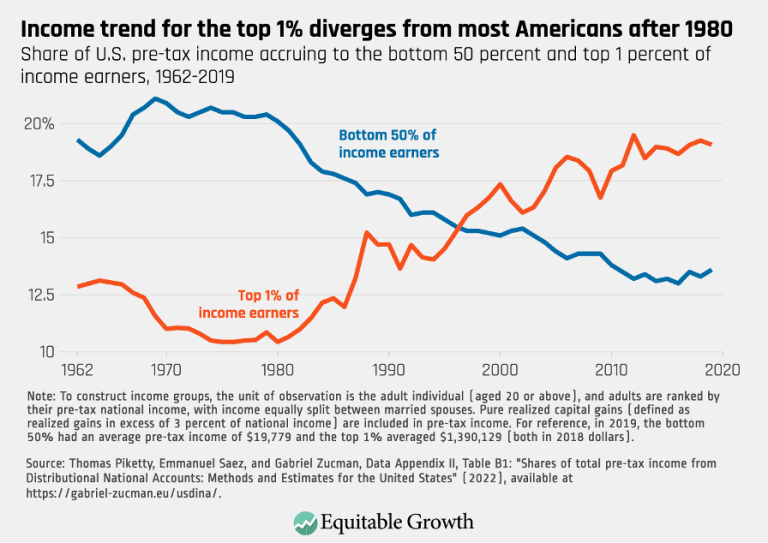
Income trend for the top 1% diverges from most Americans after 1980 (opens in a new tab)
Visualizations Oct 15, 2024
 View Chart
(opens in a new tab)
View Chart
(opens in a new tab)
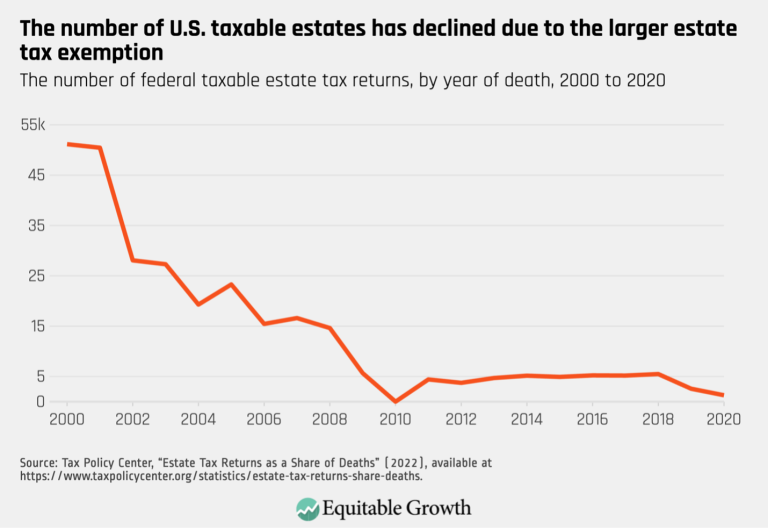
The number of U.S. taxable estates has declined due to the larger estate tax exemption (opens in a new tab)
Visualizations Oct 8, 2024
 View Chart
(opens in a new tab)
View Chart
(opens in a new tab)
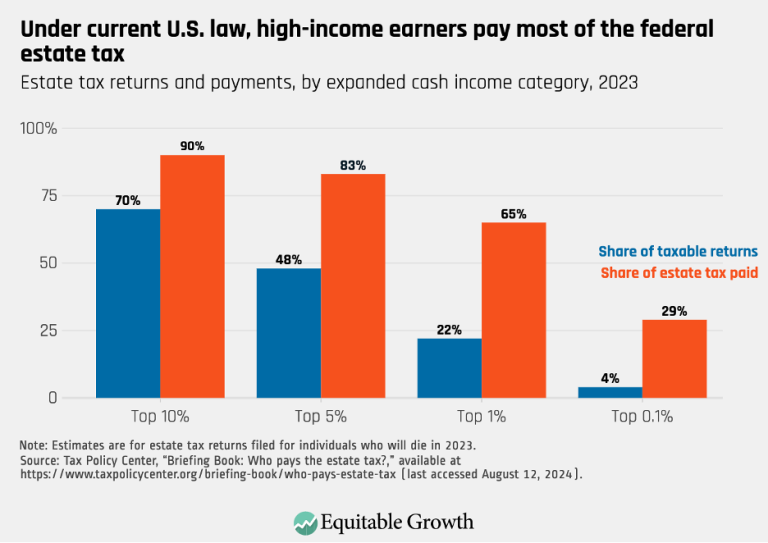
Under current U.S. law, high-income earners pay most of the federal estate tax (opens in a new tab)
Visualizations Oct 8, 2024




































Your Source for the Latest Insights
Get updates on our latest research, event announcements, and policy insights delivered straight to your inbox. Stay connected with the leading voices on equitable growth.