


Issue Areas
The Washington Center for Equitable Growth is engaged in an array of issues to advance evidence-based ideas and policies that promote strong, stable, and broad-based economic growth.

839 Results

 View Chart
(opens in a new tab)
View Chart
(opens in a new tab)
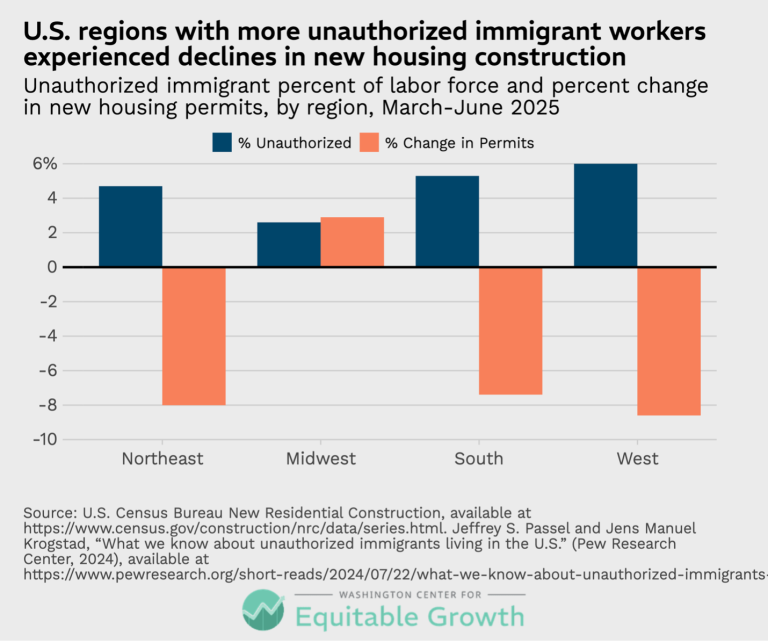
U.S. regions with more unauthorized immigrant workers experienced declines in new housing construction (opens in a new tab)
Visualizations Aug 31, 2026
 View Chart
(opens in a new tab)
View Chart
(opens in a new tab)
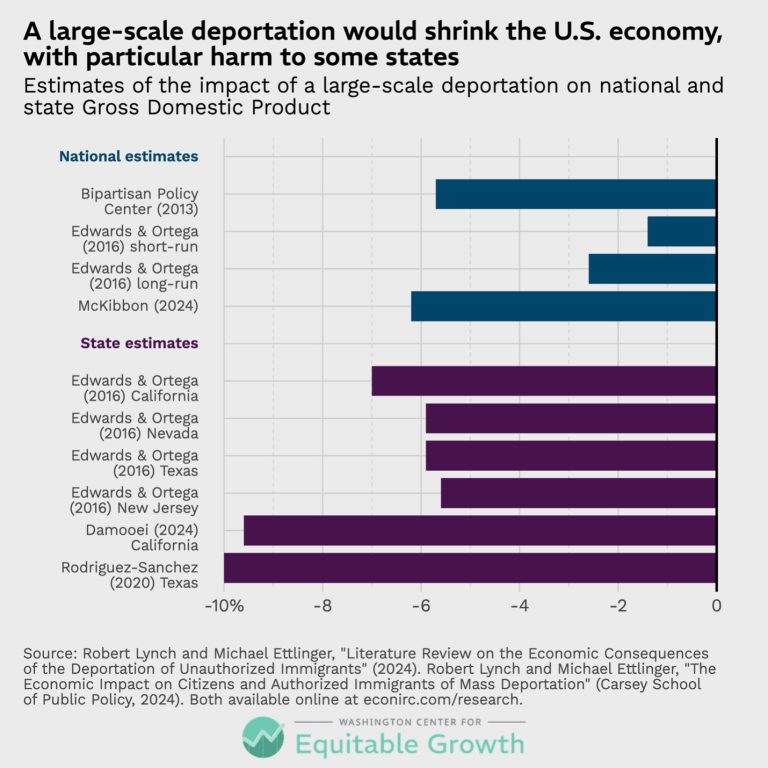
A large-scale deportation would shrink the U.S. economy, with particular harm to some states (opens in a new tab)
Visualizations Aug 31, 2026
 View Chart
(opens in a new tab)
View Chart
(opens in a new tab)
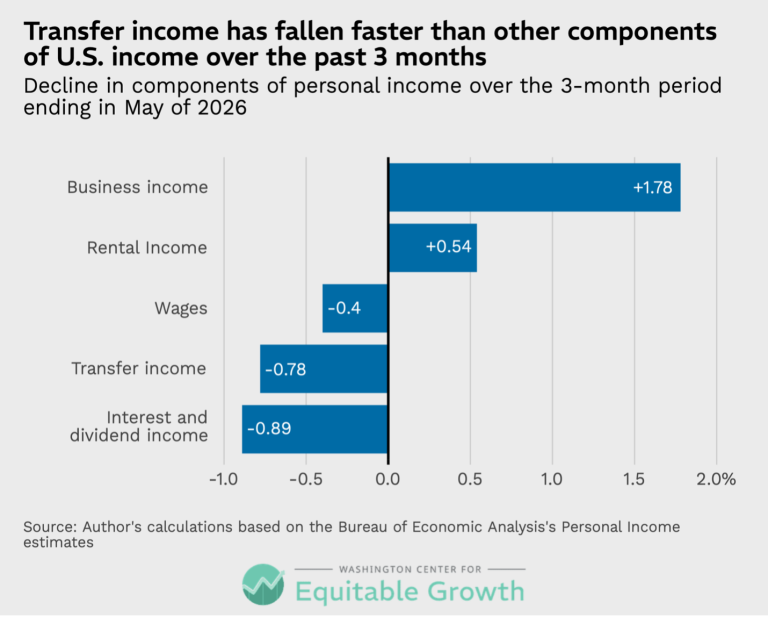
Transfer income has fallen faster than other components of U.S. income over the past 3 months (opens in a new tab)
Visualizations Jun 25, 2026
 View Chart
(opens in a new tab)
View Chart
(opens in a new tab)
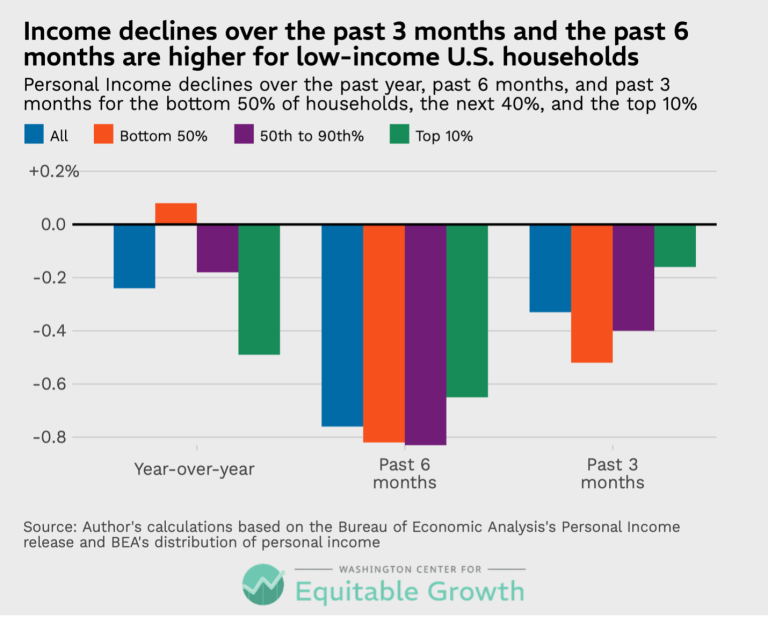
Income declines over the past 3 months and the past 6 months are higher for low-income U.S. households (opens in a new tab)
Visualizations Jun 25, 2026
 View Chart
(opens in a new tab)
View Chart
(opens in a new tab)
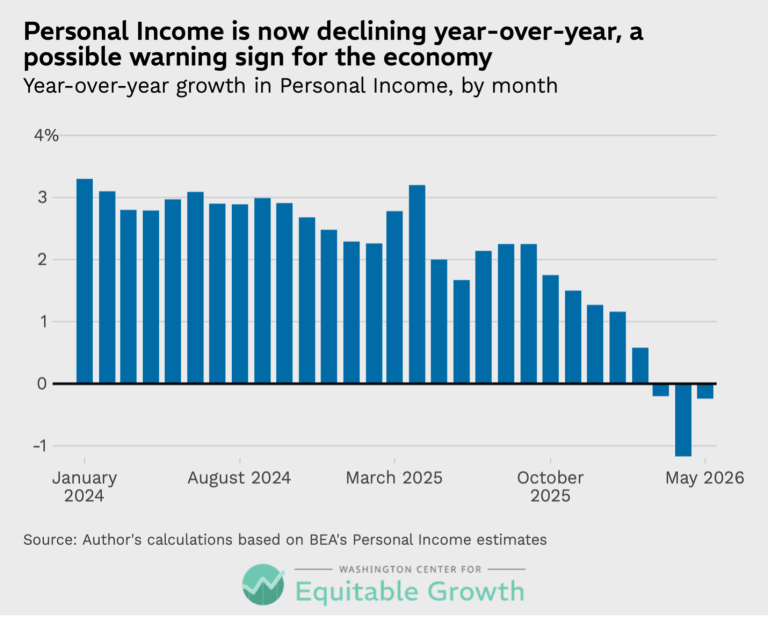
Personal Income is now declining year-over-year, a possible warning sign for the economy (opens in a new tab)
Visualizations Jun 25, 2026
 View Chart
(opens in a new tab)
View Chart
(opens in a new tab)
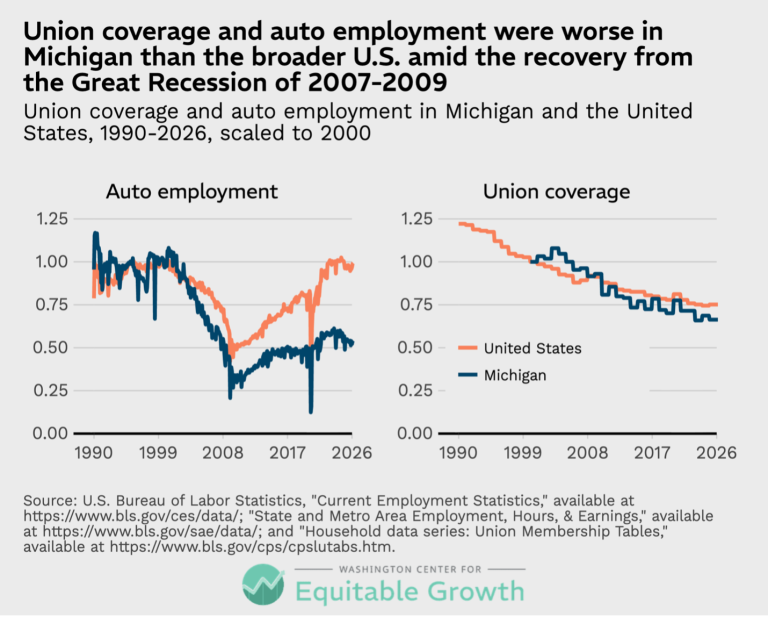
Union coverage and auto employment were worse in Michigan than the broader U.S. amid the recovery from the Great Recession of 2007-2009 (opens in a new tab)
Visualizations Jun 3, 2026
 View Chart
(opens in a new tab)
View Chart
(opens in a new tab)
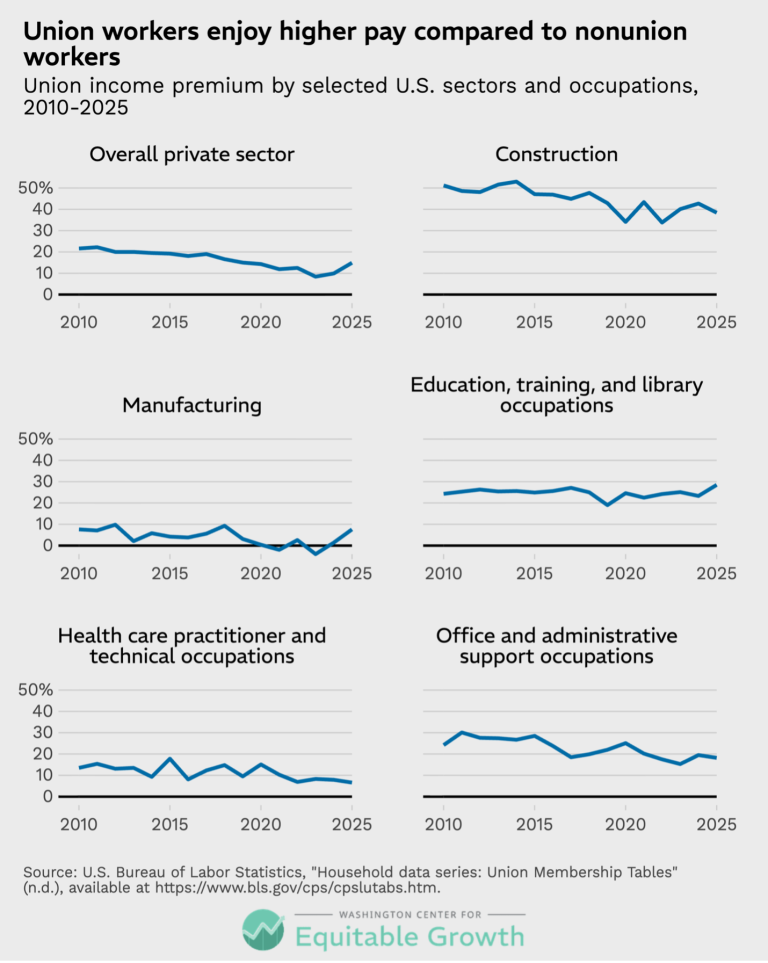
Union workers enjoy higher pay compared to nonunion workers (opens in a new tab)
Visualizations Jun 3, 2026
 View Chart
(opens in a new tab)
View Chart
(opens in a new tab)
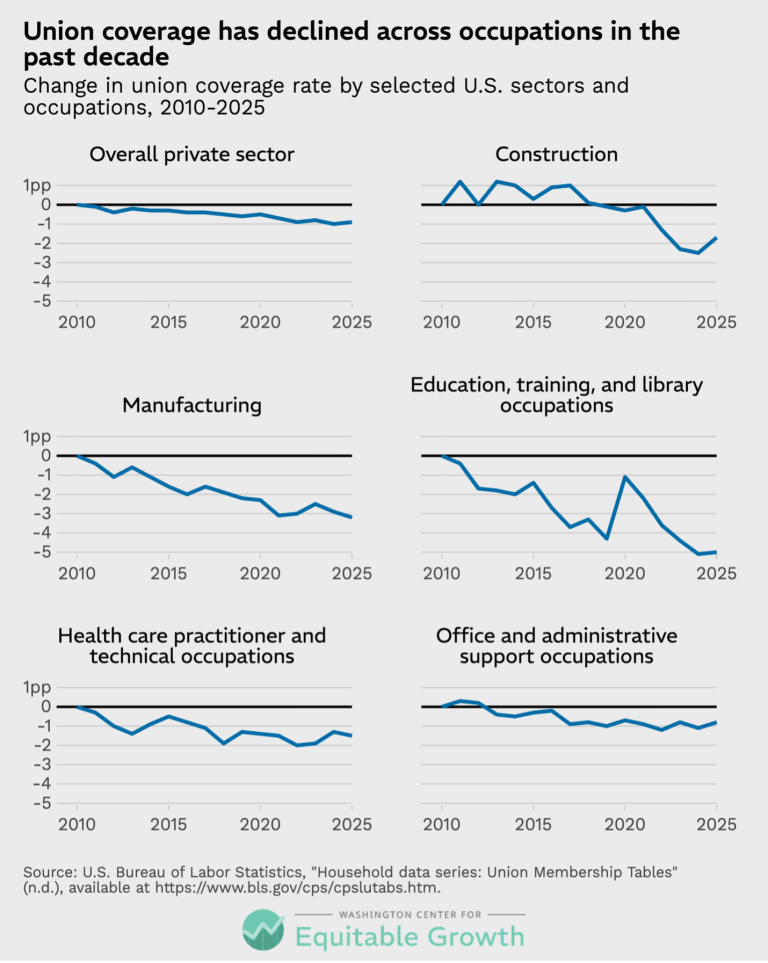
Union coverage has declined across occupations in the past decade (opens in a new tab)
Visualizations Jun 3, 2026
 View Chart
(opens in a new tab)
View Chart
(opens in a new tab)
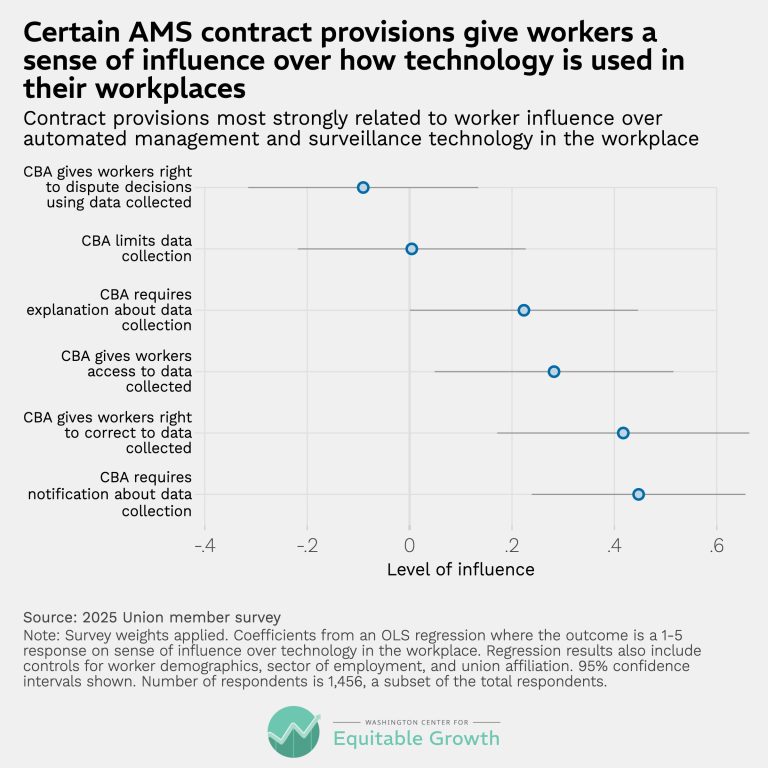
Certain AMS contract provisions give workers a sense of influence over how technology is used in their workplaces (opens in a new tab)
Visualizations Mar 12, 2026
 View Chart
(opens in a new tab)
View Chart
(opens in a new tab)
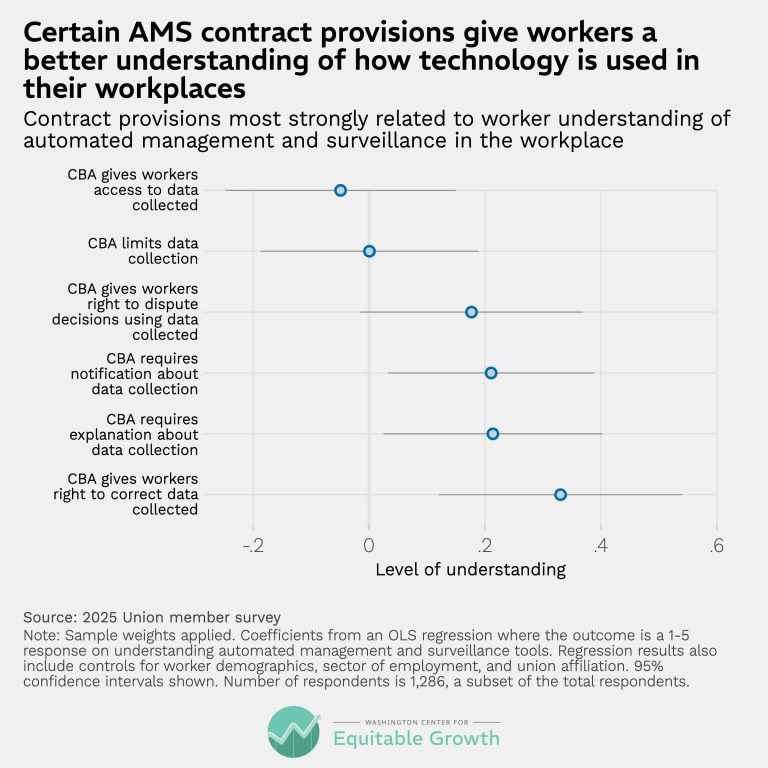
Certain AMS contract provisions give workers a better understanding of how technology is used in their workplaces (opens in a new tab)
Visualizations Mar 12, 2026
 View Chart
(opens in a new tab)
View Chart
(opens in a new tab)
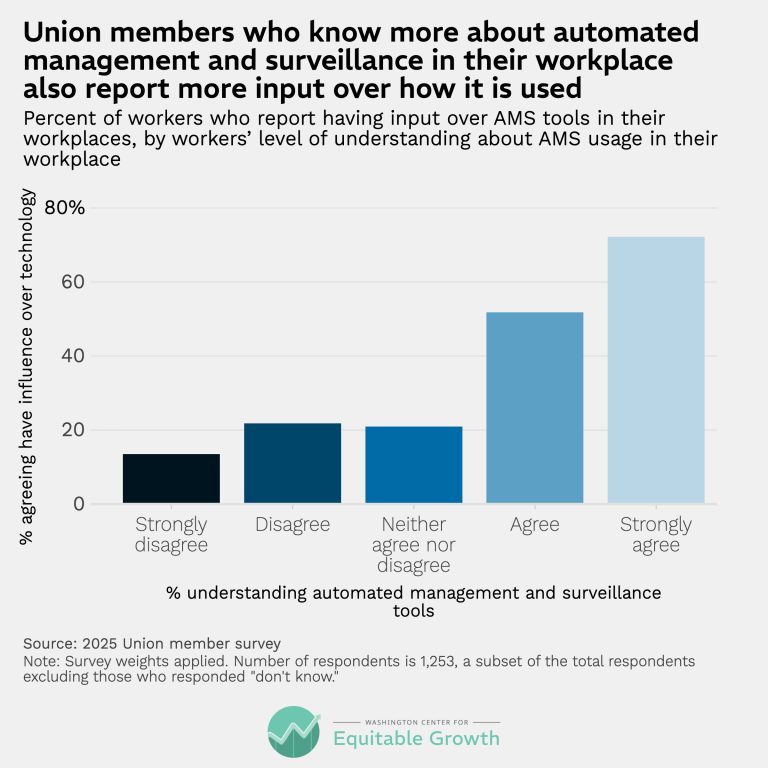
Union members who know more about automated management and surveillance in their workplace also report more input over how it is used (opens in a new tab)
Visualizations Mar 12, 2026
 View Chart
(opens in a new tab)
View Chart
(opens in a new tab)
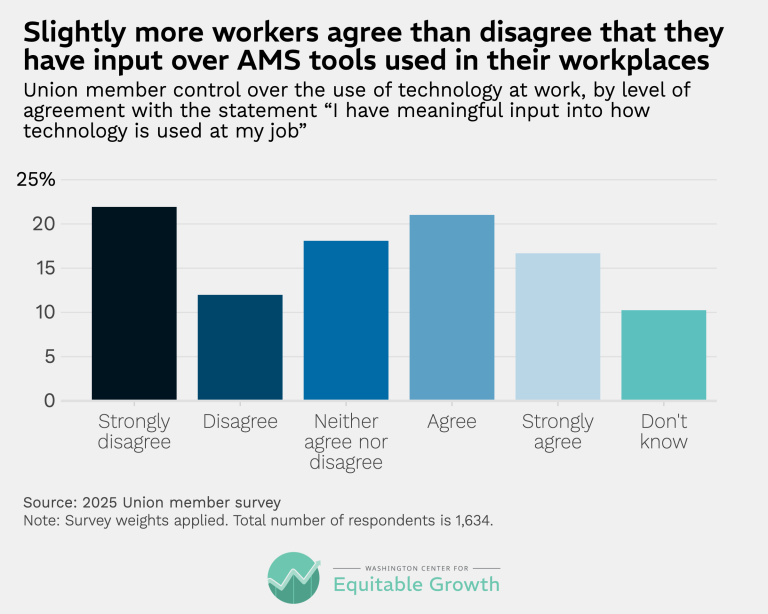
Slightly more workers agree than disagree that they have input over AMS tools used in their workplaces (opens in a new tab)
Visualizations Mar 12, 2026
 View Chart
(opens in a new tab)
View Chart
(opens in a new tab)
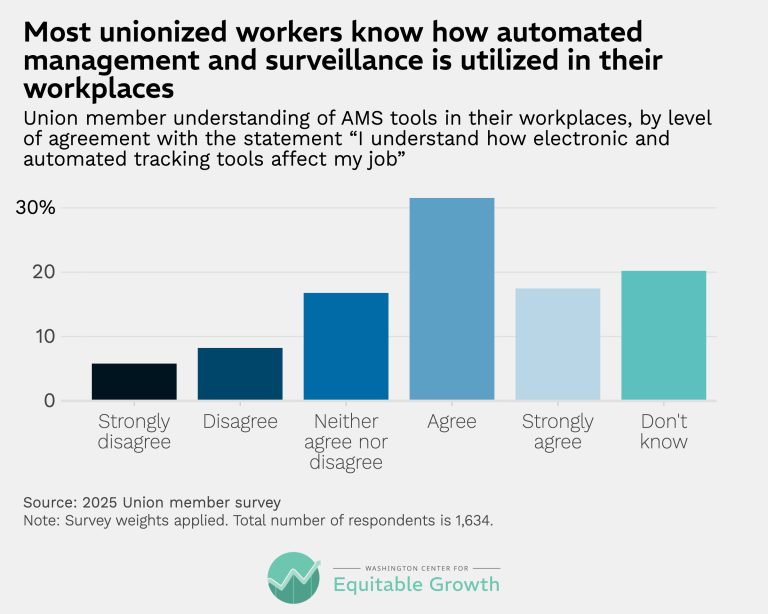
Most unionized workers know how automated management and surveillance are utilized in their workplaces (opens in a new tab)
Visualizations Mar 12, 2026
 View Chart
(opens in a new tab)
View Chart
(opens in a new tab)
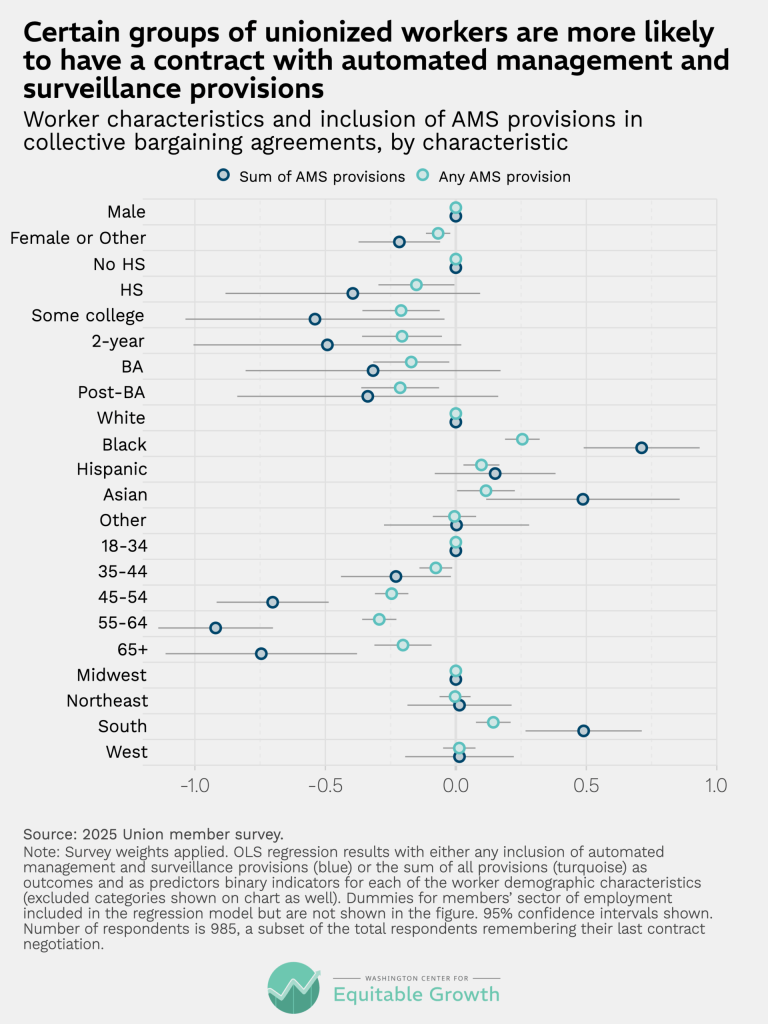
Certain groups of unionized workers are more likely to have a contract with automated management and surveillance provisions (opens in a new tab)
Visualizations Mar 12, 2026
 View Chart
(opens in a new tab)
View Chart
(opens in a new tab)
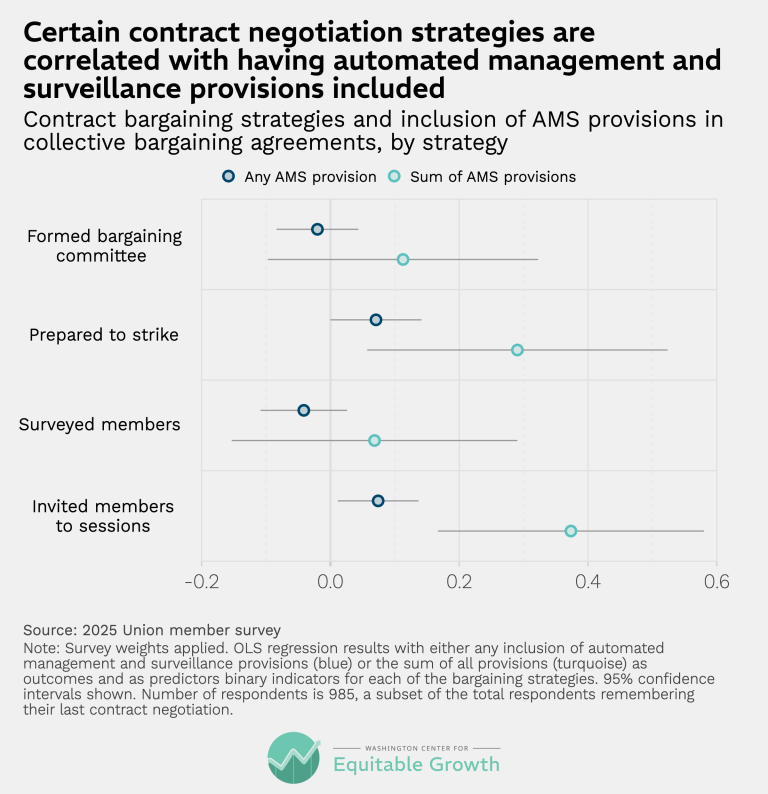
Certain contract negotiation strategies are correlated having automated management and surveillance provisions included (opens in a new tab)
Visualizations Mar 12, 2026
 View Chart
(opens in a new tab)
View Chart
(opens in a new tab)
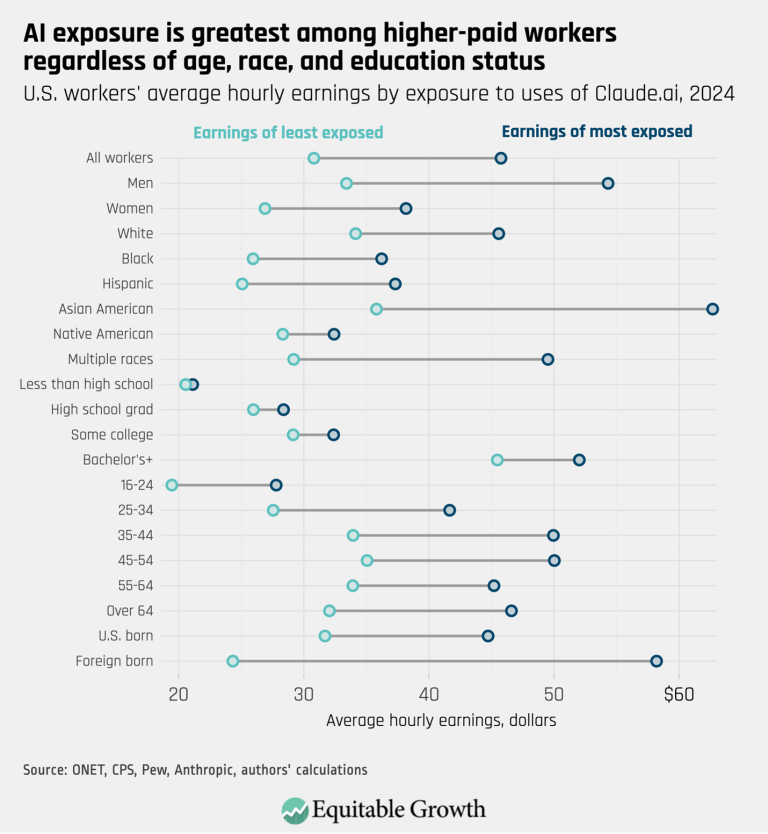
AI exposure is greatest among higher-paid workers regardless of age, race and education status (opens in a new tab)
Visualizations Oct 22, 2025
 View Chart
(opens in a new tab)
View Chart
(opens in a new tab)
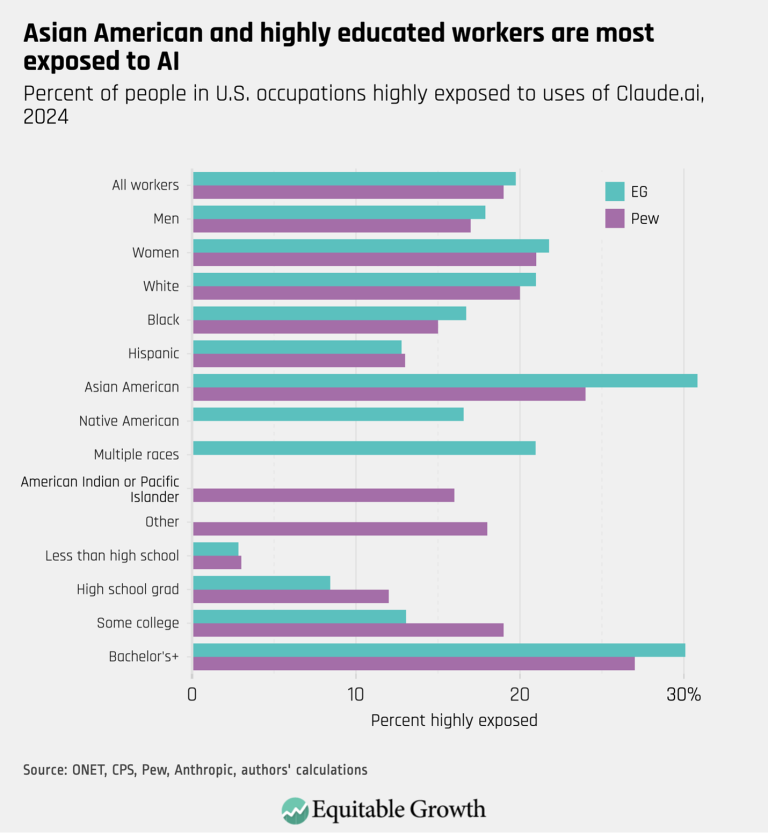
Asian American and highly educated workers are most exposed to AI (opens in a new tab)
Visualizations Oct 22, 2025
 View Chart
(opens in a new tab)
View Chart
(opens in a new tab)
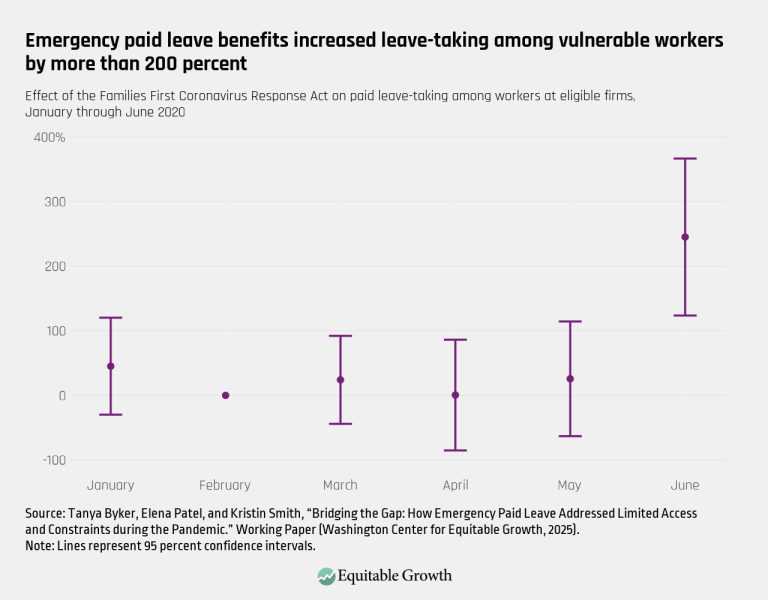
Emergency paid leave benefits increased leave-taking among vulnerable workers by more than 200 percent – Final (opens in a new tab)
Visualizations Sep 23, 2025
 View Chart
(opens in a new tab)
View Chart
(opens in a new tab)
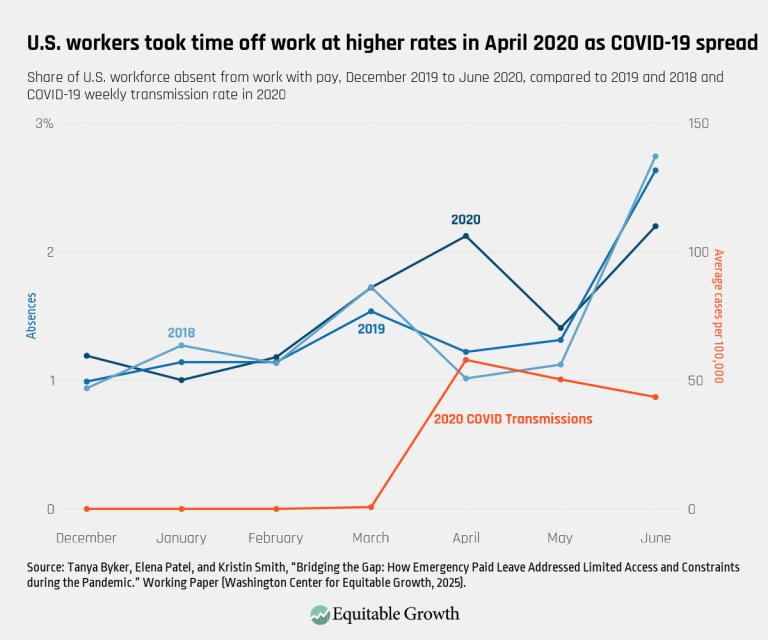
U.S. workers took time off work at higher rates in April 2020 as COVID-19 spread (opens in a new tab)
Visualizations Sep 23, 2025
 View Chart
(opens in a new tab)
View Chart
(opens in a new tab)
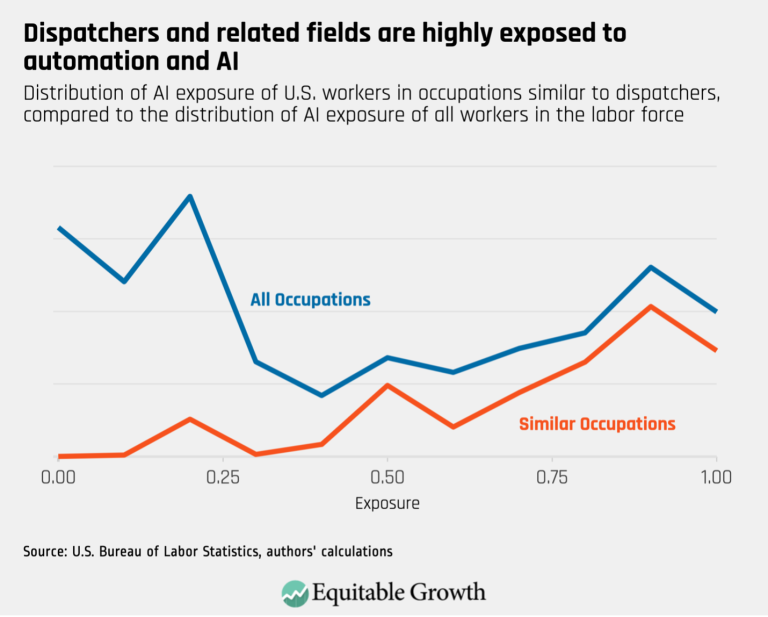
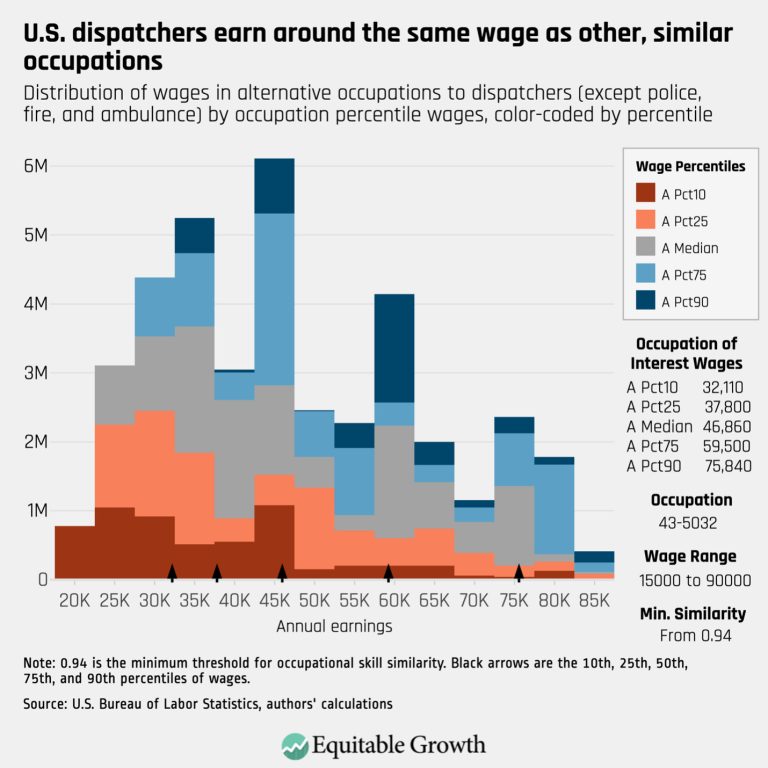
Dispatchers and related fields are highly exposed to automation and AI (opens in a new tab)
Visualizations Jul 10, 2025
 View Chart
(opens in a new tab)
View Chart
(opens in a new tab)
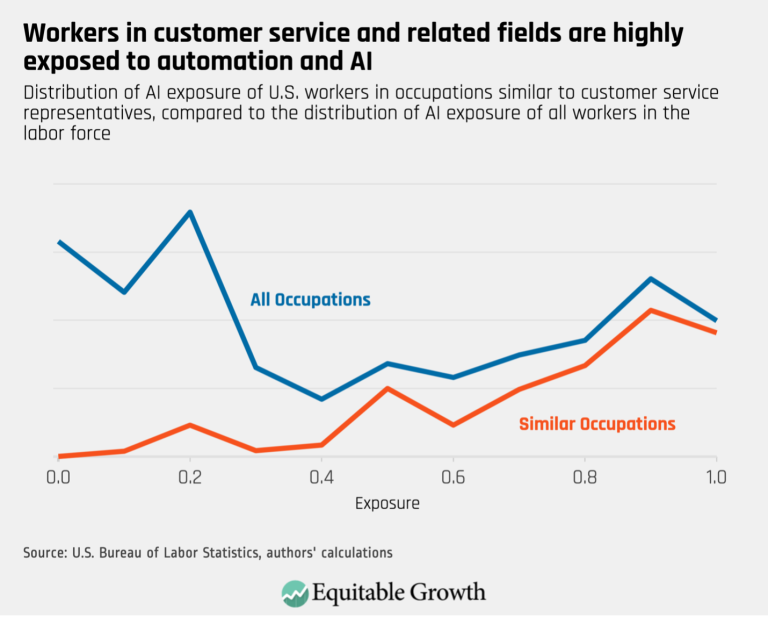
U.S. dispatchers earn around the same wage as other, similar occupations (opens in a new tab)
Visualizations Jul 10, 2025
 View Chart
(opens in a new tab)
View Chart
(opens in a new tab)
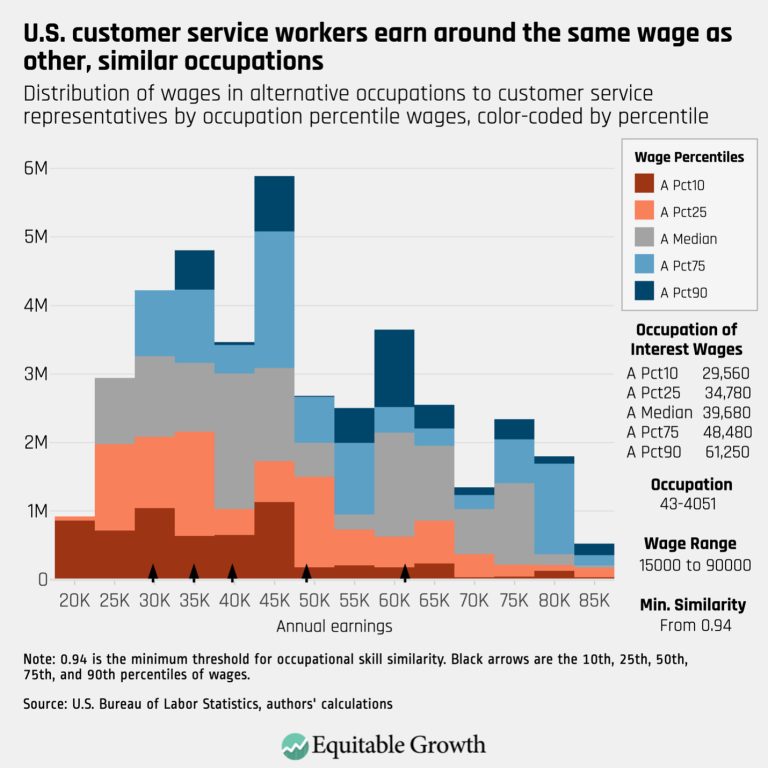
Workers in customer service and related fields are highly exposed to automation and AI (opens in a new tab)
Visualizations Jul 10, 2025
 View Chart
(opens in a new tab)
View Chart
(opens in a new tab)
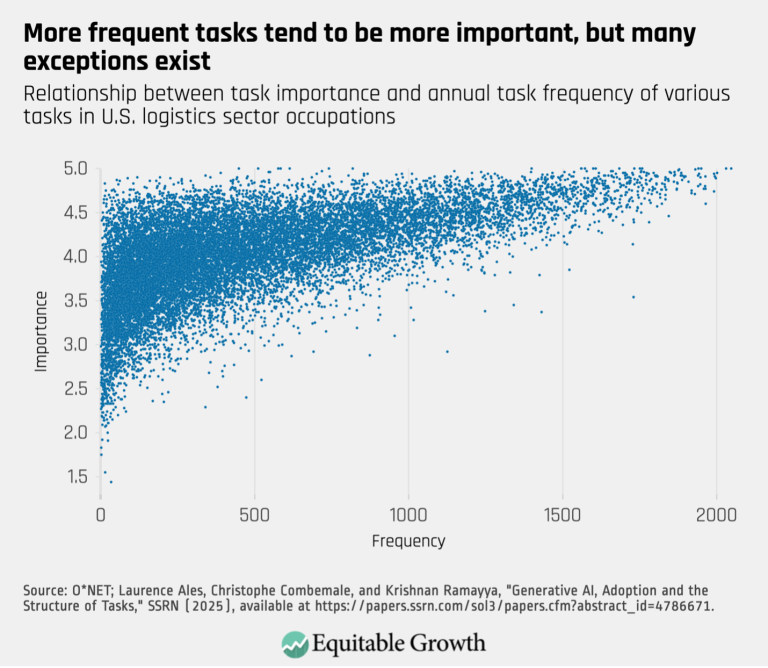
U.S. customer service workers earn around the same wage as other, similar occupations (opens in a new tab)
Visualizations Jul 10, 2025
 View Chart
(opens in a new tab)
View Chart
(opens in a new tab)
More frequent tasks tend to be more important, but many exceptions exist (opens in a new tab)
Visualizations Jul 9, 2025
 View Chart
(opens in a new tab)
View Chart
(opens in a new tab)
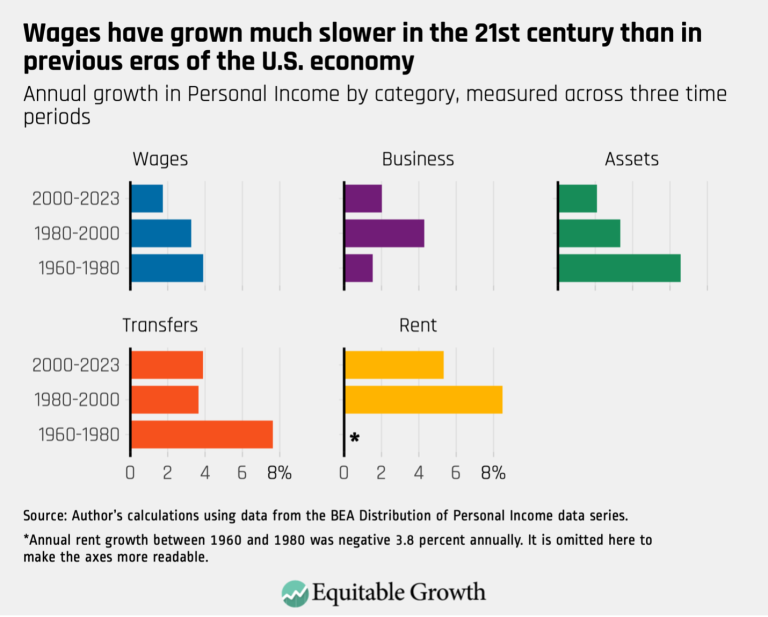
Wages have grown much slower in the 21st century than in previous eras of the U.S. economy (opens in a new tab)
Visualizations Jun 25, 2025
 View Chart
(opens in a new tab)
View Chart
(opens in a new tab)
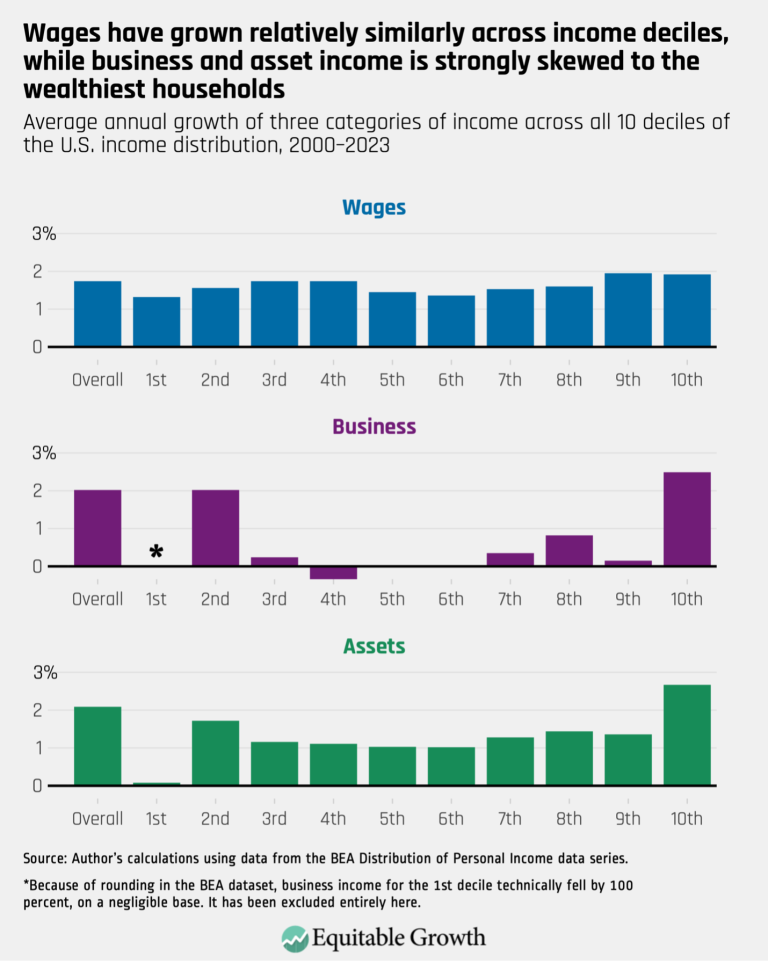
Wages have grown relatively similarly across income deciles, while business and asset income is strongly skewed to the wealthiest households (opens in a new tab)
Visualizations Jun 25, 2025
 View Chart
(opens in a new tab)
View Chart
(opens in a new tab)
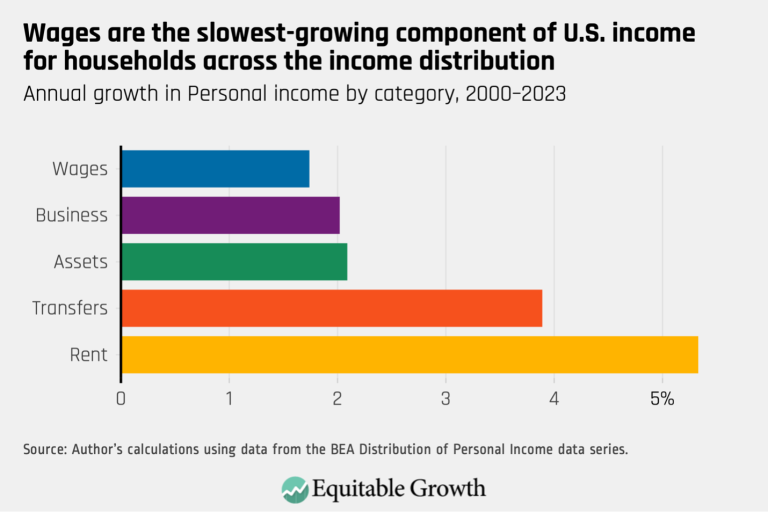
Wages are the slowest-growing component of U.S. income for households across the income distribution (opens in a new tab)
Visualizations Jun 25, 2025
 View Chart
(opens in a new tab)
View Chart
(opens in a new tab)
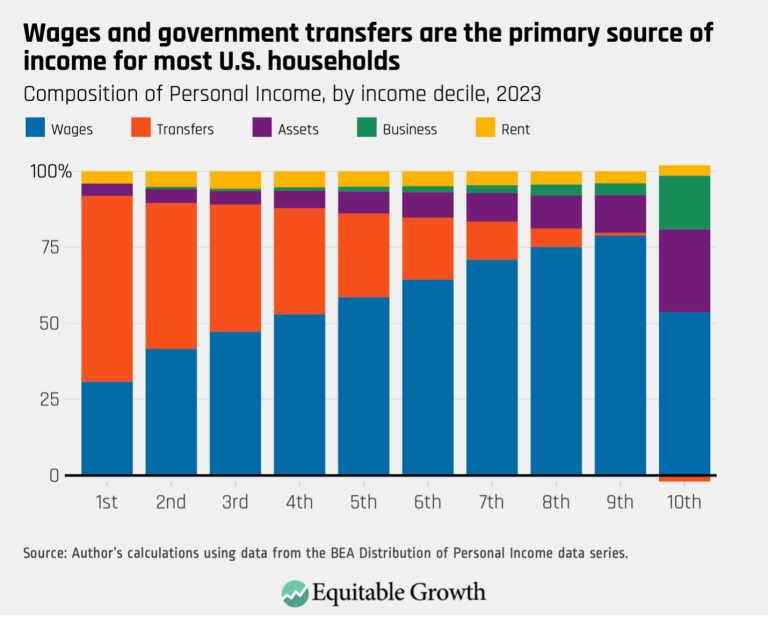
Wages and government transfers are the primary source of income for most U.S. households (opens in a new tab)
Visualizations Jun 25, 2025
 View Chart
(opens in a new tab)
View Chart
(opens in a new tab)
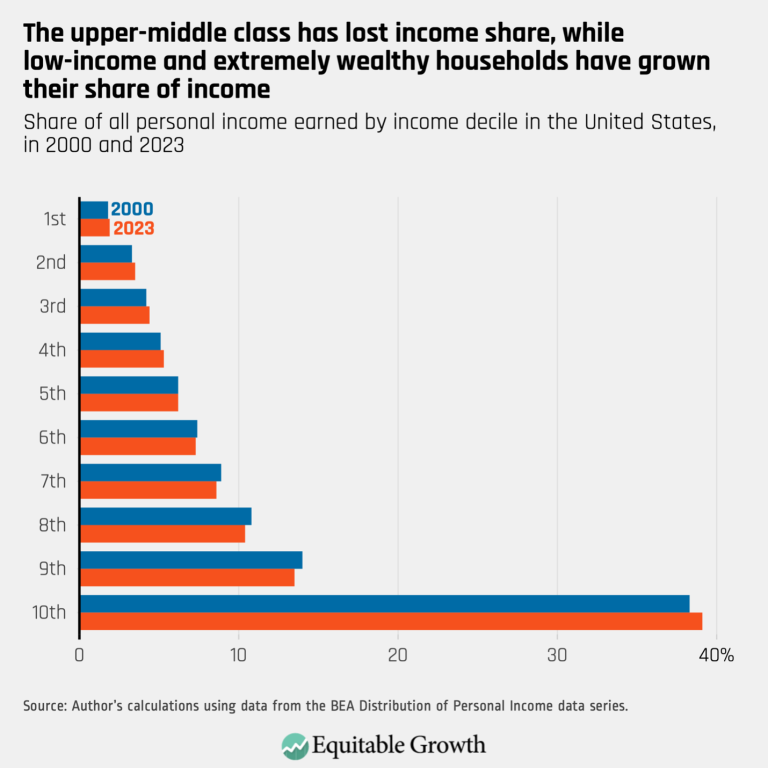
The upper-middle class has lost income share, while low-income and extremely wealthy households have grown their share of income (opens in a new tab)
Visualizations Jun 25, 2025
 View Chart
(opens in a new tab)
View Chart
(opens in a new tab)
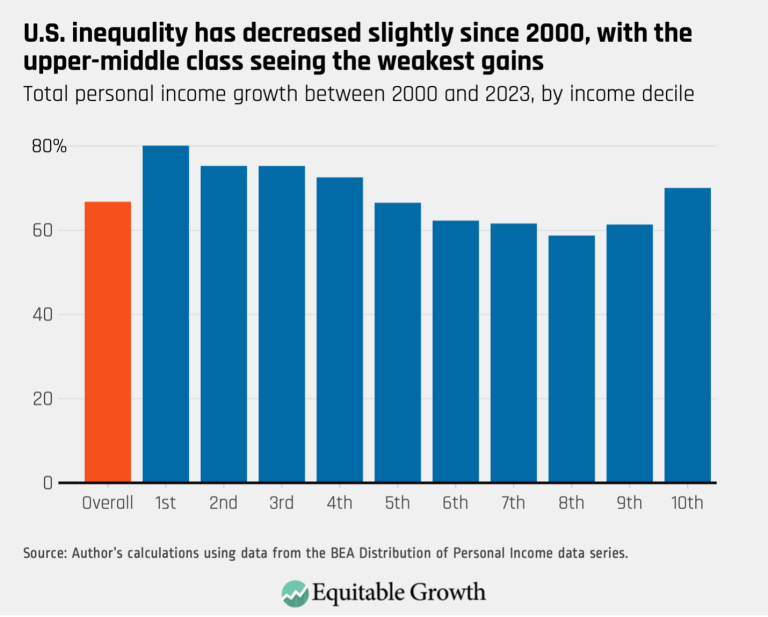
U.S. inequality has decreased slightly since 2000, with the upper-middle class seeing the weakest gains (opens in a new tab)
Visualizations Jun 25, 2025
 View Chart
(opens in a new tab)
View Chart
(opens in a new tab)
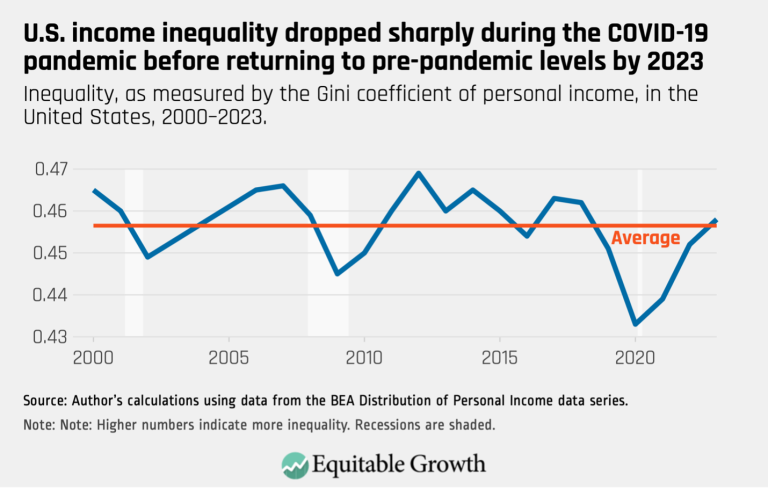
U.S. income inequality dropped sharply during the COVID-19 pandemic before returning to pre-pandemic levels by 2023 (opens in a new tab)
Visualizations Jun 25, 2025
 View Chart
(opens in a new tab)
View Chart
(opens in a new tab)
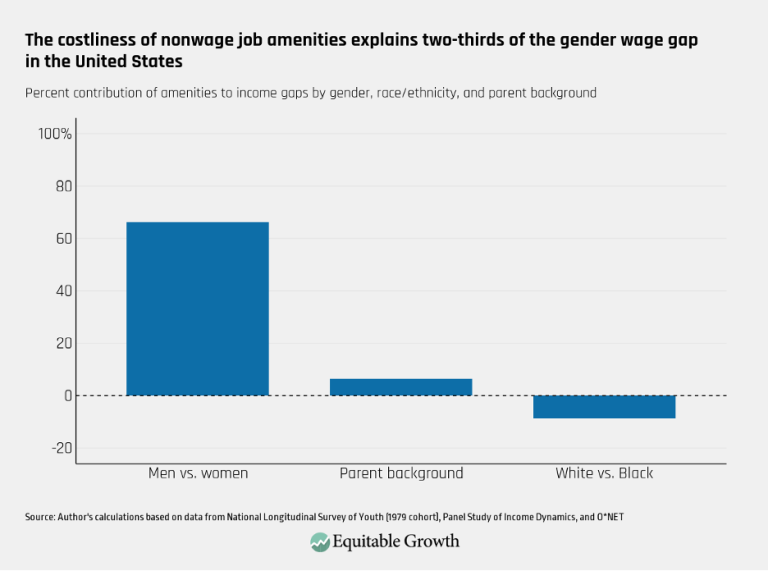
The costliness of nonwage job amenities explains two-thirds of the gender wage gap in the United States (opens in a new tab)
Visualizations Jun 10, 2025
 View Chart
(opens in a new tab)
View Chart
(opens in a new tab)
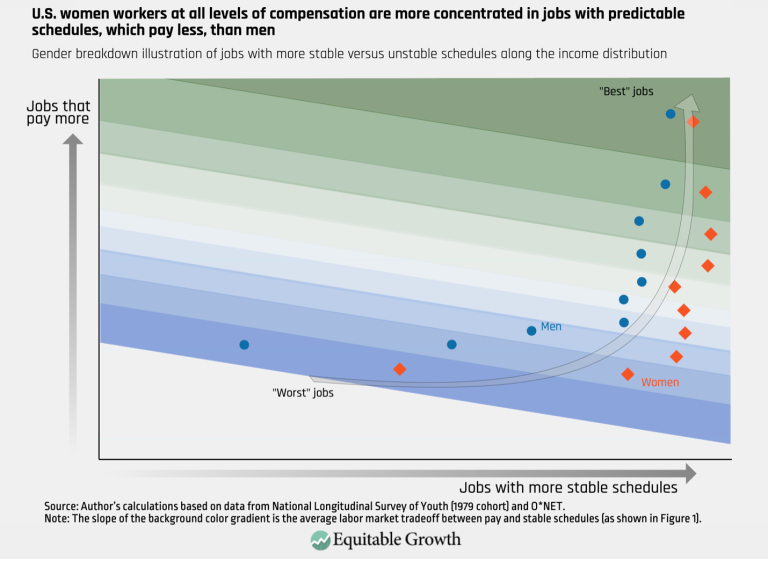
U.S. women workers at all levels of compensation are more concentrated in jobs with predictable schedules, which pay less, than men (opens in a new tab)
Visualizations Jun 10, 2025
 View Chart
(opens in a new tab)
View Chart
(opens in a new tab)
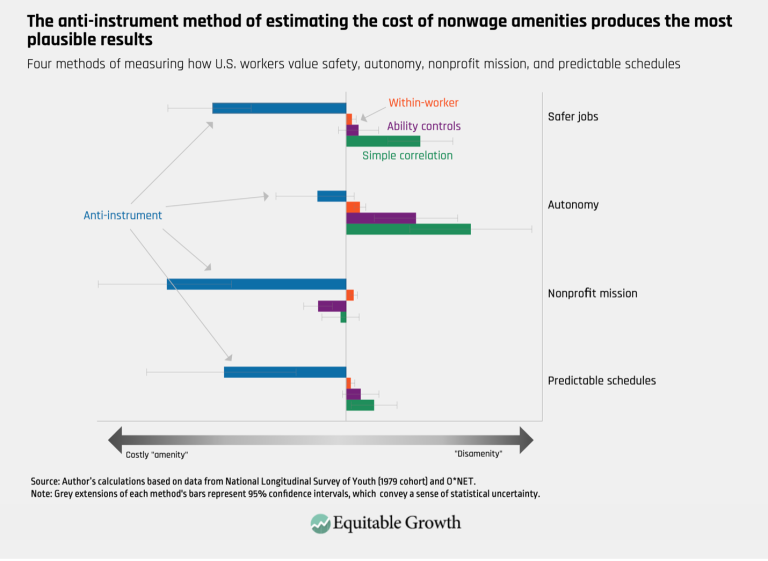
The anti-instrument method of estimating the cost of nonwage amenities produces the most plausible results (opens in a new tab)
Visualizations Jun 10, 2025
 View Chart
(opens in a new tab)
View Chart
(opens in a new tab)
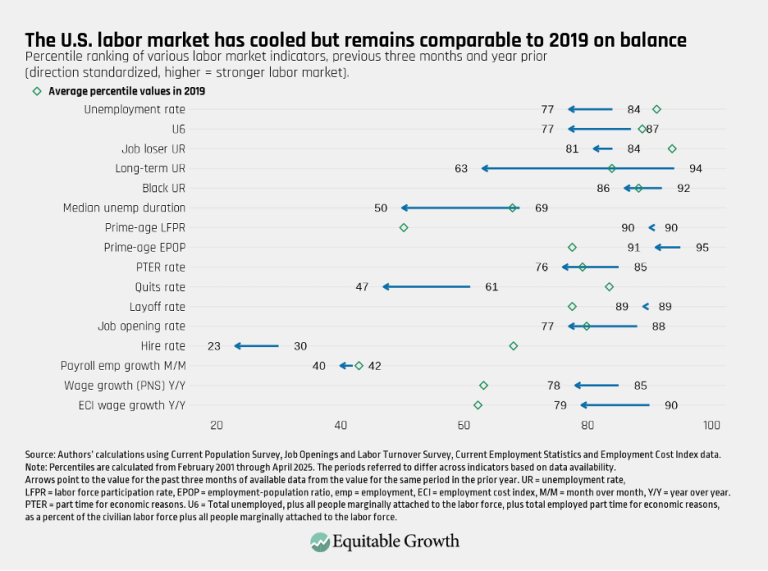
rinz fig 1 (opens in a new tab)
Visualizations May 9, 2025
 View Chart
(opens in a new tab)
View Chart
(opens in a new tab)
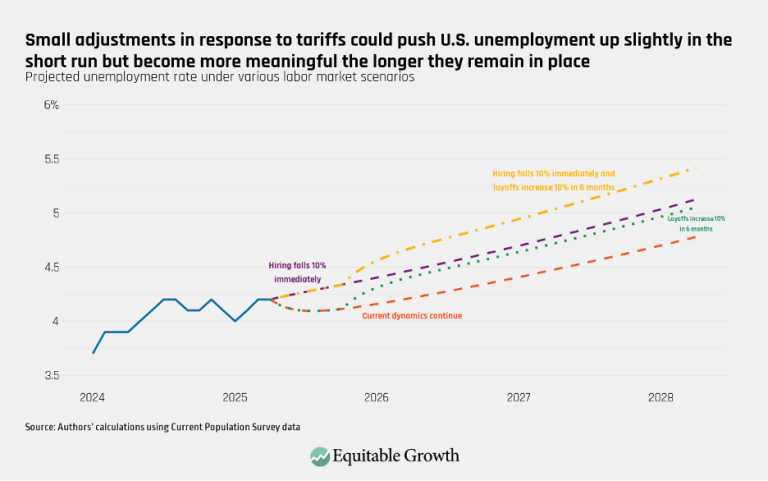
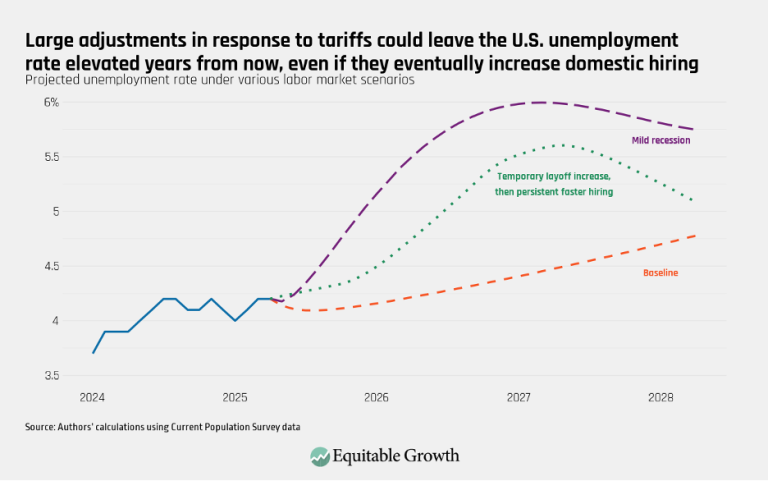
Small adjustments in response to tariffs could push U.S. unemployment up slightly in the short run but become more meaningful the longer they remain in place (opens in a new tab)
Visualizations May 9, 2025
 View Chart
(opens in a new tab)
View Chart
(opens in a new tab)
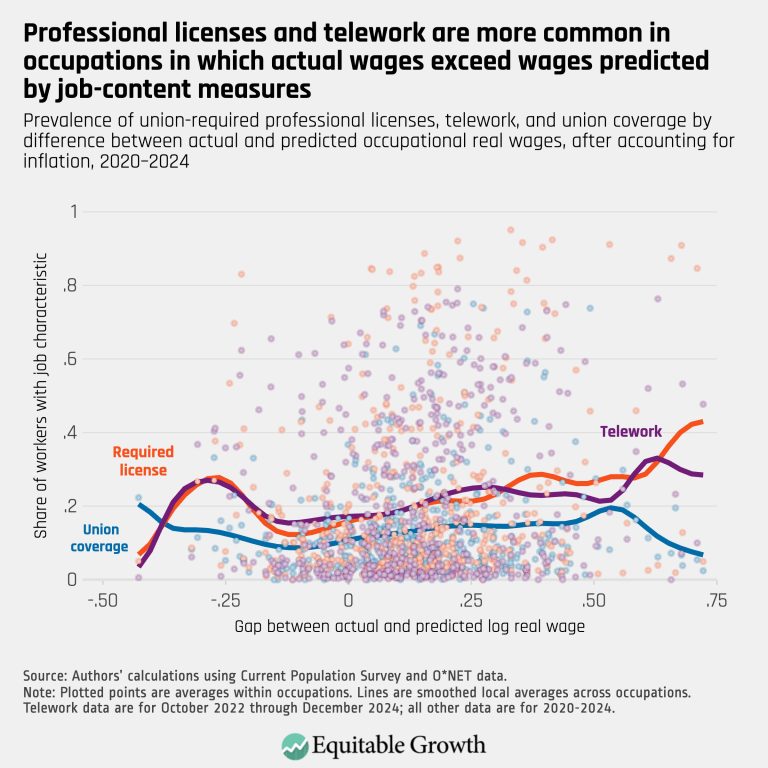
rinz fig 3 (opens in a new tab)
Visualizations May 9, 2025
 View Chart
(opens in a new tab)
View Chart
(opens in a new tab)
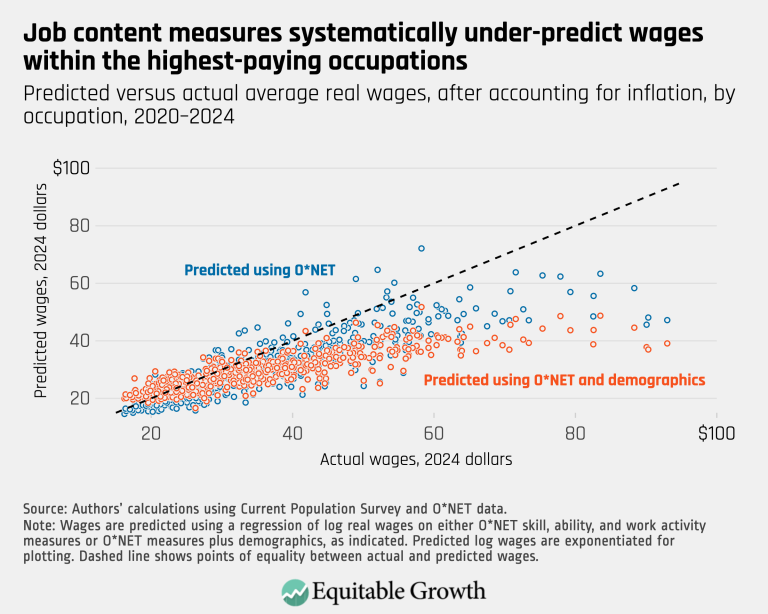
Professional licenses and telework are more common in occupations in which actual wages exceed wages predicted by job-content measures (opens in a new tab)
Visualizations May 6, 2025
 View Chart
(opens in a new tab)
View Chart
(opens in a new tab)
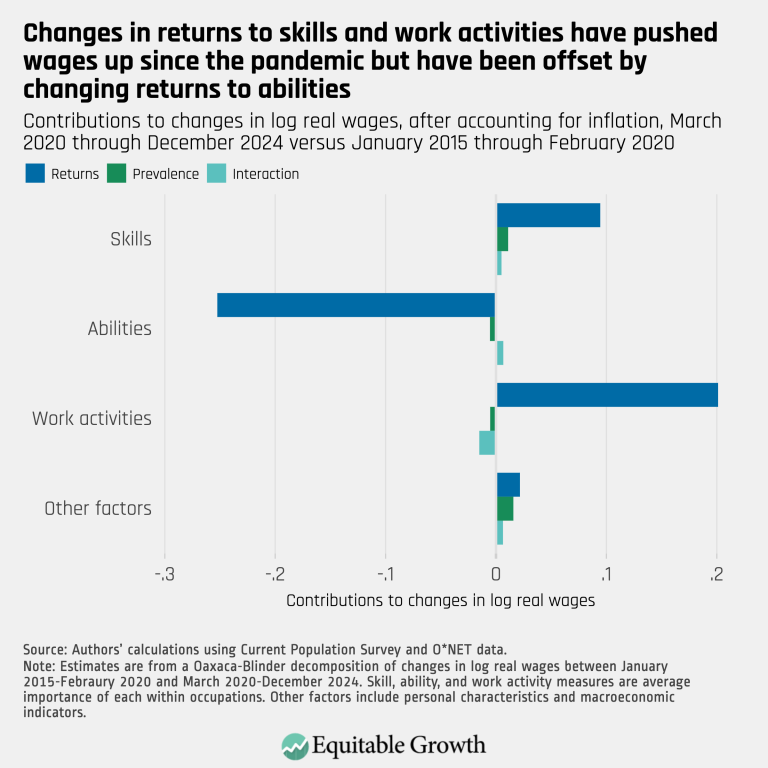
playfair (2) (opens in a new tab)
Visualizations May 6, 2025
 View Chart
(opens in a new tab)
View Chart
(opens in a new tab)
playfair (opens in a new tab)
Visualizations May 6, 2025
 View Chart
(opens in a new tab)
View Chart
(opens in a new tab)
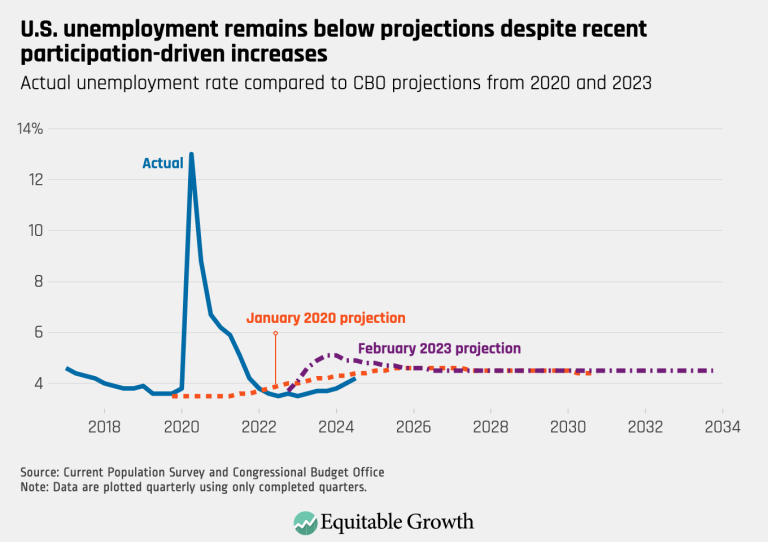
U.S. unemployment remains below projections despite recent participation-driven increases (opens in a new tab)
Visualizations Nov 5, 2024
 View Chart
(opens in a new tab)
View Chart
(opens in a new tab)
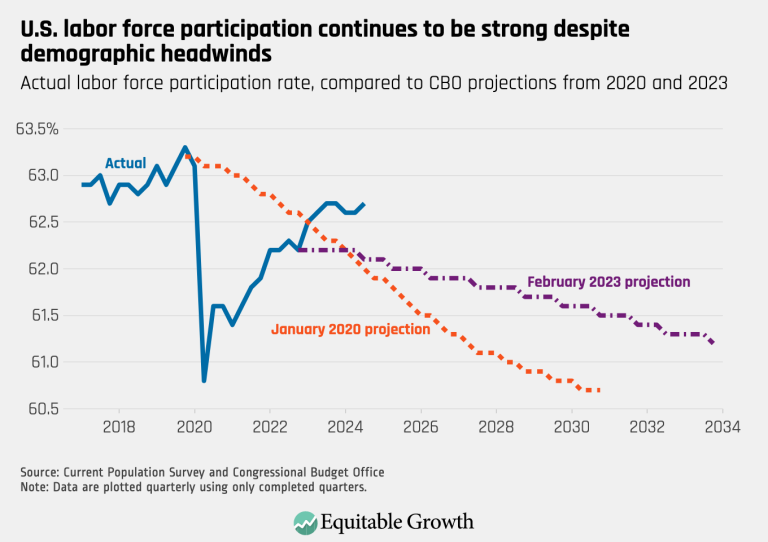
U.S. labor force participation continues to be strong despite demographic headwinds (opens in a new tab)
Visualizations Nov 5, 2024









































Your Source for the Latest Insights
Get updates on our latest research, event announcements, and policy insights delivered straight to your inbox. Stay connected with the leading voices on equitable growth.