


Issue Areas
The Washington Center for Equitable Growth is engaged in an array of issues to advance evidence-based ideas and policies that promote strong, stable, and broad-based economic growth.

826 Results

 View Chart
(opens in a new tab)
View Chart
(opens in a new tab)
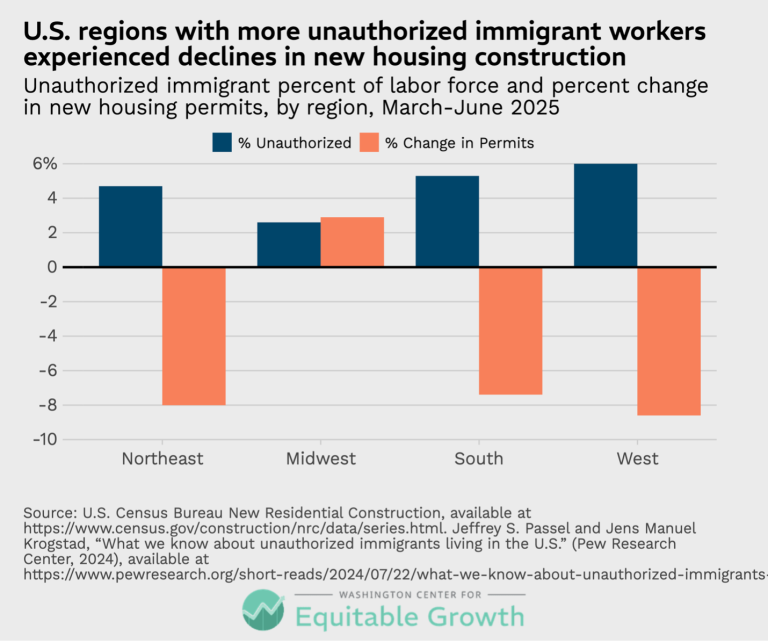
U.S. regions with more unauthorized immigrant workers experienced declines in new housing construction (opens in a new tab)
Visualizations Aug 31, 2026
 View Chart
(opens in a new tab)
View Chart
(opens in a new tab)
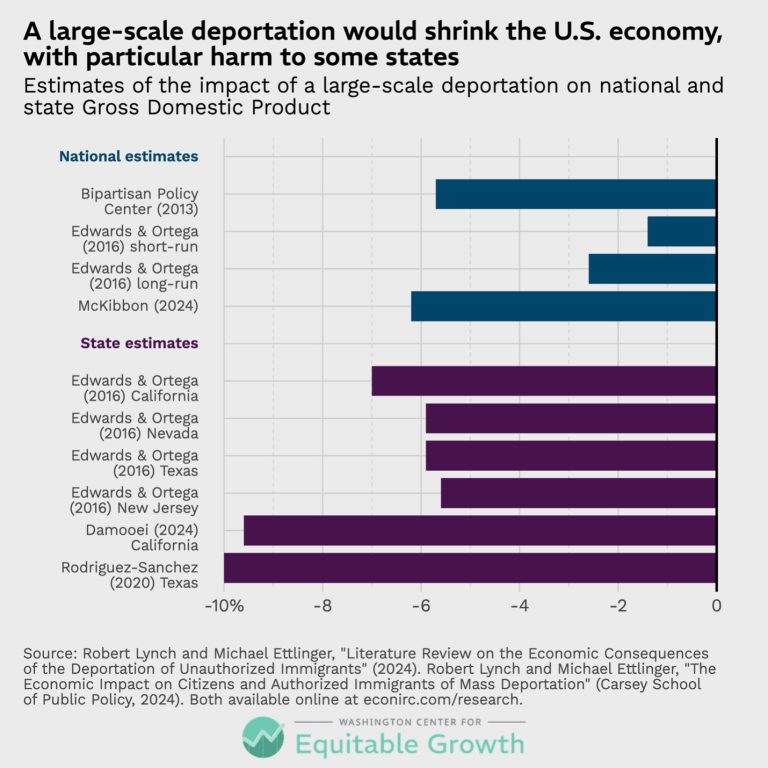
A large-scale deportation would shrink the U.S. economy, with particular harm to some states (opens in a new tab)
Visualizations Aug 31, 2026
 View Chart
(opens in a new tab)
View Chart
(opens in a new tab)
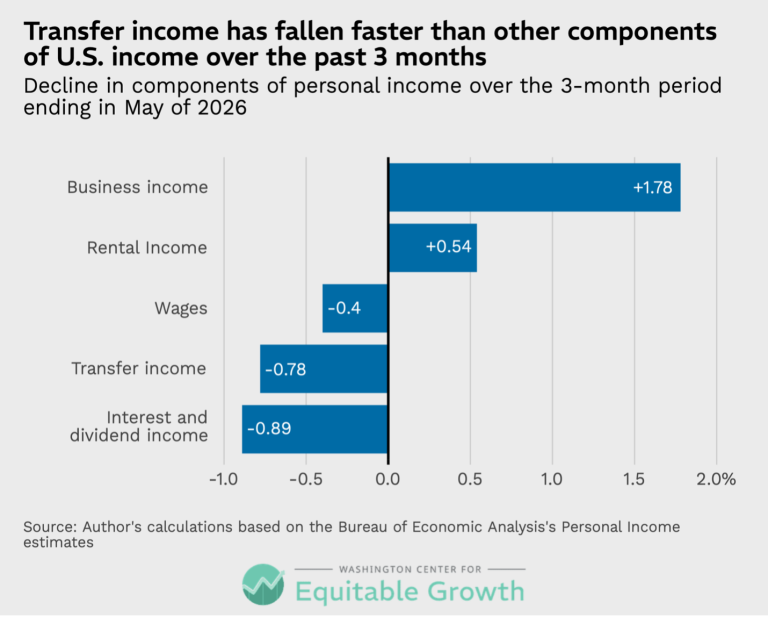
Transfer income has fallen faster than other components of U.S. income over the past 3 months (opens in a new tab)
Visualizations Jun 25, 2026
 View Chart
(opens in a new tab)
View Chart
(opens in a new tab)
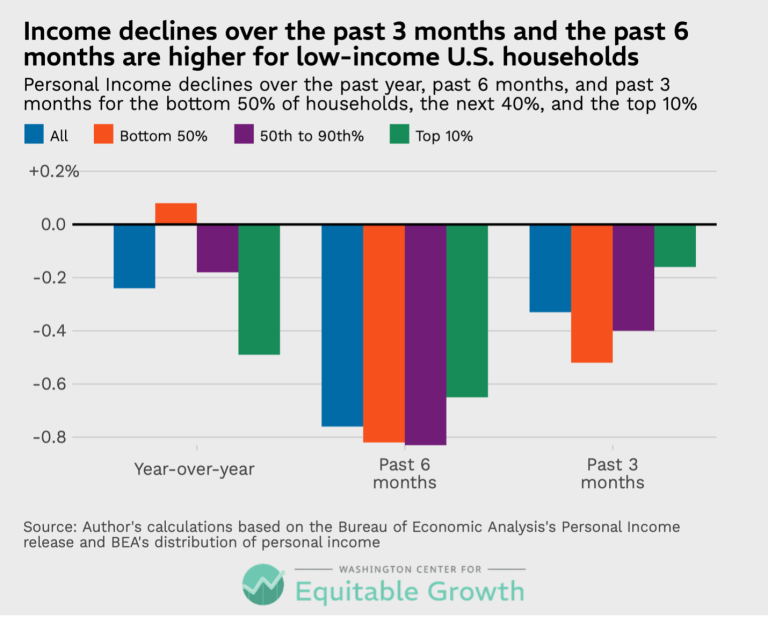
Income declines over the past 3 months and the past 6 months are higher for low-income U.S. households (opens in a new tab)
Visualizations Jun 25, 2026
 View Chart
(opens in a new tab)
View Chart
(opens in a new tab)
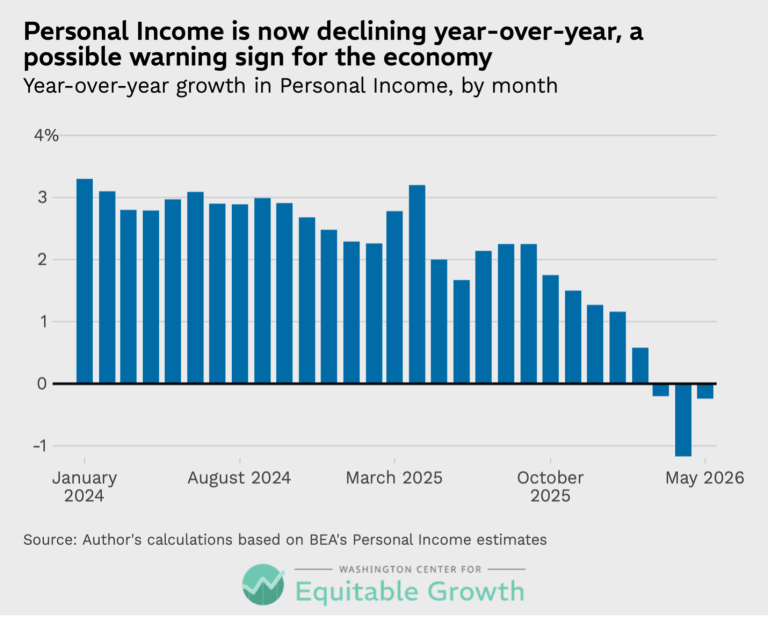
Personal Income is now declining year-over-year, a possible warning sign for the economy (opens in a new tab)
Visualizations Jun 25, 2026
 View Chart
(opens in a new tab)
View Chart
(opens in a new tab)
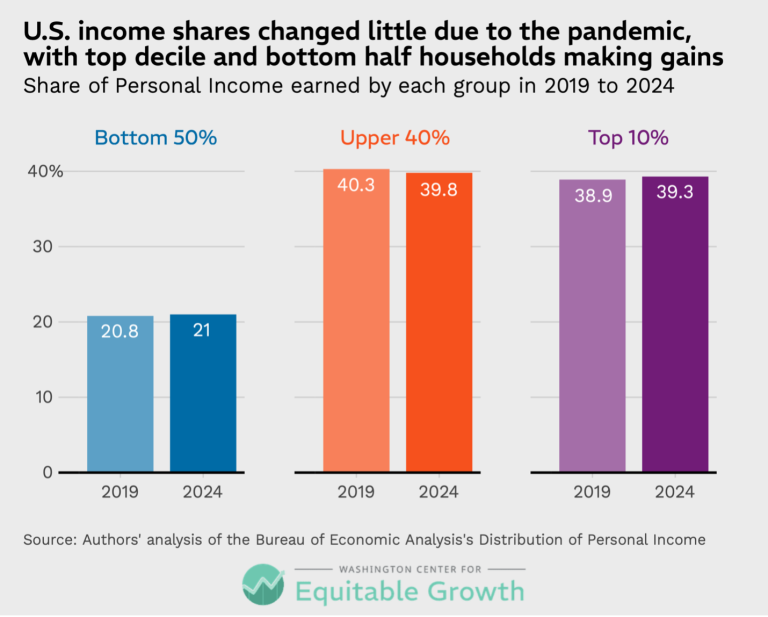
U.S. income shares changed little due to the pandemic, with top decile and bottom half households making gains (opens in a new tab)
Visualizations Jun 24, 2026
 View Chart
(opens in a new tab)
View Chart
(opens in a new tab)
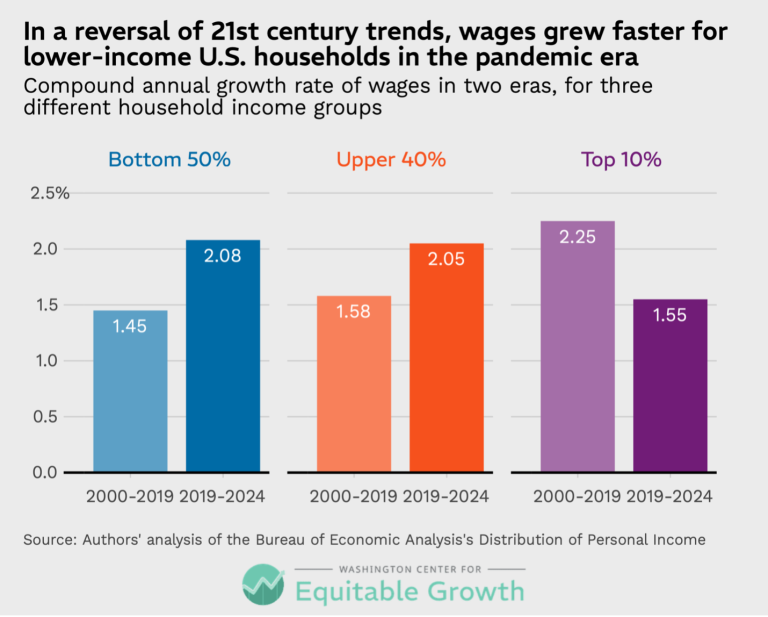
In a reversal of 21st century trends, wages grew faster for lower-income U.S. households in the pandemic era (opens in a new tab)
Visualizations Jun 24, 2026
 View Chart
(opens in a new tab)
View Chart
(opens in a new tab)
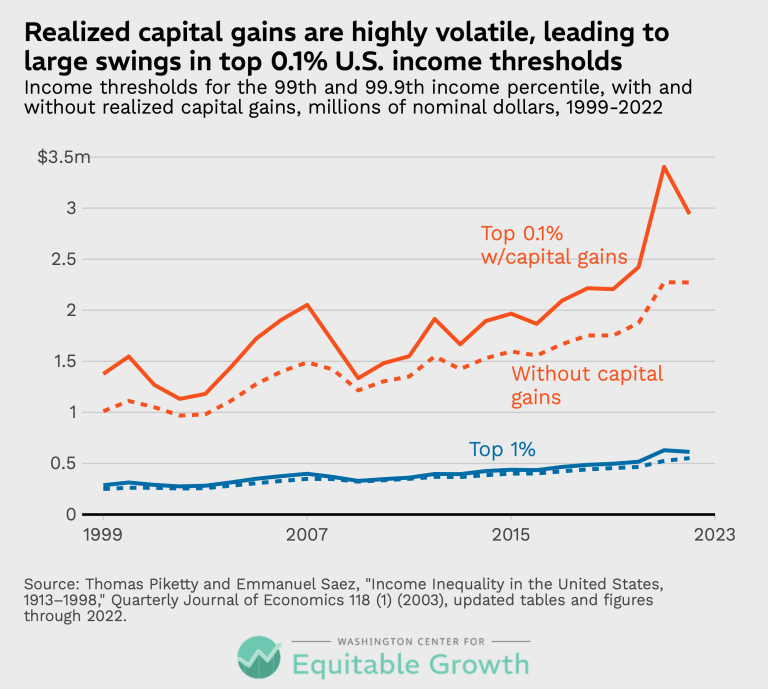
Realized capital gains are highly volatile, leading to large swings in the top 0.1% U.S. income thresholds (opens in a new tab)
Visualizations May 26, 2026
 View Chart
(opens in a new tab)
View Chart
(opens in a new tab)
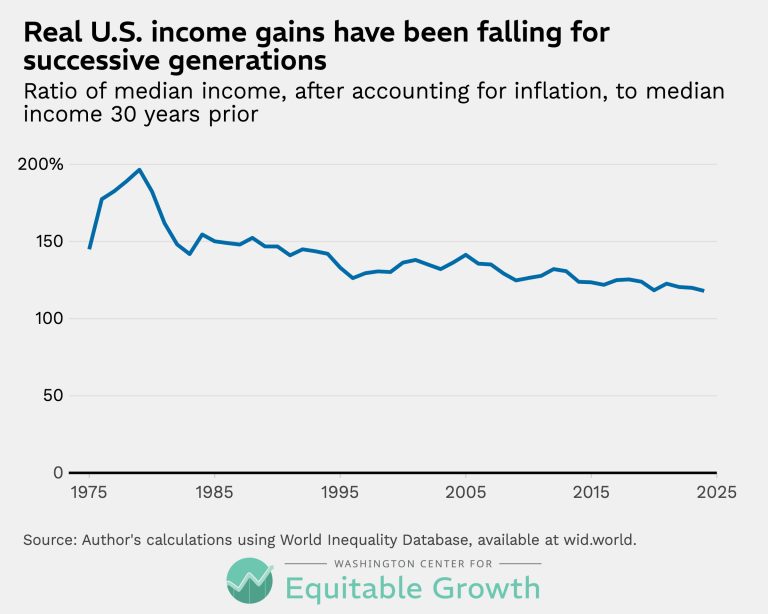
Real U.S. income gains have been falling for successive generations (opens in a new tab)
Visualizations May 13, 2026
 View Chart
(opens in a new tab)
View Chart
(opens in a new tab)
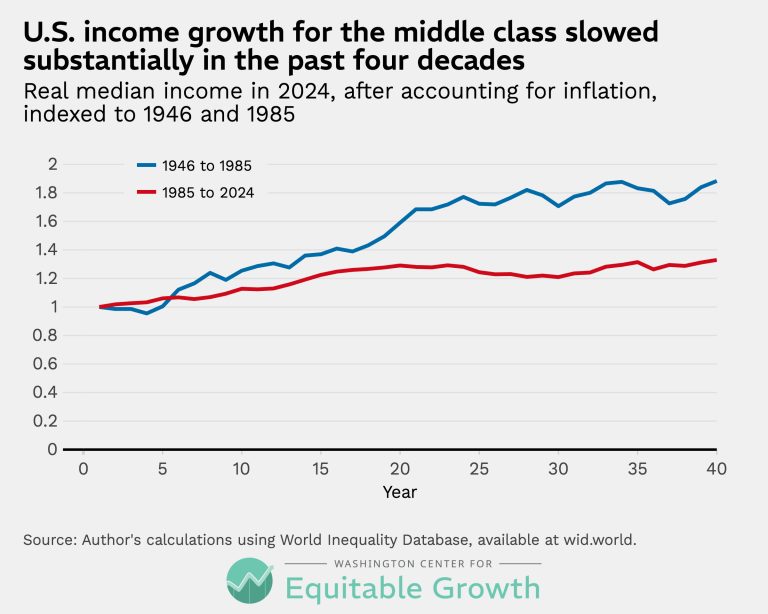
U.S. income growth for the middle class slowed substantially in the past four decades (opens in a new tab)
Visualizations May 13, 2026
 View Chart
(opens in a new tab)
View Chart
(opens in a new tab)
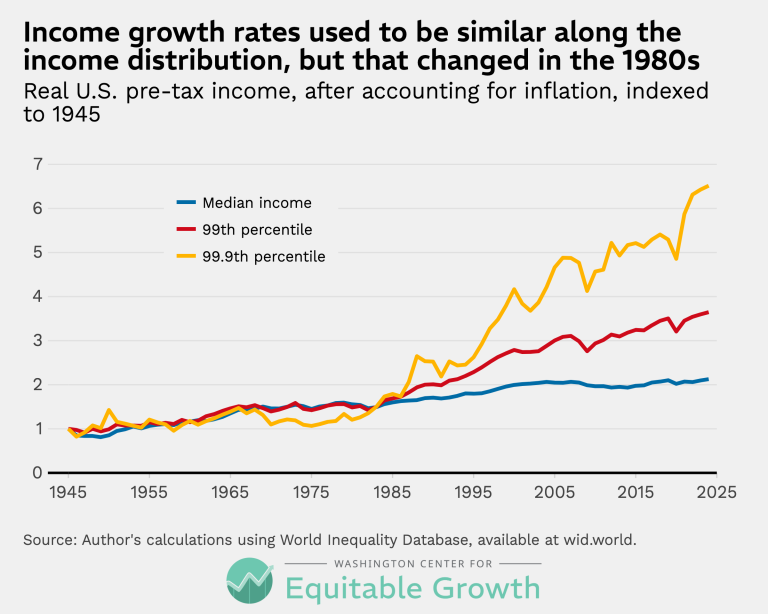
Income growth rates used to be similar along the income distribution, but that changed in the 1980s (opens in a new tab)
Visualizations May 13, 2026
 View Chart
(opens in a new tab)
View Chart
(opens in a new tab)
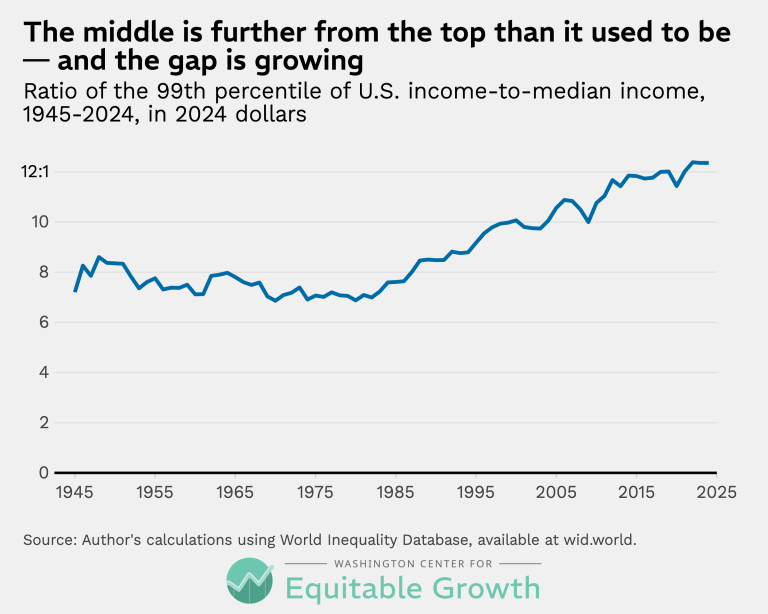
The middle is further from the top than it used to be—and the gap is growing (opens in a new tab)
Visualizations May 13, 2026
 View Chart
(opens in a new tab)
View Chart
(opens in a new tab)
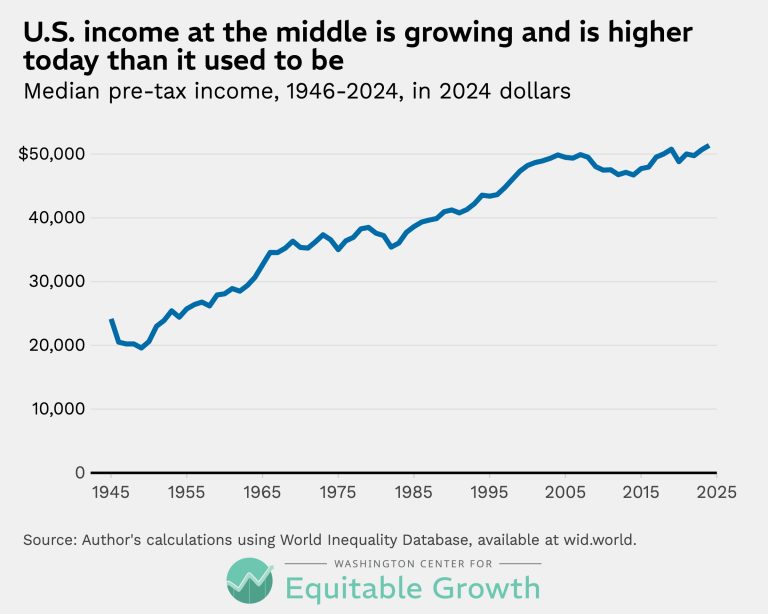
U.S. income at the middle is growing and is higher today than it used to be (opens in a new tab)
Visualizations May 13, 2026
 View Chart
(opens in a new tab)
View Chart
(opens in a new tab)
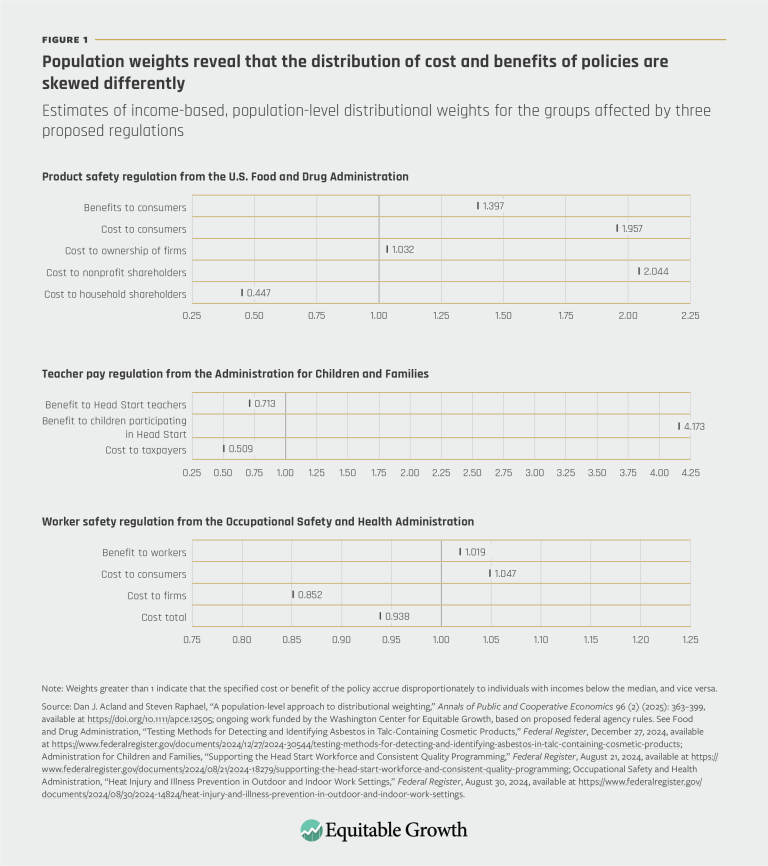
Population weights reveal that the distribution of cost and benefits of policies are skewed differently (opens in a new tab)
Visualizations Nov 13, 2025
 View Chart
(opens in a new tab)
View Chart
(opens in a new tab)
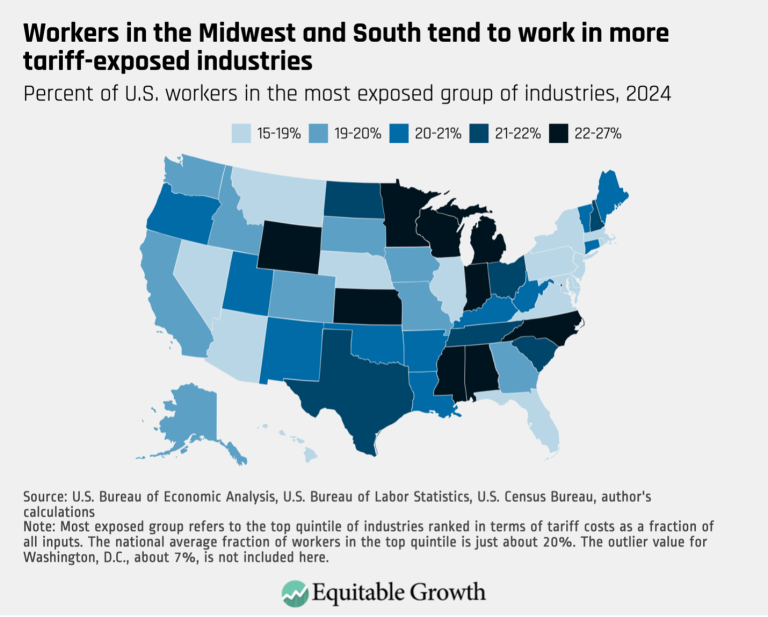
Workers in the Midwest and South tend to work in more tariff-exposed industries (opens in a new tab)
Visualizations Nov 3, 2025
 View Chart
(opens in a new tab)
View Chart
(opens in a new tab)
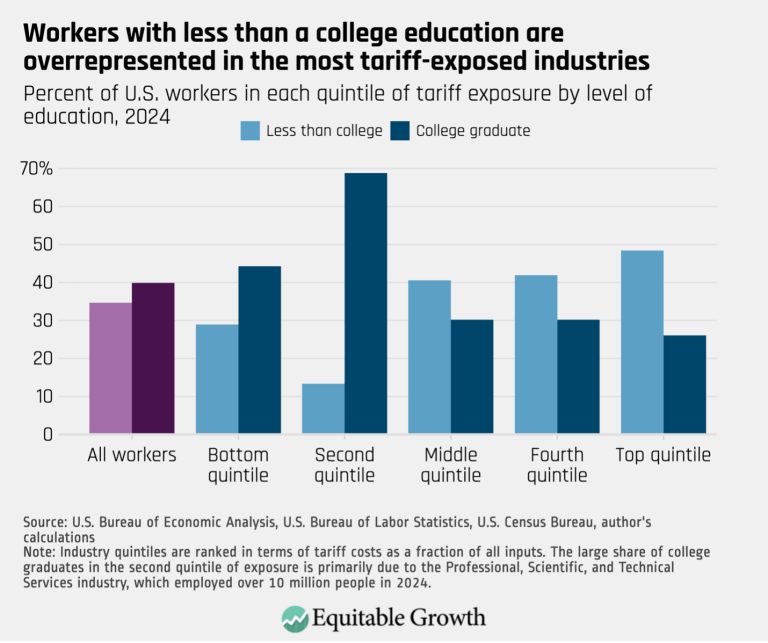
Workers with less than a college education are overrepresented in the most tariff-exposed industries (opens in a new tab)
Visualizations Nov 3, 2025
 View Chart
(opens in a new tab)
View Chart
(opens in a new tab)
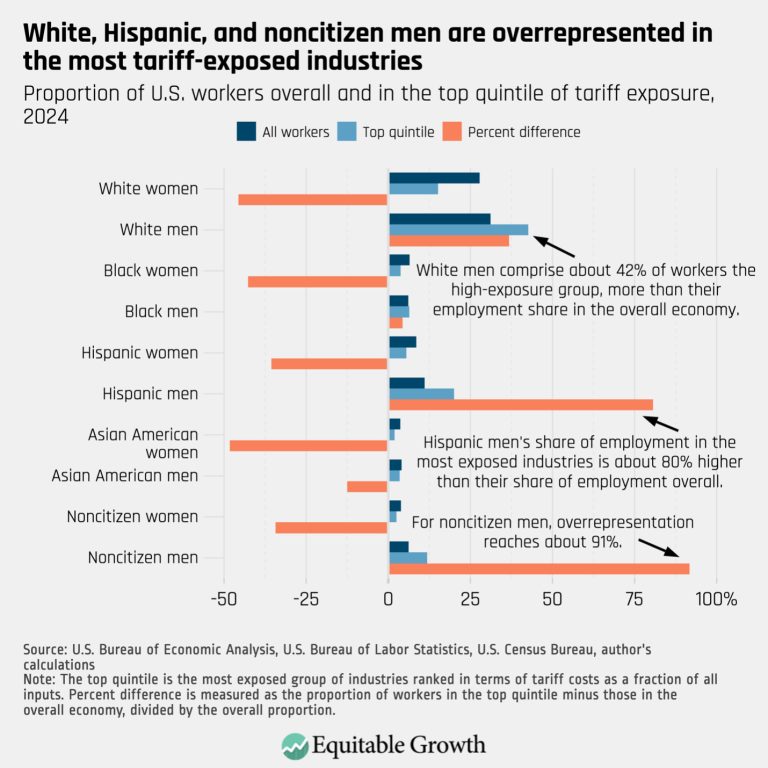
White, Hispanic, and noncitizen men are overrepresented in the most tariff-exposed industries (opens in a new tab)
Visualizations Nov 3, 2025
 View Chart
(opens in a new tab)
View Chart
(opens in a new tab)
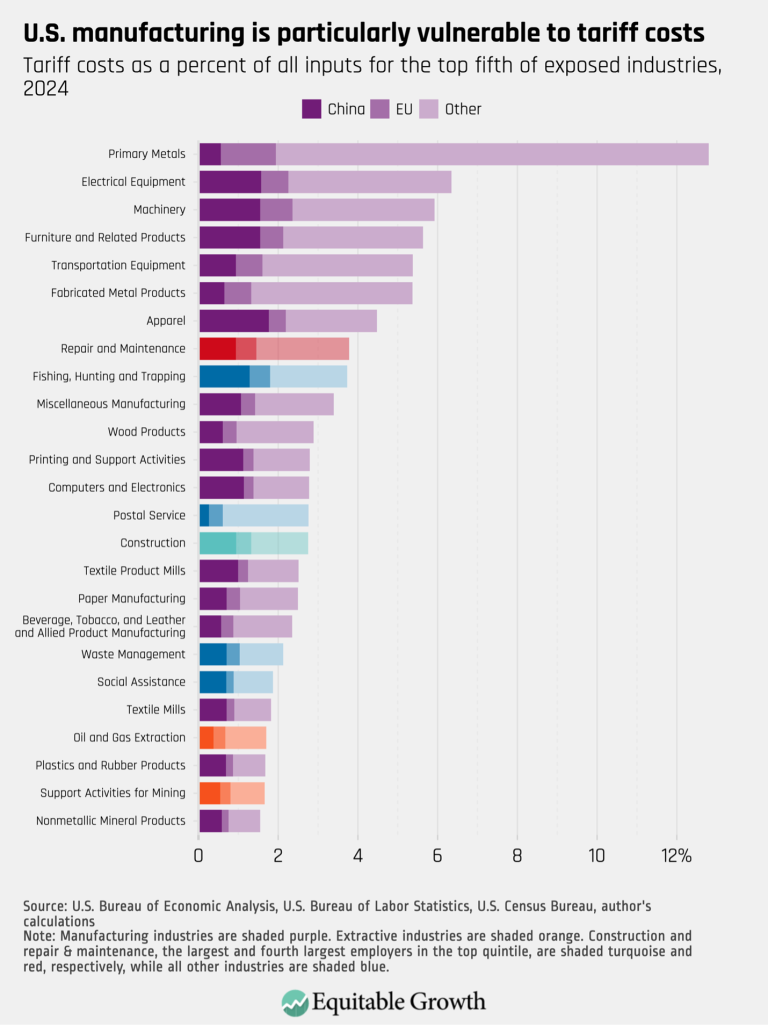
U.S. manufacturing is particularly vulnerable to tariff costs (opens in a new tab)
Visualizations Nov 3, 2025
 View Chart
(opens in a new tab)
View Chart
(opens in a new tab)
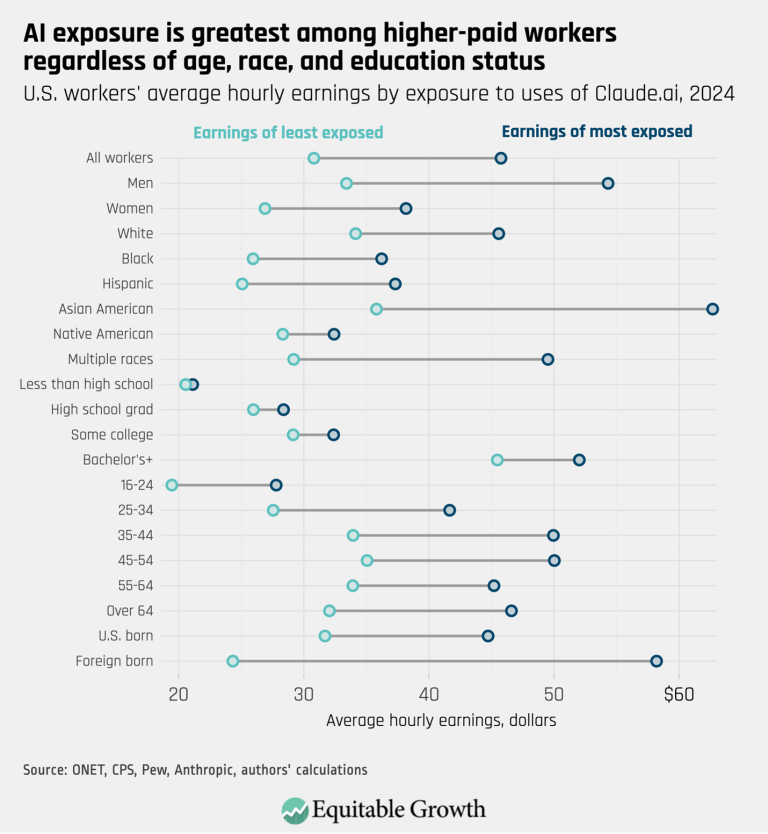
AI exposure is greatest among higher-paid workers regardless of age, race and education status (opens in a new tab)
Visualizations Oct 22, 2025
 View Chart
(opens in a new tab)
View Chart
(opens in a new tab)
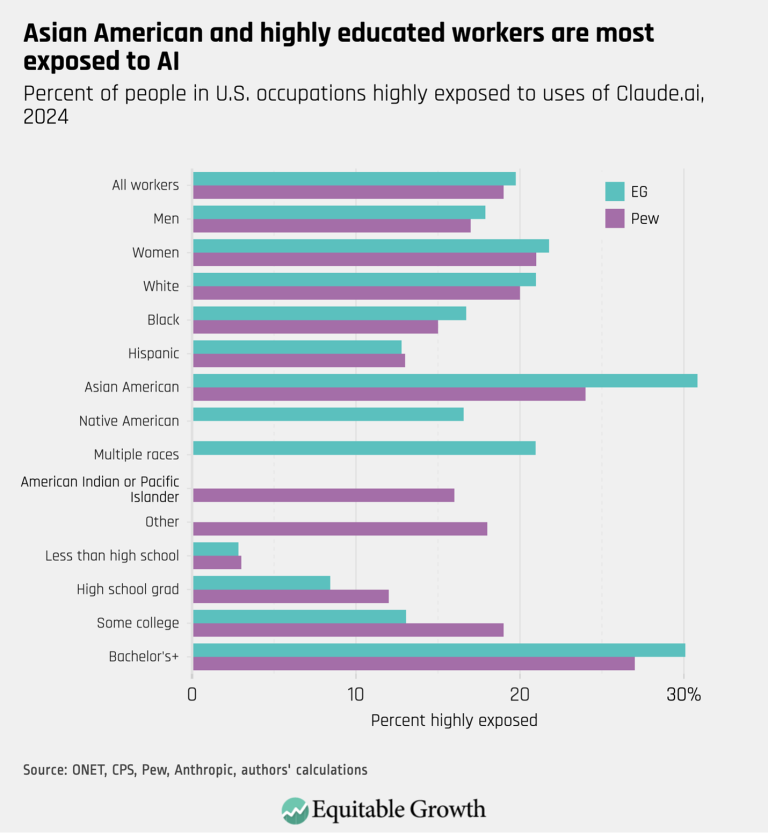
Asian American and highly educated workers are most exposed to AI (opens in a new tab)
Visualizations Oct 22, 2025
 View Chart
(opens in a new tab)
View Chart
(opens in a new tab)
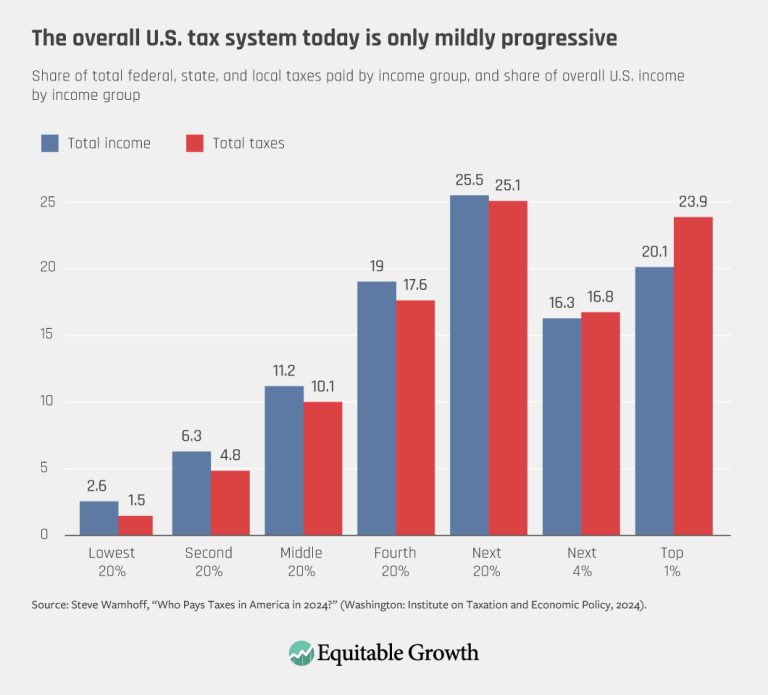
The overall U.S. tax system today is only mildly progressive (opens in a new tab)
Visualizations Sep 10, 2025
 View Chart
(opens in a new tab)
View Chart
(opens in a new tab)
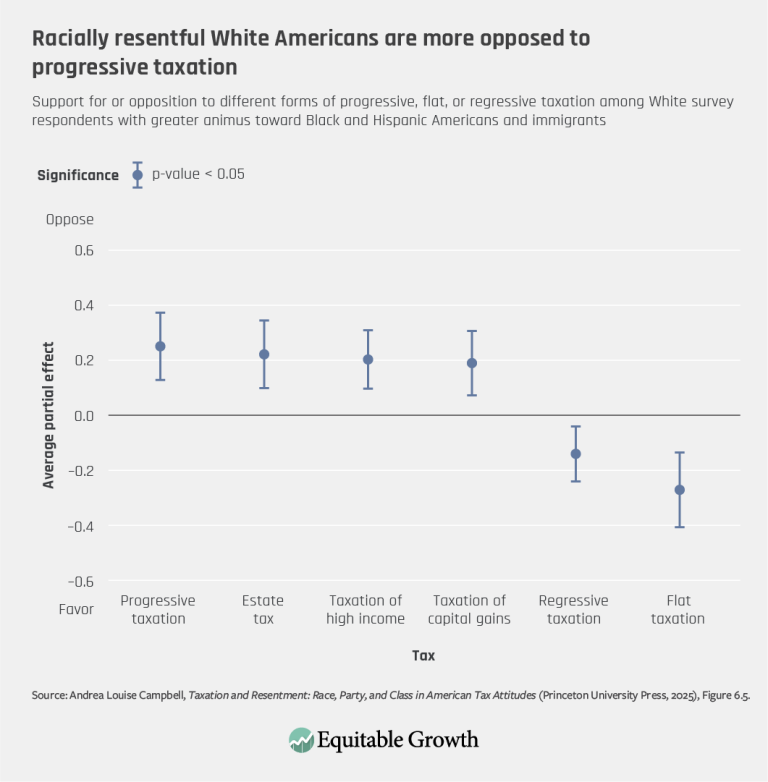
Racially resentful White Americans are more opposed to progressive taxation (opens in a new tab)
Visualizations Sep 9, 2025
 View Chart
(opens in a new tab)
View Chart
(opens in a new tab)
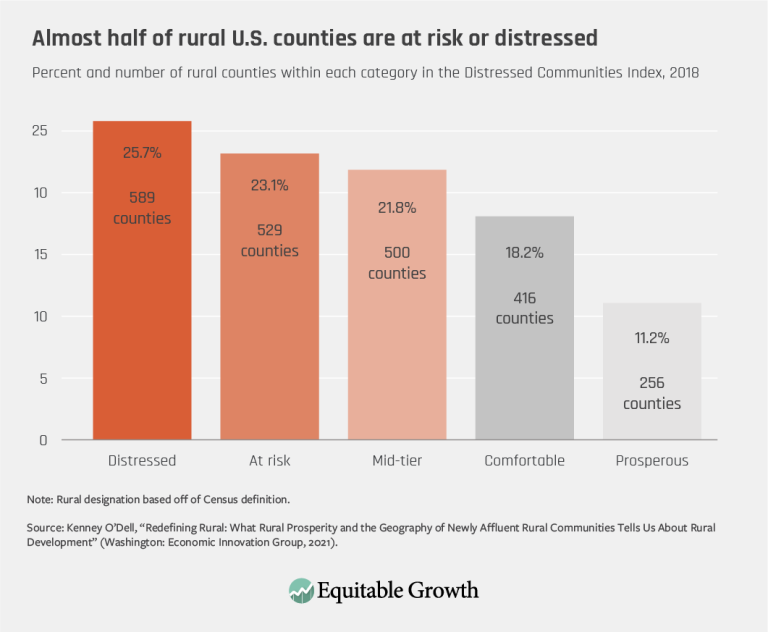
Almost half of rural U.S. counties are at risk or distressed (opens in a new tab)
Visualizations Sep 8, 2025
 View Chart
(opens in a new tab)
View Chart
(opens in a new tab)
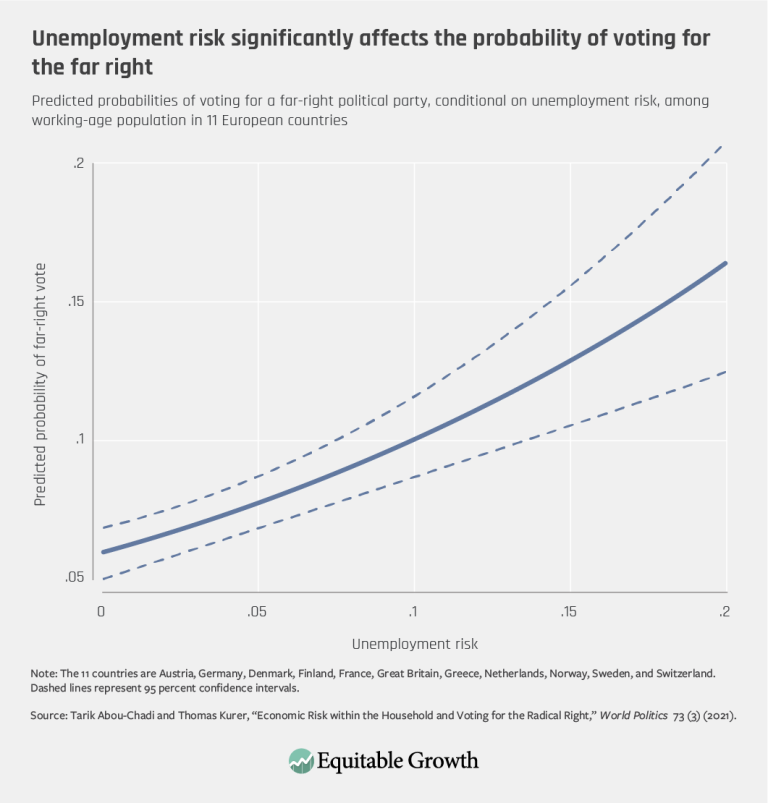
Unemployment risk significantly affects the probability of voting for the far right (opens in a new tab)
Visualizations Sep 5, 2025
 View Chart
(opens in a new tab)
View Chart
(opens in a new tab)
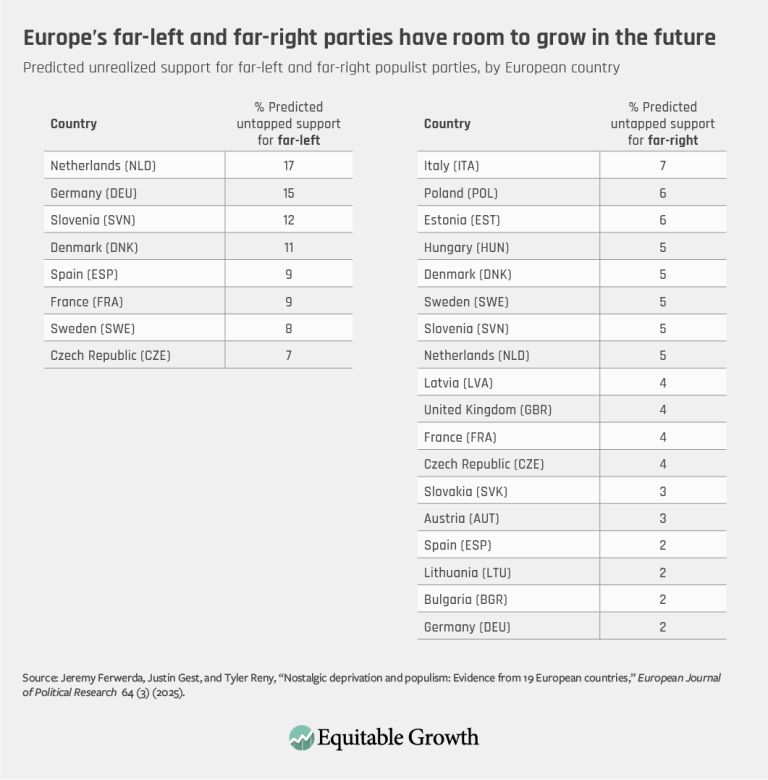
Europe’s far-left and far-right parties have room to grow in the future (opens in a new tab)
Visualizations Sep 4, 2025
 View Chart
(opens in a new tab)
View Chart
(opens in a new tab)
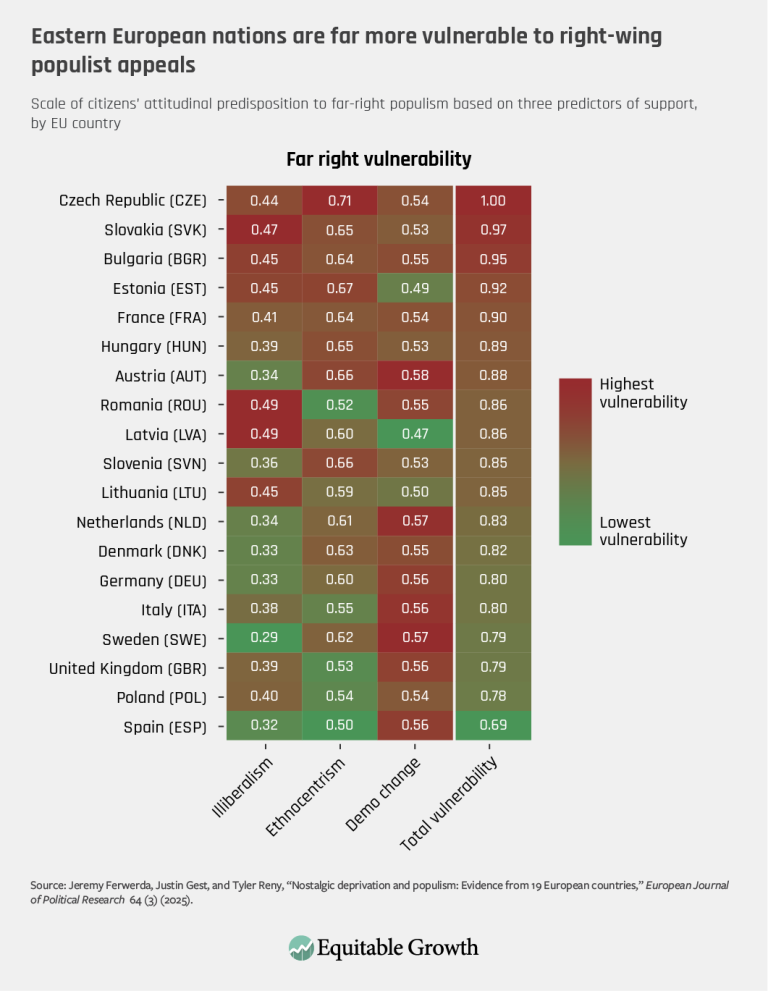
Eastern European nations are far more vulnerable to right-wing populist appeals (opens in a new tab)
Visualizations Sep 4, 2025
 View Chart
(opens in a new tab)
View Chart
(opens in a new tab)
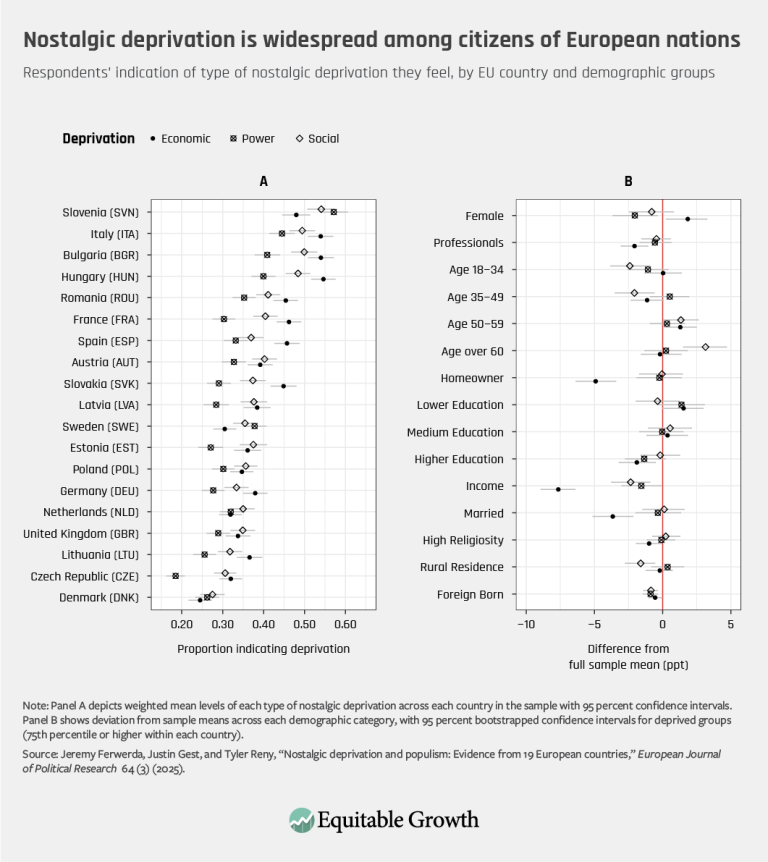
Nostalgic deprivation is widespread among citizens of European nations (opens in a new tab)
Visualizations Sep 4, 2025
 View Chart
(opens in a new tab)
View Chart
(opens in a new tab)
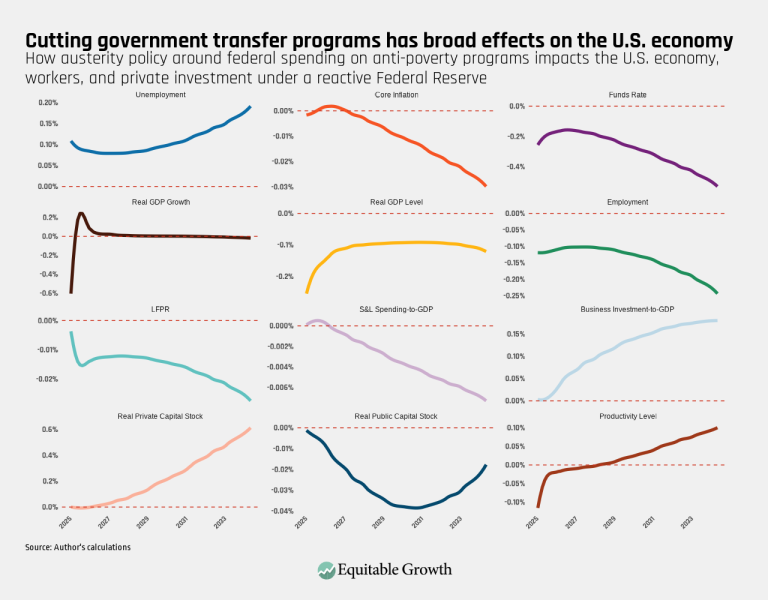
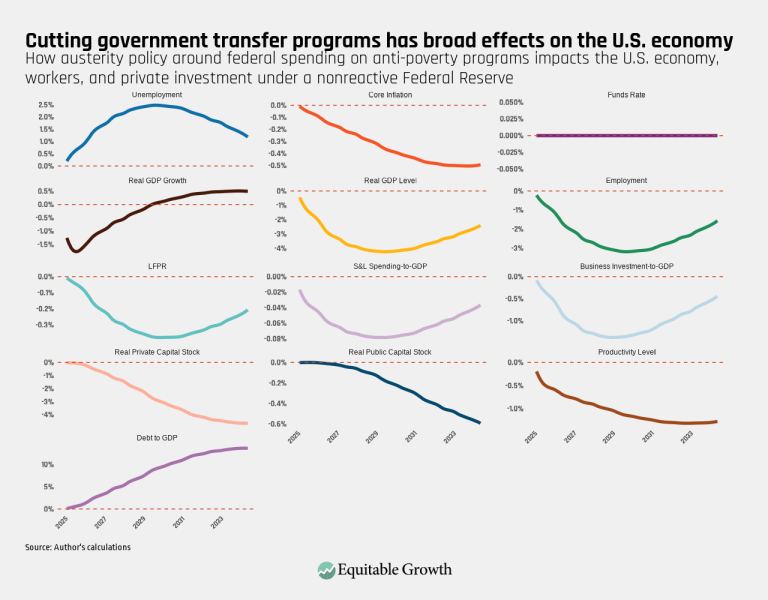
Cutting government transfer programs has broad effects on the U.S. economy (opens in a new tab)
Visualizations Aug 12, 2025
 View Chart
(opens in a new tab)
View Chart
(opens in a new tab)
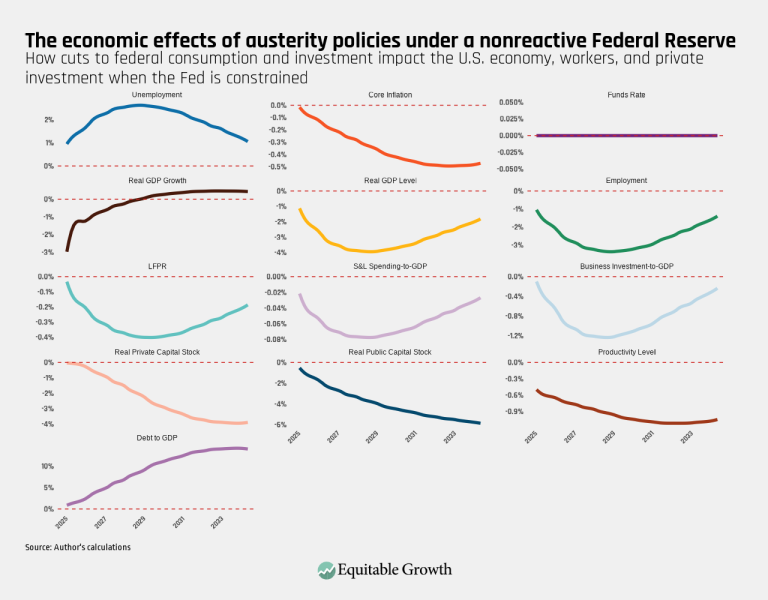
Cutting government transfer programs has broad effects on the U.S. economy (opens in a new tab)
Visualizations Aug 12, 2025
 View Chart
(opens in a new tab)
View Chart
(opens in a new tab)
The economic effects of austerity policies under a nonreactive Federal Reserve – Final (opens in a new tab)
Visualizations Aug 12, 2025
 View Chart
(opens in a new tab)
View Chart
(opens in a new tab)
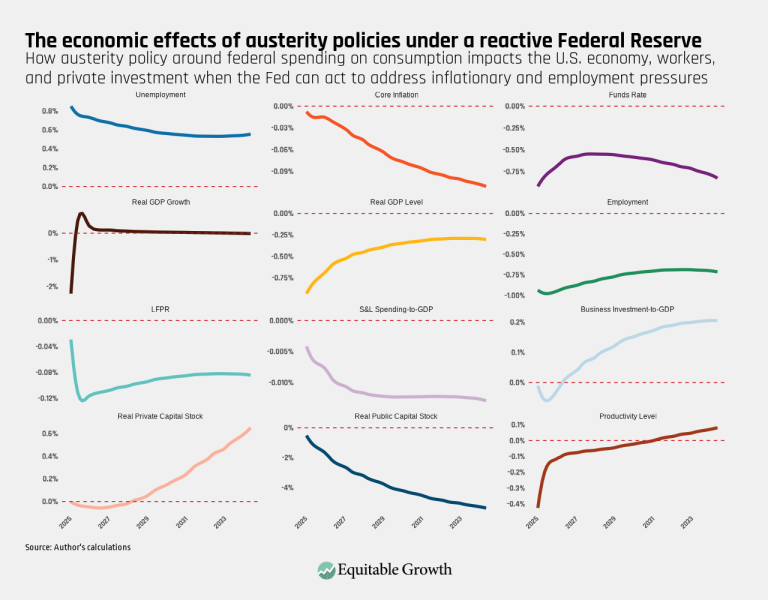
The economic effects of austerity policies under a reactive Federal Reserve (opens in a new tab)
Visualizations Aug 12, 2025
 View Chart
(opens in a new tab)
View Chart
(opens in a new tab)
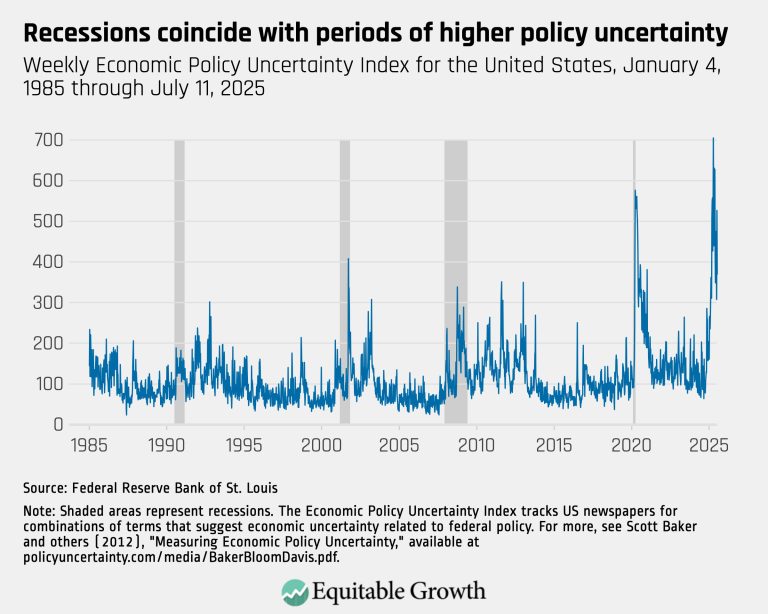
Recessions coincide with periods of higher policy uncertainty – updated (opens in a new tab)
Visualizations Aug 7, 2025
 View Chart
(opens in a new tab)
View Chart
(opens in a new tab)
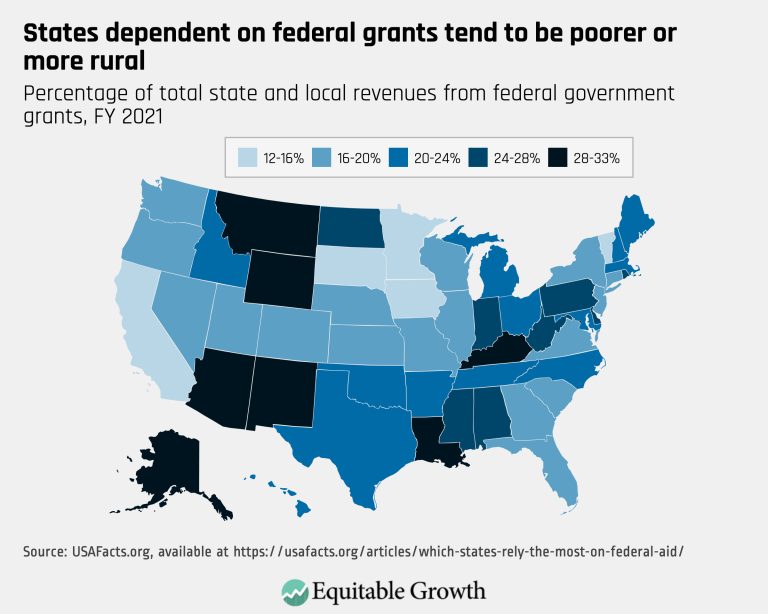
States dependent on federal grants tend to be poorer or more rural (opens in a new tab)
Visualizations Aug 7, 2025
 View Chart
(opens in a new tab)
View Chart
(opens in a new tab)
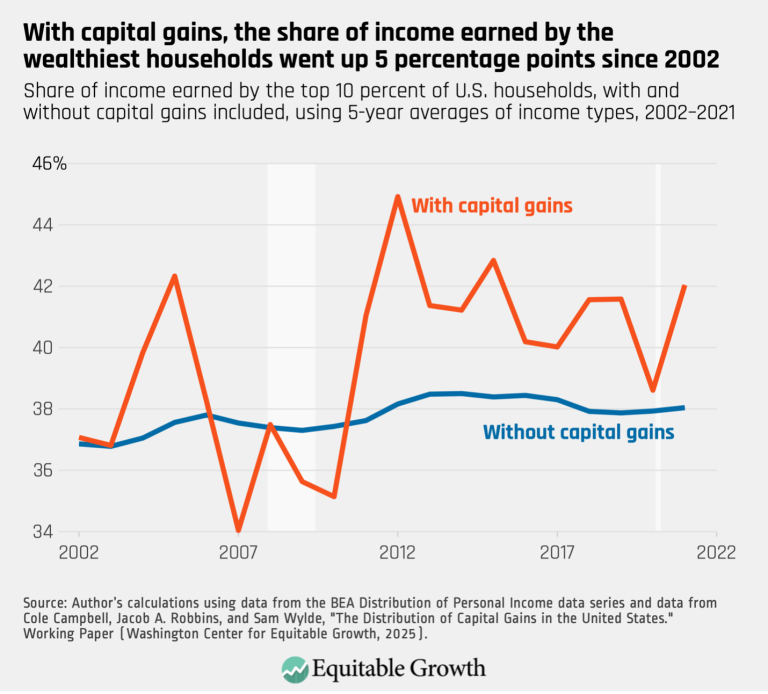
With capital gains, the share of income earned by the wealthiest households went up 5 percentage points since 2002 (opens in a new tab)
Visualizations Jul 14, 2025
 View Chart
(opens in a new tab)
View Chart
(opens in a new tab)
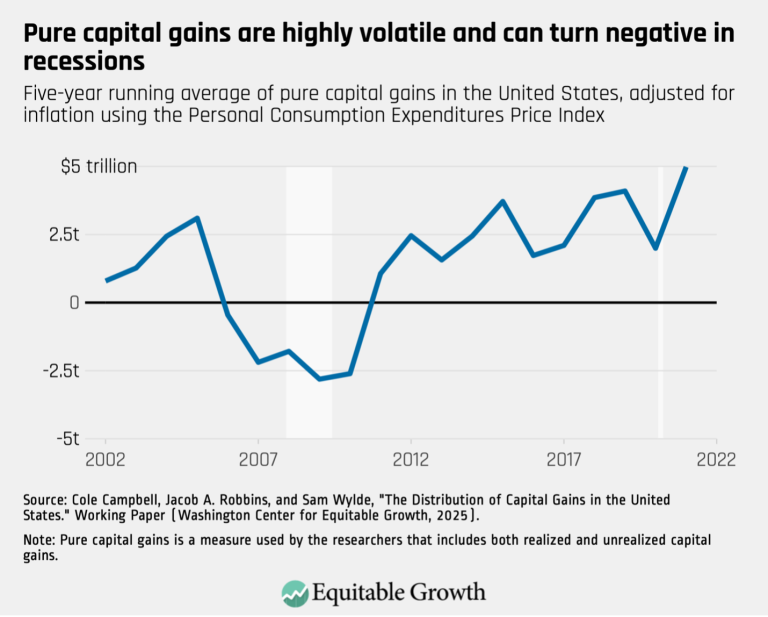
Pure capital gains are highly volatile and can turn negative in recessions (opens in a new tab)
Visualizations Jul 14, 2025
 View Chart
(opens in a new tab)
View Chart
(opens in a new tab)
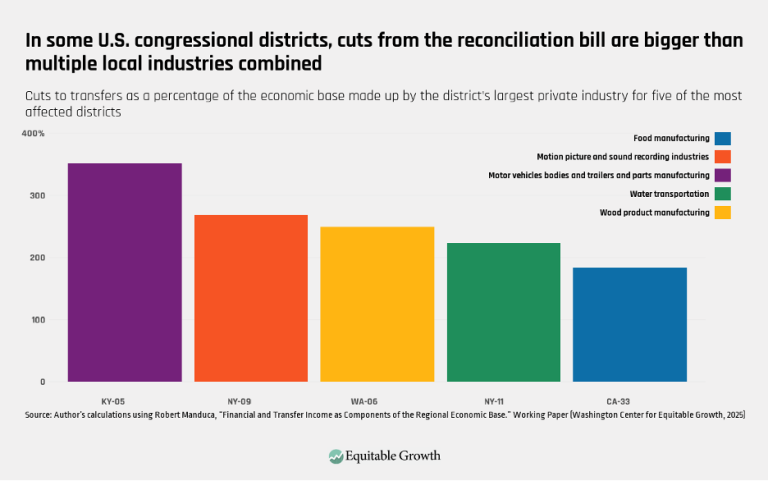
In some U.S. congressional districts, cuts from the reconciliation bill are bigger than multiple local industries combined (opens in a new tab)
Visualizations Jul 10, 2025
 View Chart
(opens in a new tab)
View Chart
(opens in a new tab)
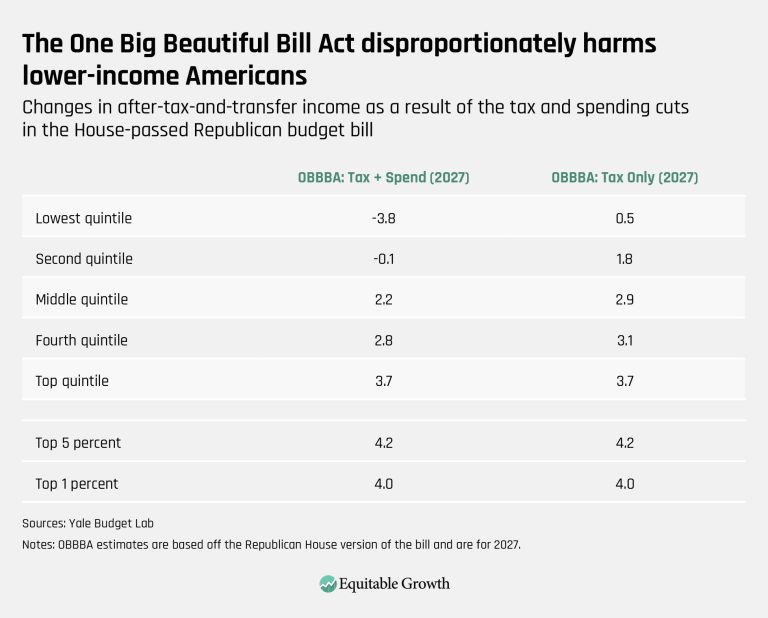
The One Big Beautiful Bill Act disproportionately harms lower-income Americans (opens in a new tab)
Visualizations Jul 3, 2025
 View Chart
(opens in a new tab)
View Chart
(opens in a new tab)
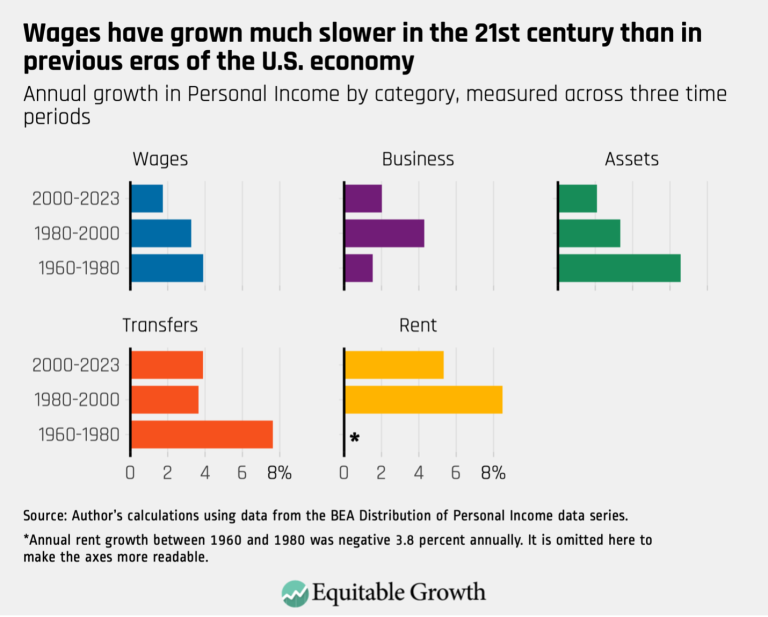
Wages have grown much slower in the 21st century than in previous eras of the U.S. economy (opens in a new tab)
Visualizations Jun 25, 2025
 View Chart
(opens in a new tab)
View Chart
(opens in a new tab)
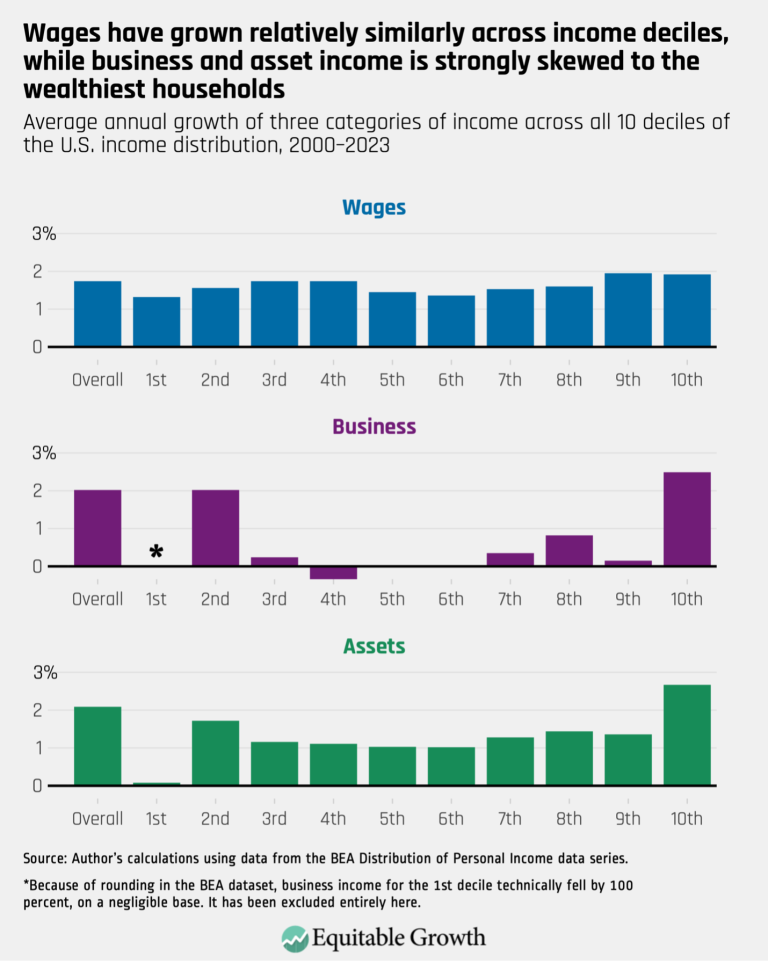
Wages have grown relatively similarly across income deciles, while business and asset income is strongly skewed to the wealthiest households (opens in a new tab)
Visualizations Jun 25, 2025
 View Chart
(opens in a new tab)
View Chart
(opens in a new tab)
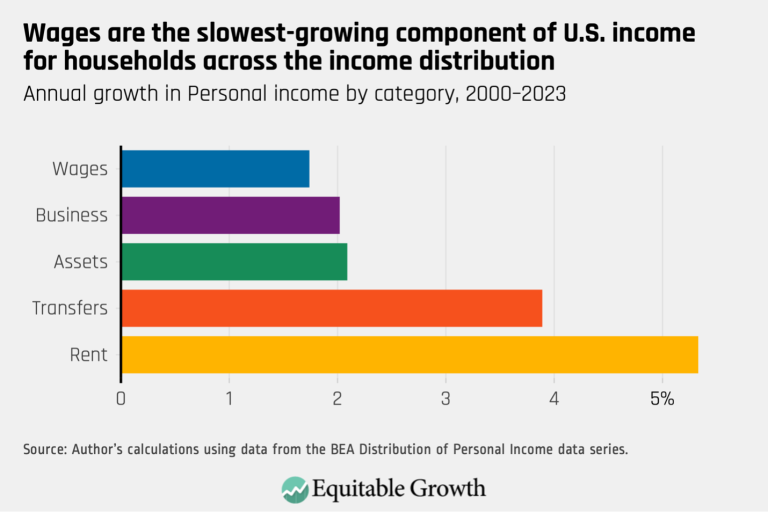
Wages are the slowest-growing component of U.S. income for households across the income distribution (opens in a new tab)
Visualizations Jun 25, 2025
 View Chart
(opens in a new tab)
View Chart
(opens in a new tab)
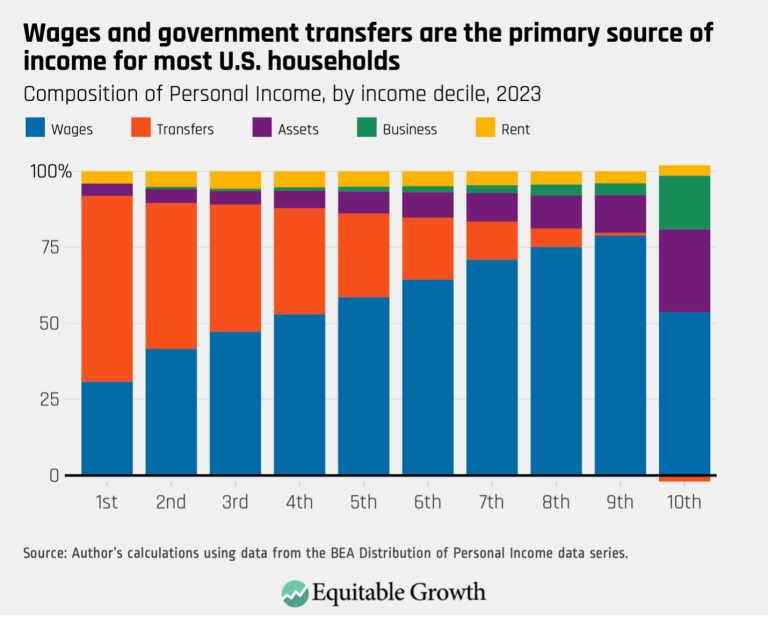
Wages and government transfers are the primary source of income for most U.S. households (opens in a new tab)
Visualizations Jun 25, 2025
 View Chart
(opens in a new tab)
View Chart
(opens in a new tab)
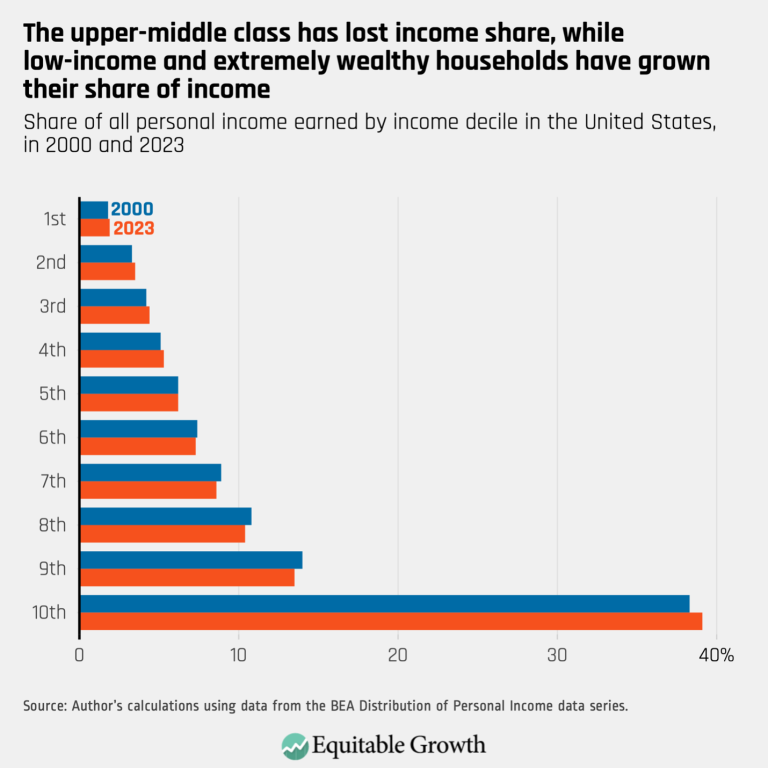
The upper-middle class has lost income share, while low-income and extremely wealthy households have grown their share of income (opens in a new tab)
Visualizations Jun 25, 2025
 View Chart
(opens in a new tab)
View Chart
(opens in a new tab)
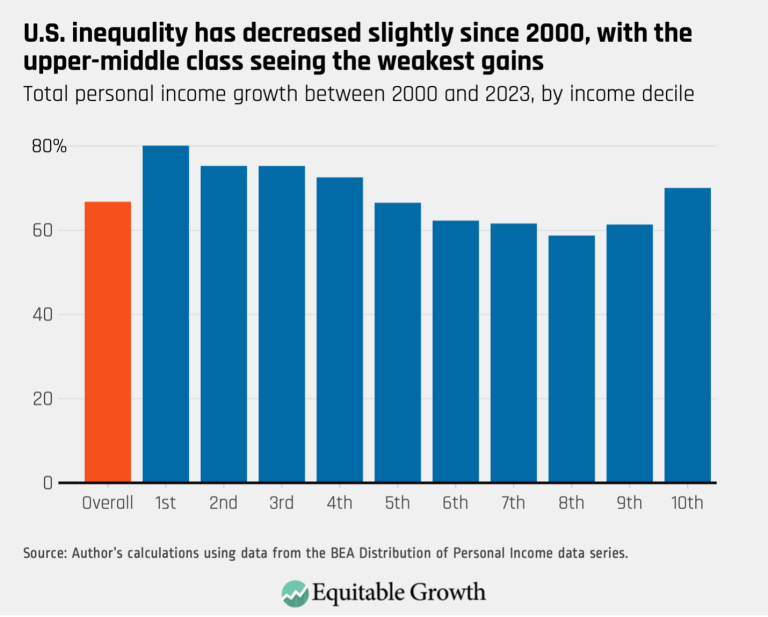
U.S. inequality has decreased slightly since 2000, with the upper-middle class seeing the weakest gains (opens in a new tab)
Visualizations Jun 25, 2025
 View Chart
(opens in a new tab)
View Chart
(opens in a new tab)
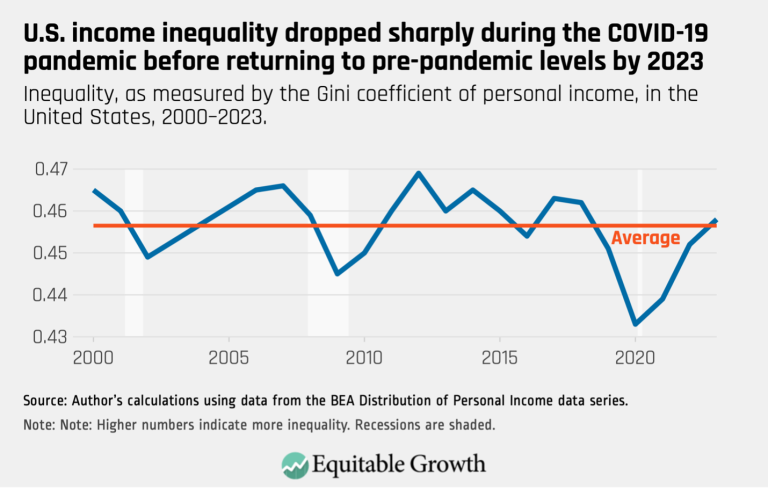
U.S. income inequality dropped sharply during the COVID-19 pandemic before returning to pre-pandemic levels by 2023 (opens in a new tab)
Visualizations Jun 25, 2025
 View Chart
(opens in a new tab)
View Chart
(opens in a new tab)
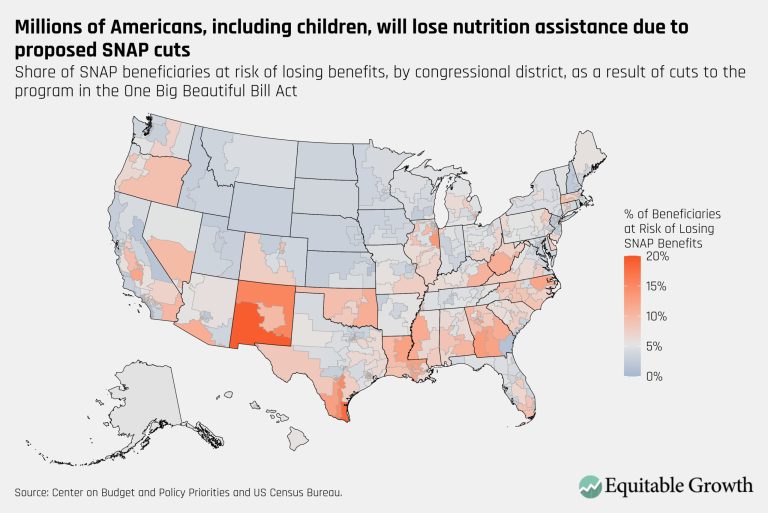
Millions of Americans, including children, will lose nutrition assistance due to proposed SNAP cuts – updated (opens in a new tab)
Visualizations Jun 24, 2025
 View Chart
(opens in a new tab)
View Chart
(opens in a new tab)
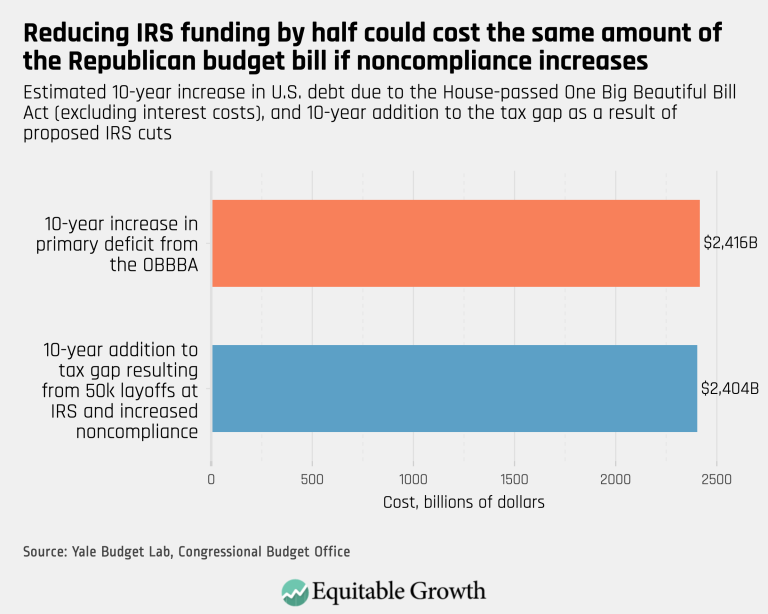
Reducing IRS funding by half could cost the same amount of the Republican budget bill in noncompliance increases (opens in a new tab)
Visualizations Jun 23, 2025
 View Chart
(opens in a new tab)
View Chart
(opens in a new tab)
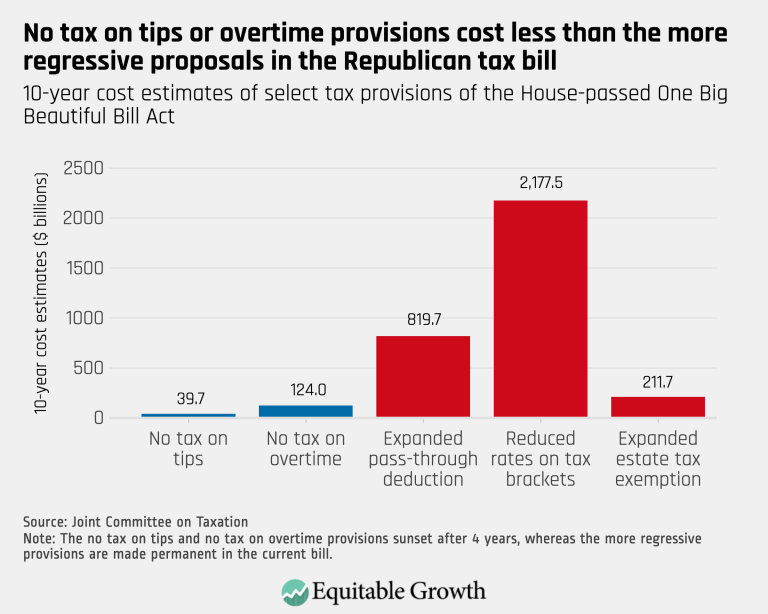
No tax on tips or overtime provisions cost less than the more regressive proposals in the Republican tax bill (opens in a new tab)
Visualizations Jun 23, 2025
 View Chart
(opens in a new tab)
View Chart
(opens in a new tab)
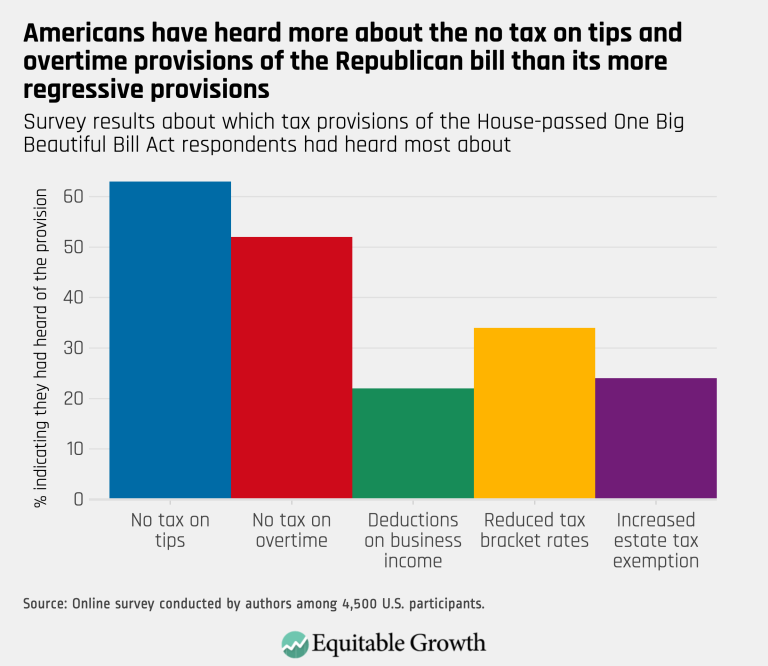
Americans have heard more about the no tax on tips and overtime provisions of the Republican bill than its more regressive provisions (opens in a new tab)
Visualizations Jun 23, 2025
 View Chart
(opens in a new tab)
View Chart
(opens in a new tab)
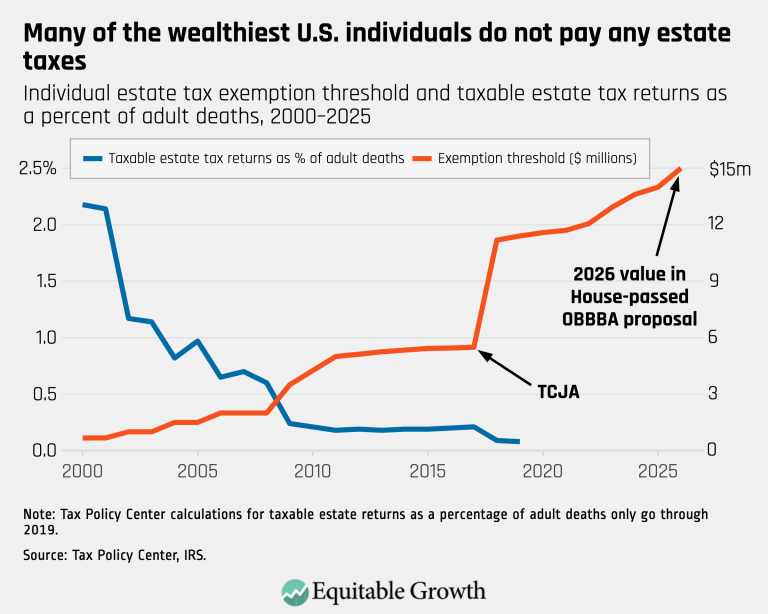
Many of the wealthiest U.S. individuals do not pay any estate taxes (opens in a new tab)
Visualizations Jun 23, 2025
 View Chart
(opens in a new tab)
View Chart
(opens in a new tab)
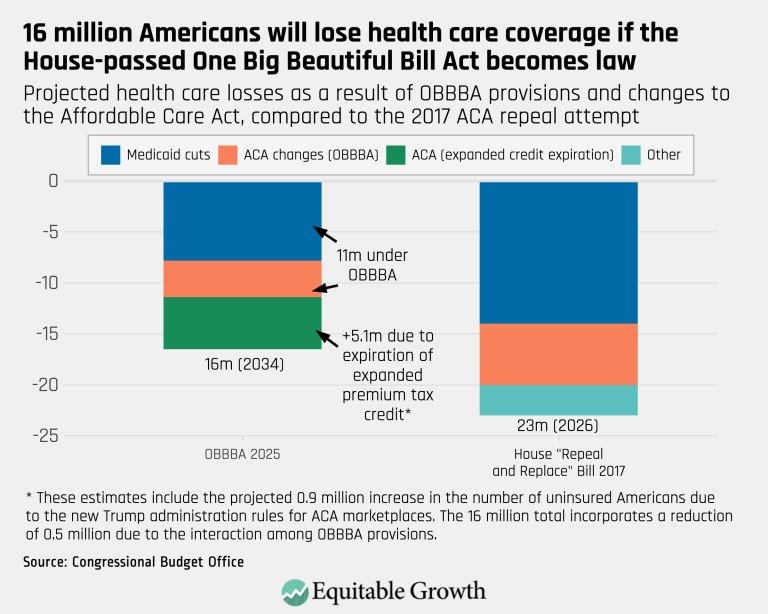
16 million Americans will lose health care coverage if the House-passed One Big Beautiful Bill Act becomes law (opens in a new tab)
Visualizations Jun 23, 2025
 View Chart
(opens in a new tab)
View Chart
(opens in a new tab)
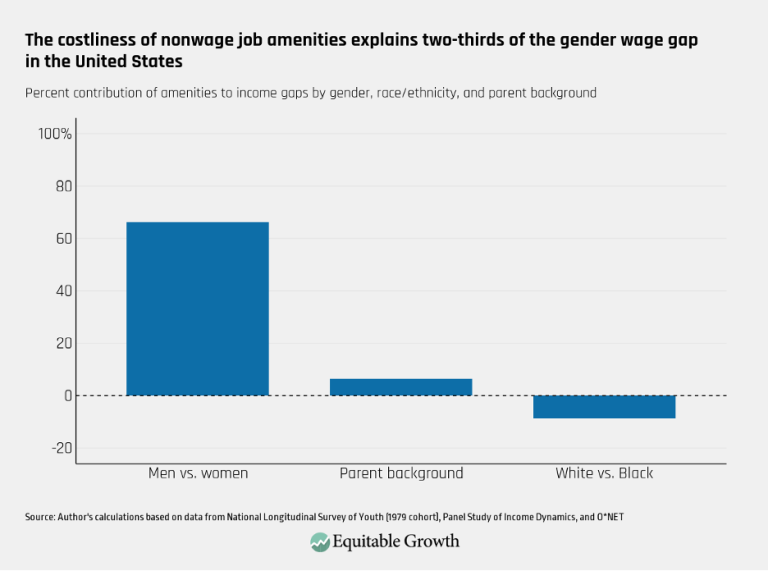
The costliness of nonwage job amenities explains two-thirds of the gender wage gap in the United States (opens in a new tab)
Visualizations Jun 10, 2025
 View Chart
(opens in a new tab)
View Chart
(opens in a new tab)
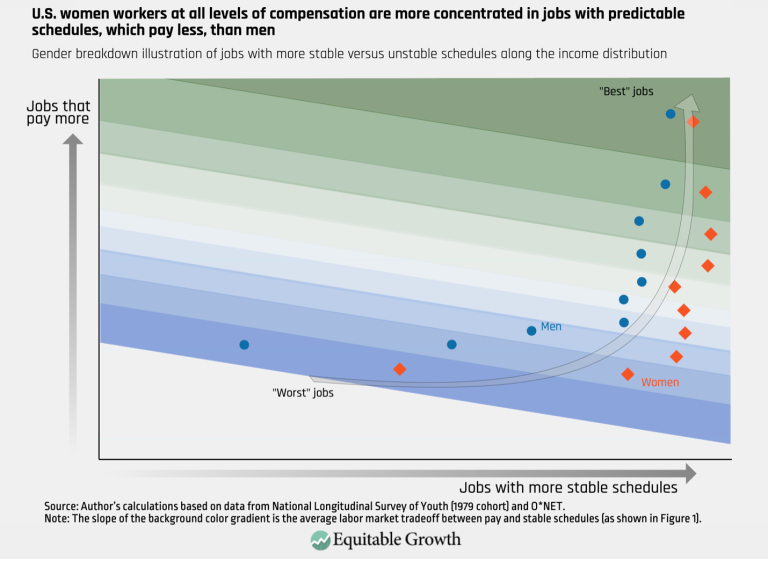
U.S. women workers at all levels of compensation are more concentrated in jobs with predictable schedules, which pay less, than men (opens in a new tab)
Visualizations Jun 10, 2025
 View Chart
(opens in a new tab)
View Chart
(opens in a new tab)
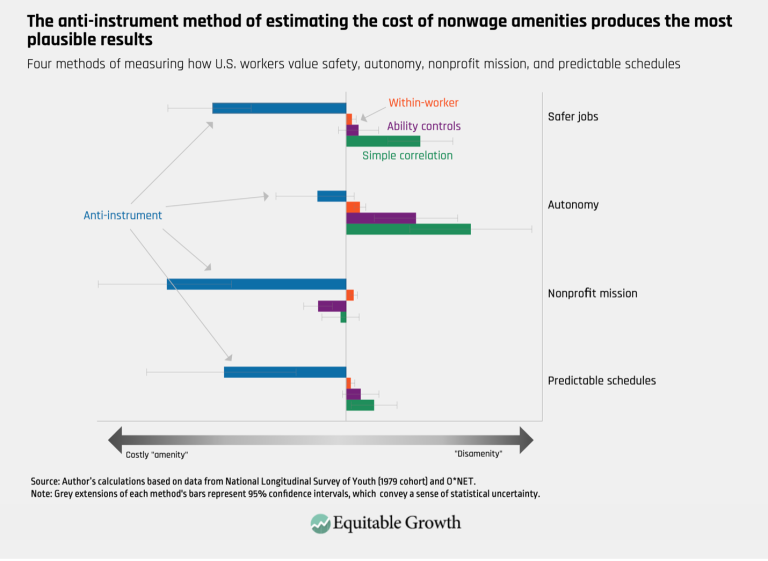
The anti-instrument method of estimating the cost of nonwage amenities produces the most plausible results (opens in a new tab)
Visualizations Jun 10, 2025
 View Chart
(opens in a new tab)
View Chart
(opens in a new tab)
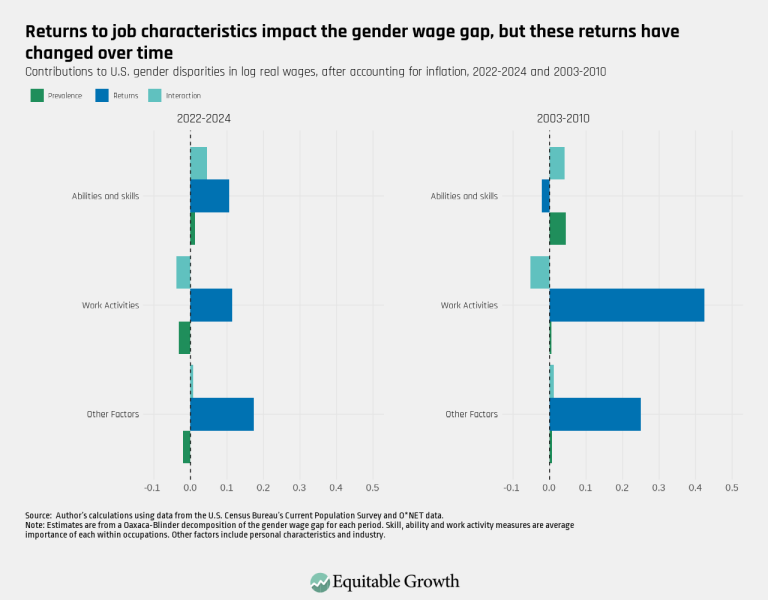
Returns to job characteristics impact the gender wage gap, but these returns have changed over time (opens in a new tab)
Visualizations Jun 4, 2025
 View Chart
(opens in a new tab)
View Chart
(opens in a new tab)
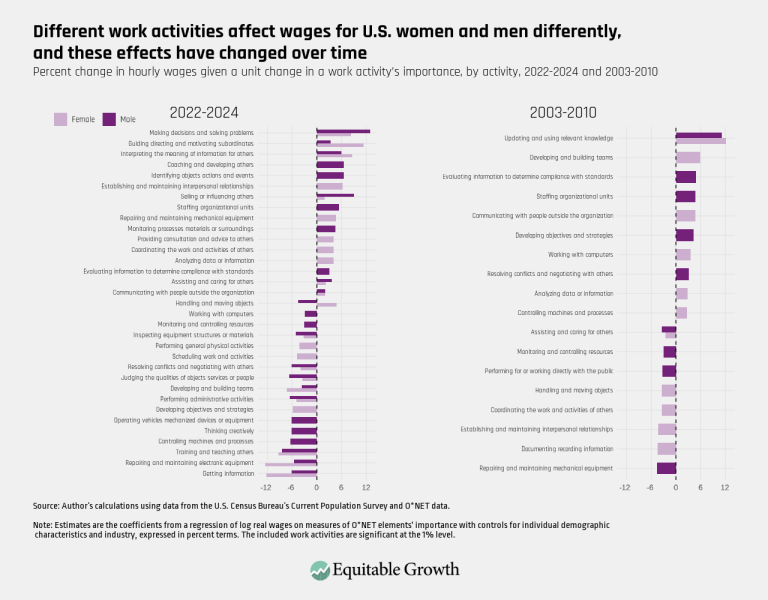
Different work activities affect wages for U.S. women and men differently, and these effects have changed over time (opens in a new tab)
Visualizations Jun 4, 2025
 View Chart
(opens in a new tab)
View Chart
(opens in a new tab)
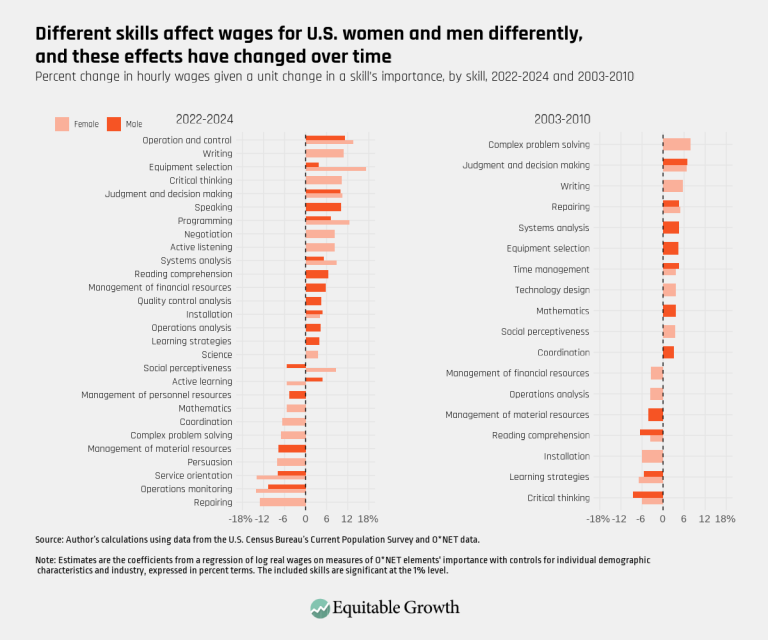
Different skills affect wages for U.S. women and men differently, and these effects have changed over time (opens in a new tab)
Visualizations Jun 4, 2025
 View Chart
(opens in a new tab)
View Chart
(opens in a new tab)
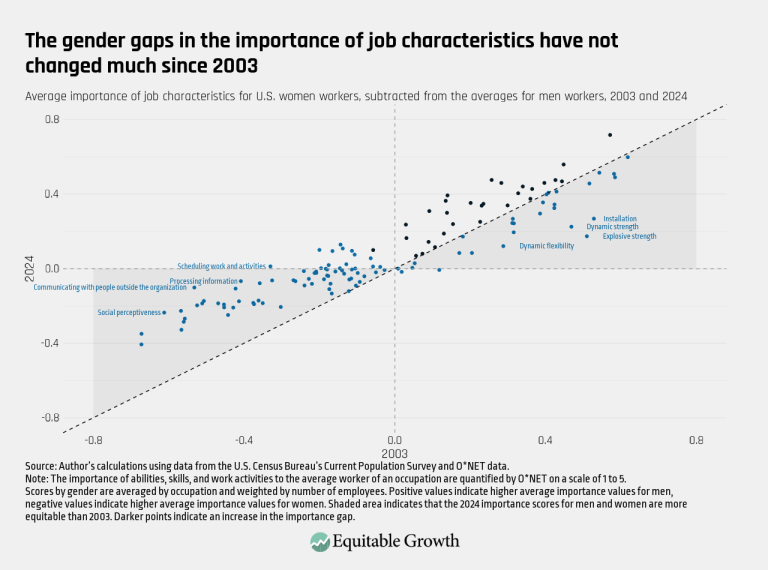
The gender gaps in the importance of job characteristics have not changed much since 2003 (opens in a new tab)
Visualizations Jun 4, 2025
 View Chart
(opens in a new tab)
View Chart
(opens in a new tab)
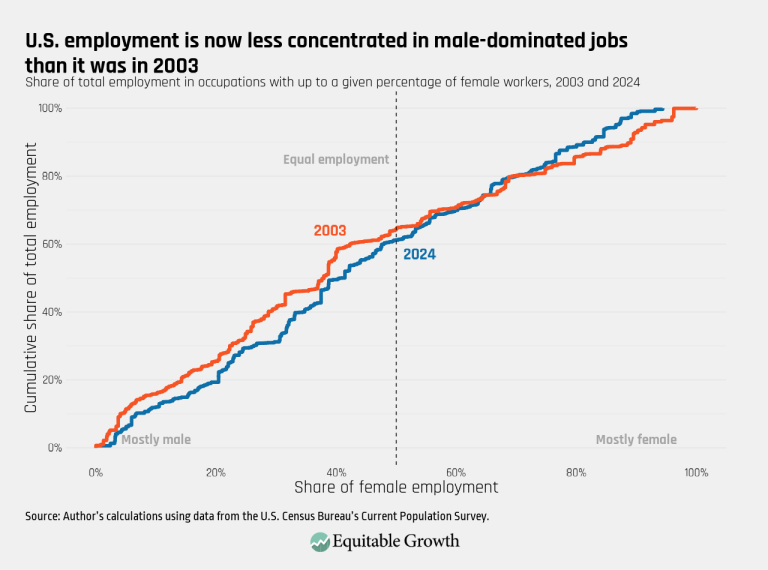
U.S. employment is now less concentrated in male-dominated jobs than it was in 2003 (opens in a new tab)
Visualizations Jun 4, 2025
 View Chart
(opens in a new tab)
View Chart
(opens in a new tab)
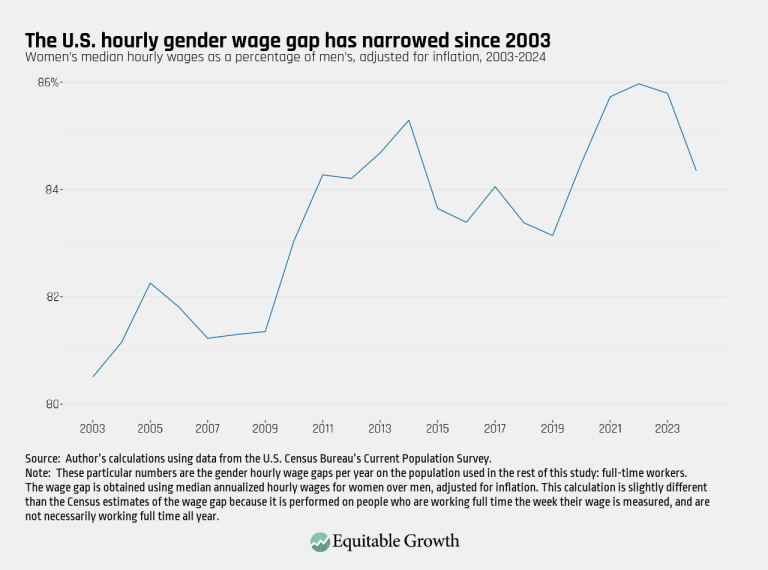
The U.S. hourly gender wage gap has narrowed since 2003 – updated (opens in a new tab)
Visualizations Jun 4, 2025
 View Chart
(opens in a new tab)
View Chart
(opens in a new tab)
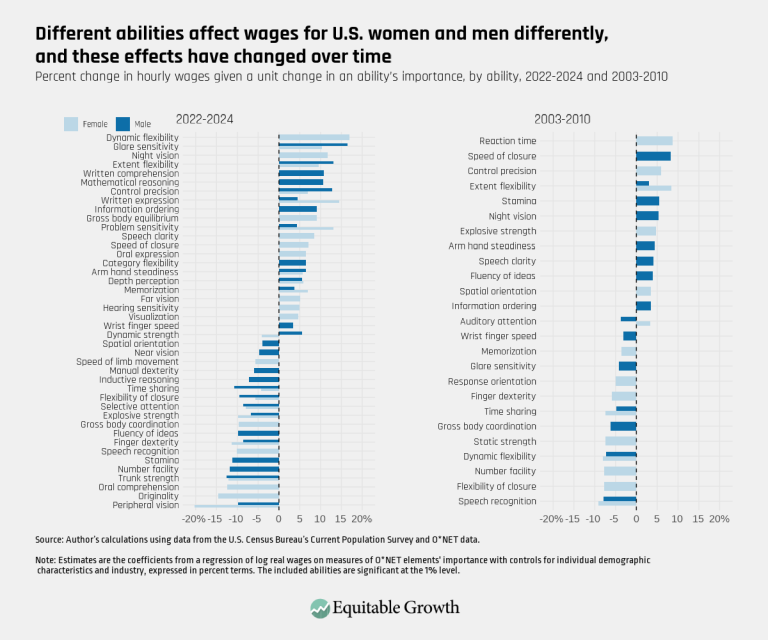
Different abilities affect wages for U.S. women and men differently, and these effects have changed over time – updated (opens in a new tab)
Visualizations Jun 4, 2025
 View Chart
(opens in a new tab)
View Chart
(opens in a new tab)
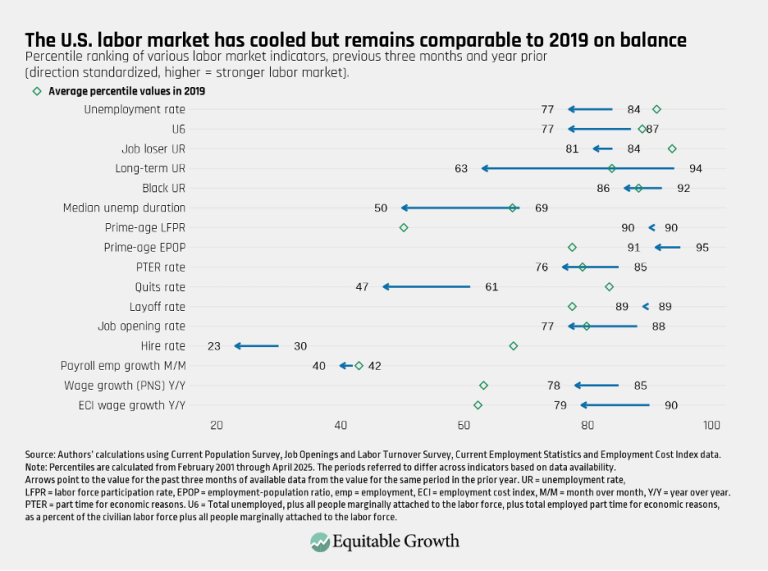
rinz fig 1 (opens in a new tab)
Visualizations May 9, 2025
 View Chart
(opens in a new tab)
View Chart
(opens in a new tab)
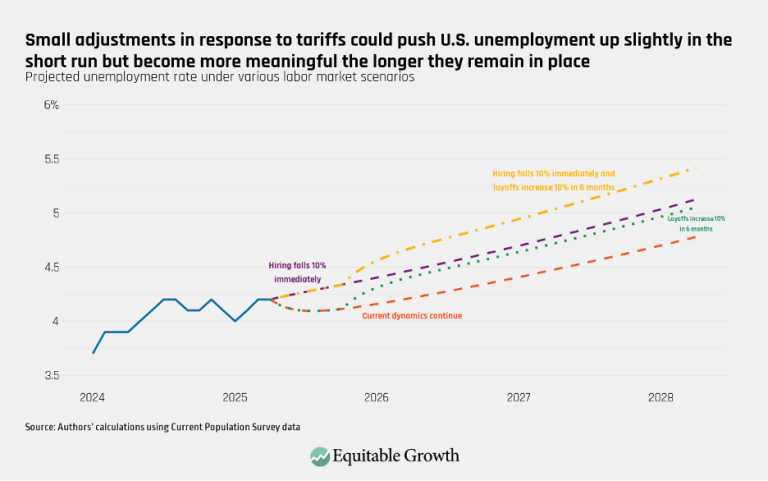
Small adjustments in response to tariffs could push U.S. unemployment up slightly in the short run but become more meaningful the longer they remain in place (opens in a new tab)
Visualizations May 9, 2025
 View Chart
(opens in a new tab)
View Chart
(opens in a new tab)
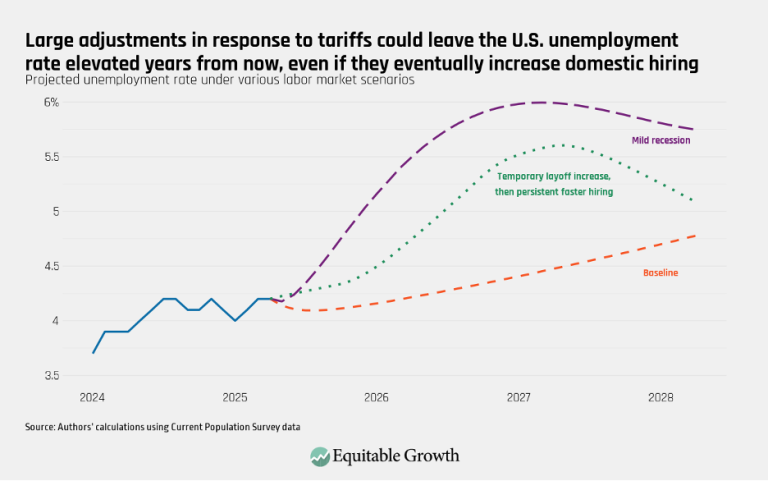
rinz fig 3 (opens in a new tab)
Visualizations May 9, 2025
 View Chart
(opens in a new tab)
View Chart
(opens in a new tab)
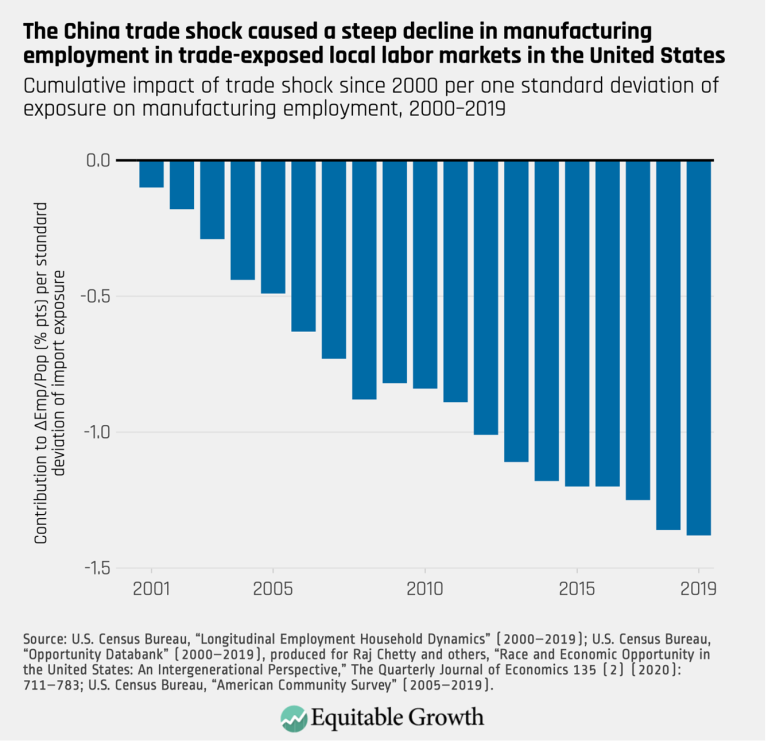
The China trade shock caused a steep decline in manufacturing employment in trade-exposed local labor markets in the United States (opens in a new tab)
Visualizations May 8, 2025
 View Chart
(opens in a new tab)
View Chart
(opens in a new tab)
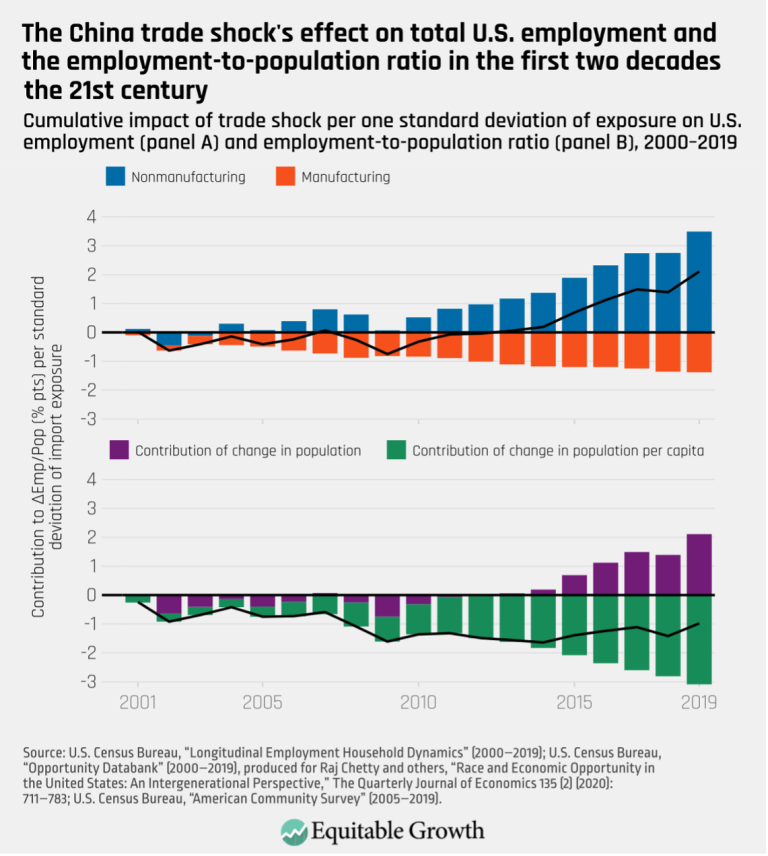
The China trade shock’s effect on total U.S. employment and the employment-to-population ratio in the first two decades the 21st century (opens in a new tab)
Visualizations May 8, 2025
 View Chart
(opens in a new tab)
View Chart
(opens in a new tab)
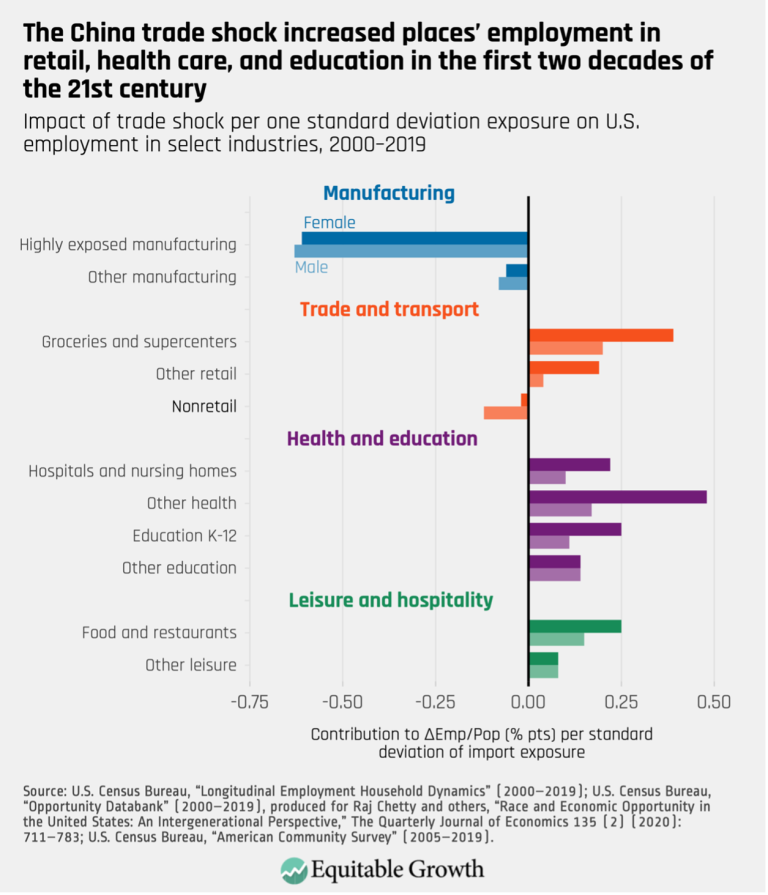
The China trade shock increased places’ employment in retail, health care, and education in the first two decades of the 21st century (opens in a new tab)
Visualizations May 8, 2025
 View Chart
(opens in a new tab)
View Chart
(opens in a new tab)
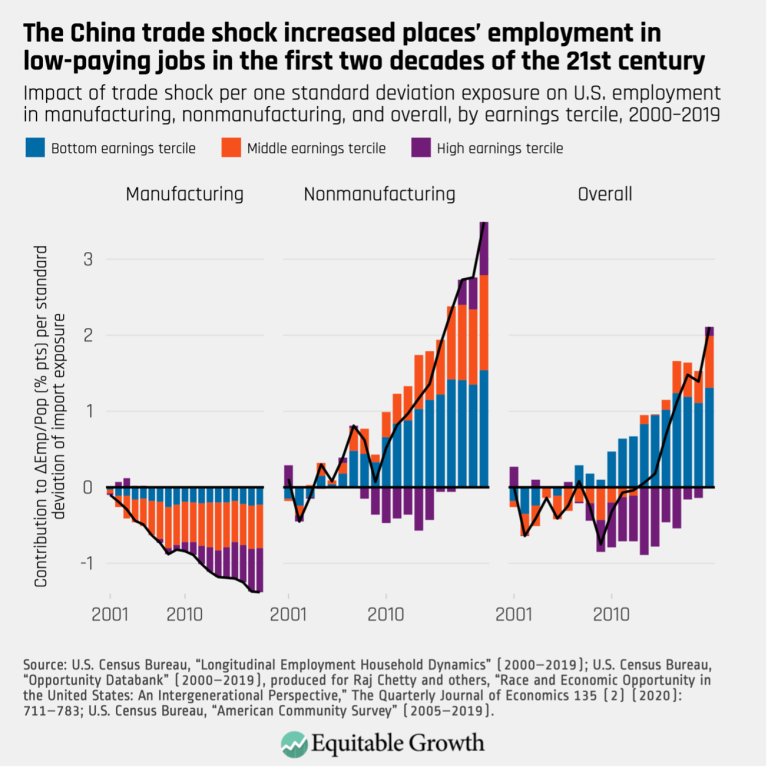
The China trade shock increased places’ employment in low-paying jobs in the first two decades of the 21st century (opens in a new tab)
Visualizations May 8, 2025
 View Chart
(opens in a new tab)
View Chart
(opens in a new tab)
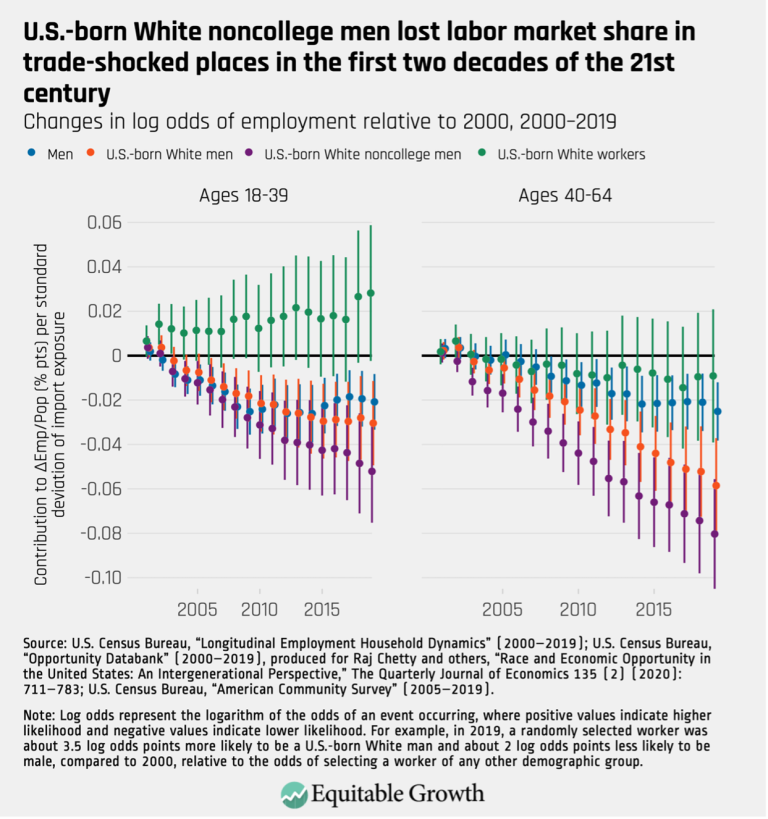
U.S.-born White noncollege men lost labor market share in trade-shocked places in the first two decades of the 21st century (opens in a new tab)
Visualizations May 8, 2025
 View Chart
(opens in a new tab)
View Chart
(opens in a new tab)
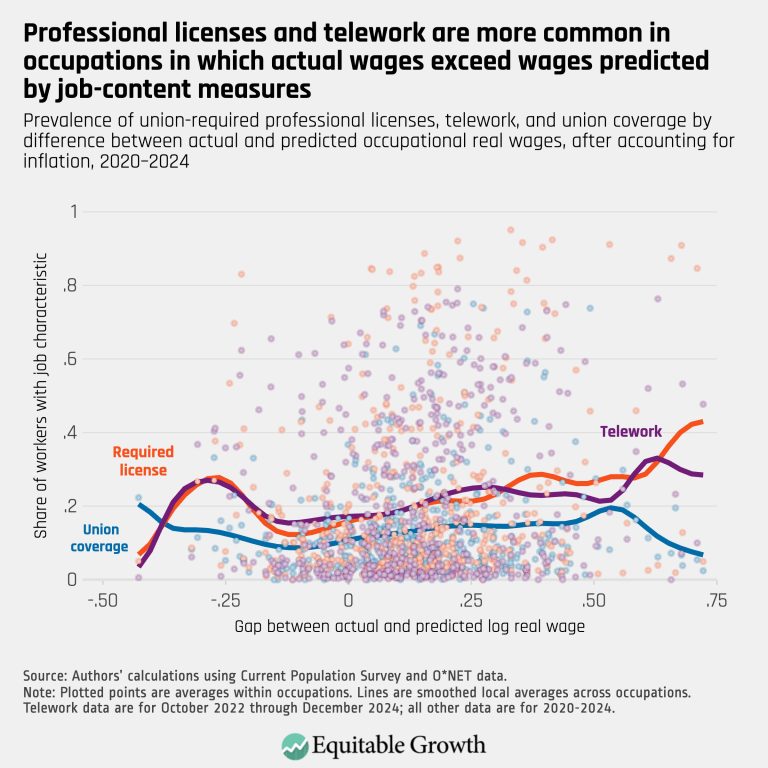
Professional licenses and telework are more common in occupations in which actual wages exceed wages predicted by job-content measures (opens in a new tab)
Visualizations May 6, 2025
 View Chart
(opens in a new tab)
View Chart
(opens in a new tab)
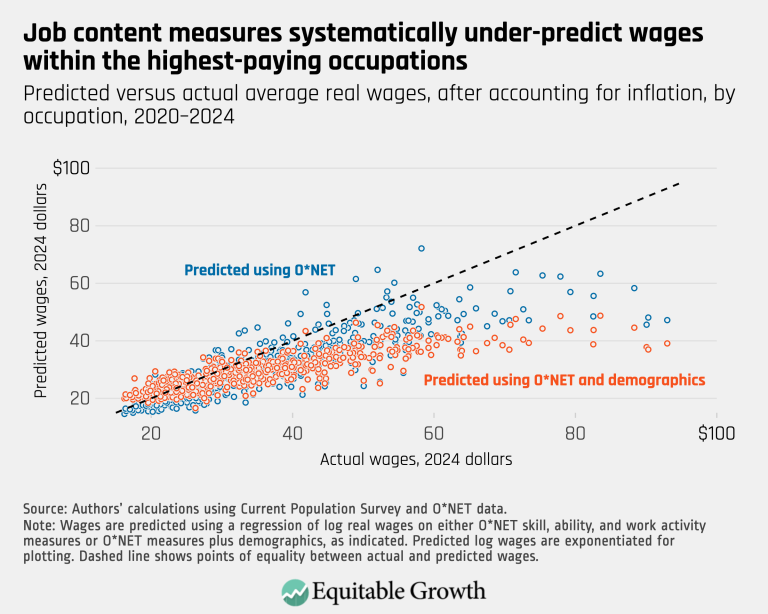
playfair (2) (opens in a new tab)
Visualizations May 6, 2025
 View Chart
(opens in a new tab)
View Chart
(opens in a new tab)
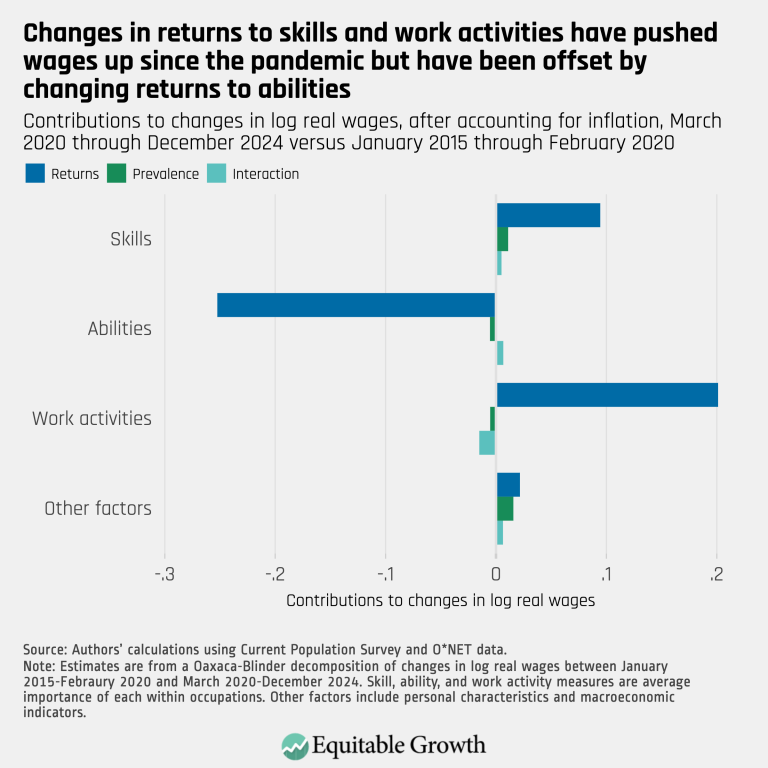
playfair (opens in a new tab)
Visualizations May 6, 2025
 View Chart
(opens in a new tab)
View Chart
(opens in a new tab)
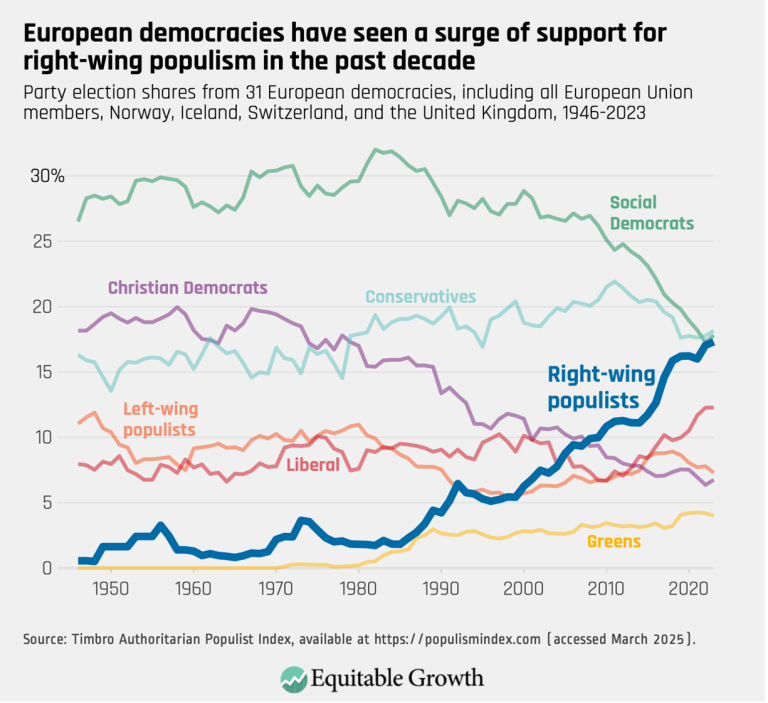
European democracies have seen a surge of support for right-wing populism in the past decade (opens in a new tab)
Visualizations Apr 29, 2025
 View Chart
(opens in a new tab)
View Chart
(opens in a new tab)
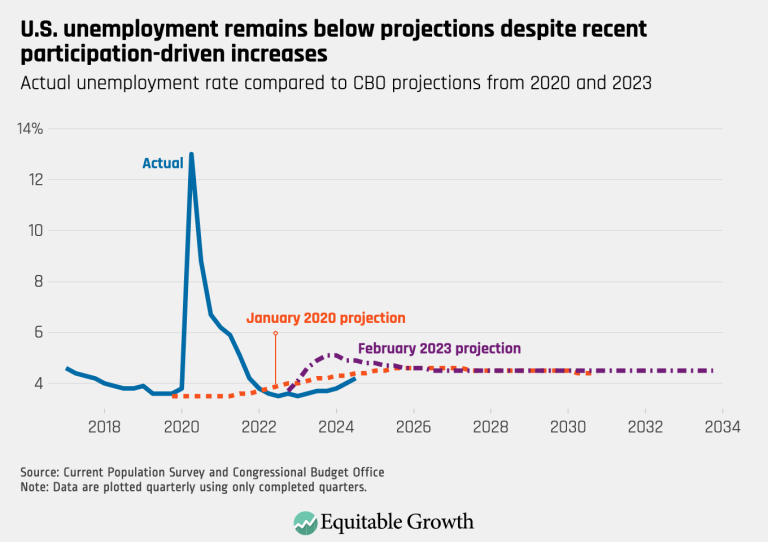
U.S. unemployment remains below projections despite recent participation-driven increases (opens in a new tab)
Visualizations Nov 5, 2024
 View Chart
(opens in a new tab)
View Chart
(opens in a new tab)
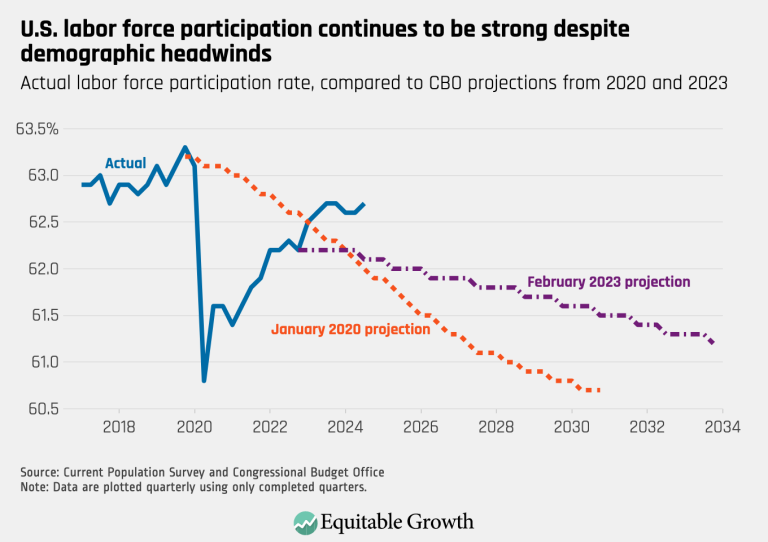
U.S. labor force participation continues to be strong despite demographic headwinds (opens in a new tab)
Visualizations Nov 5, 2024
 View Chart
(opens in a new tab)
View Chart
(opens in a new tab)
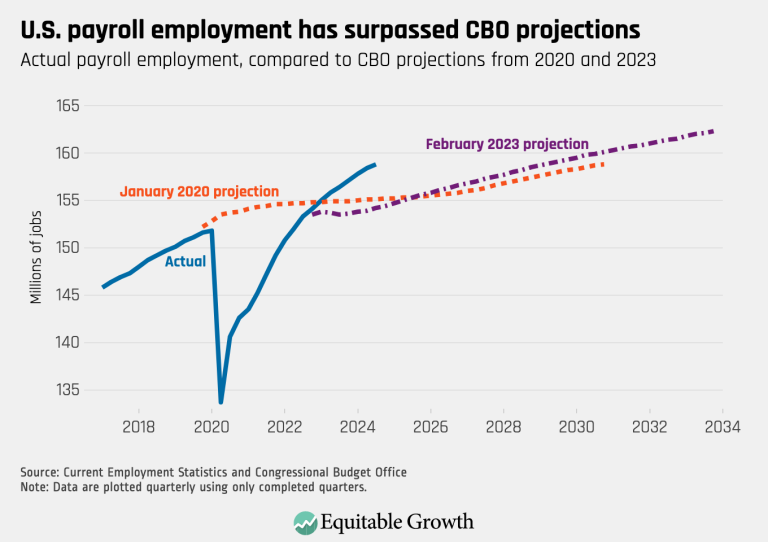
U.S. payroll employment has surpassed CBO projections (opens in a new tab)
Visualizations Nov 5, 2024
 View Chart
(opens in a new tab)
View Chart
(opens in a new tab)
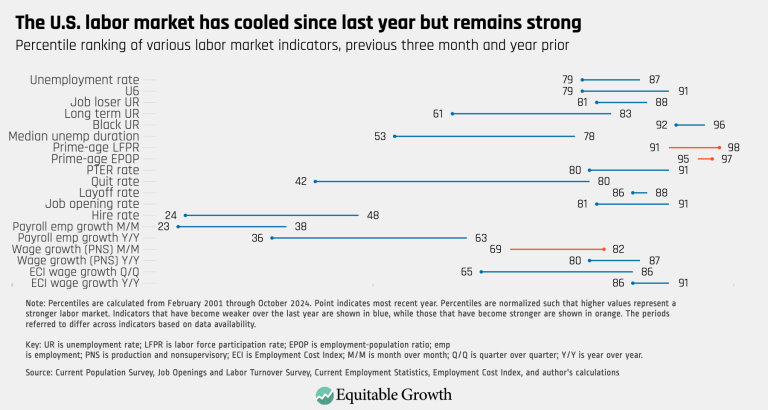
The U.S. labor market has cooled since last year but remains strong (opens in a new tab)
Visualizations Nov 4, 2024
 View Chart
(opens in a new tab)
View Chart
(opens in a new tab)
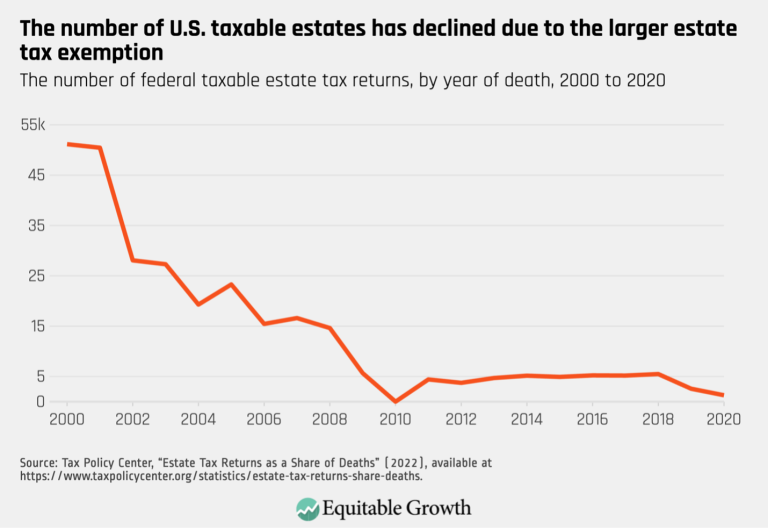
The number of U.S. taxable estates has declined due to the larger estate tax exemption (opens in a new tab)
Visualizations Oct 8, 2024
 View Chart
(opens in a new tab)
View Chart
(opens in a new tab)
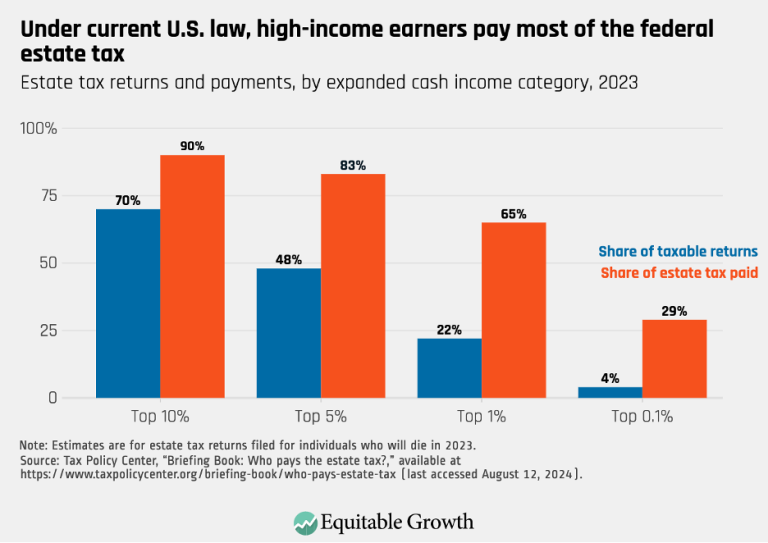
Under current U.S. law, high-income earners pay most of the federal estate tax (opens in a new tab)
Visualizations Oct 8, 2024
 View Chart
(opens in a new tab)
View Chart
(opens in a new tab)
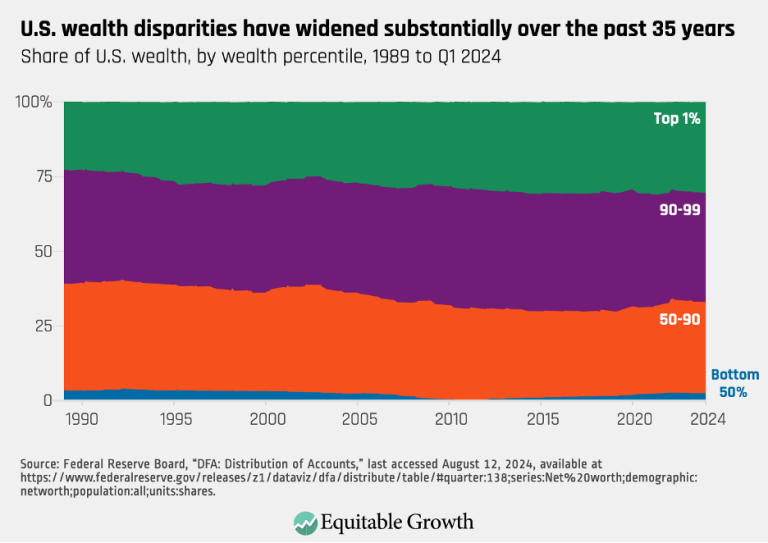
U.S. wealth disparities have widened substantially over the past 35 years (opens in a new tab)
Visualizations Oct 8, 2024
 View Chart
(opens in a new tab)
View Chart
(opens in a new tab)
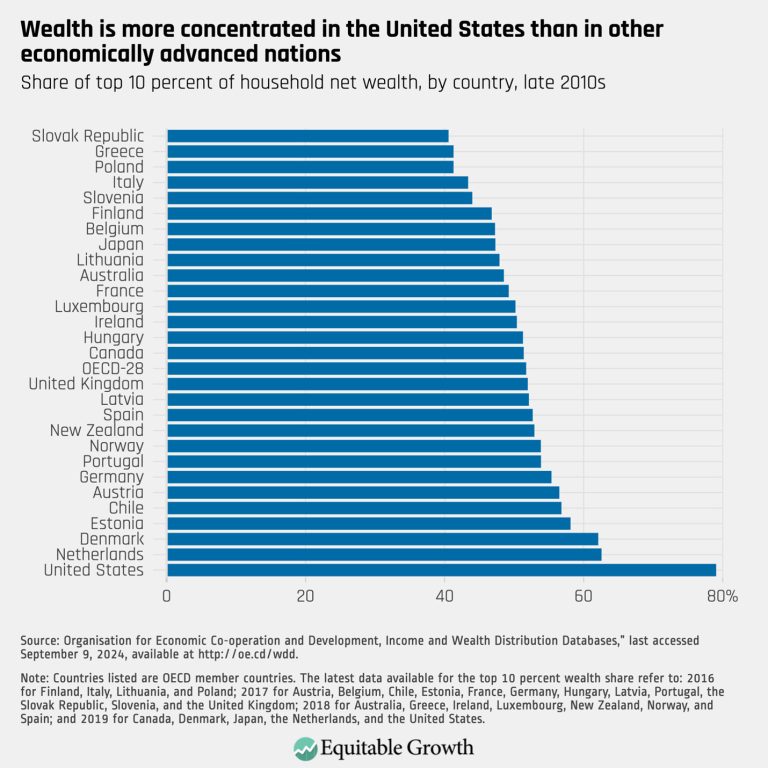
Wealth is more concentrated in the United States than in other economically advanced nations (opens in a new tab)
Visualizations Oct 8, 2024
 View Chart
(opens in a new tab)
View Chart
(opens in a new tab)
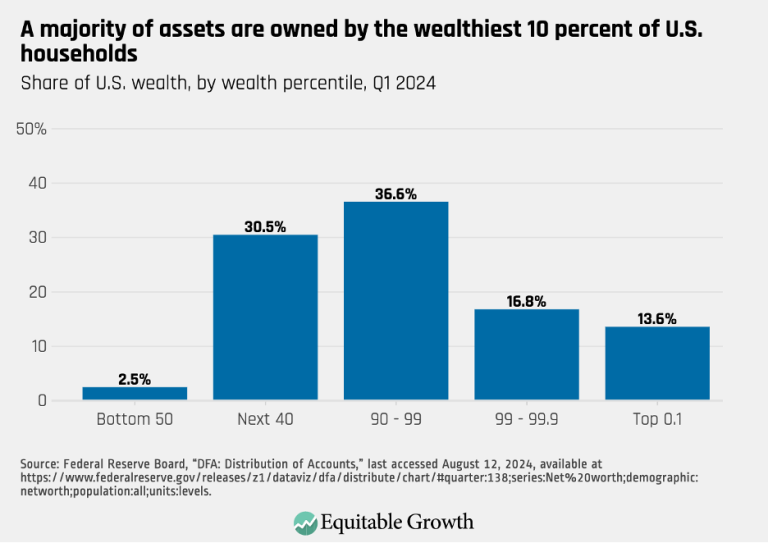
A majority of assets are owned by the wealthiest 10 percent of U.S. households (opens in a new tab)
Visualizations Oct 8, 2024
 View Chart
(opens in a new tab)
View Chart
(opens in a new tab)
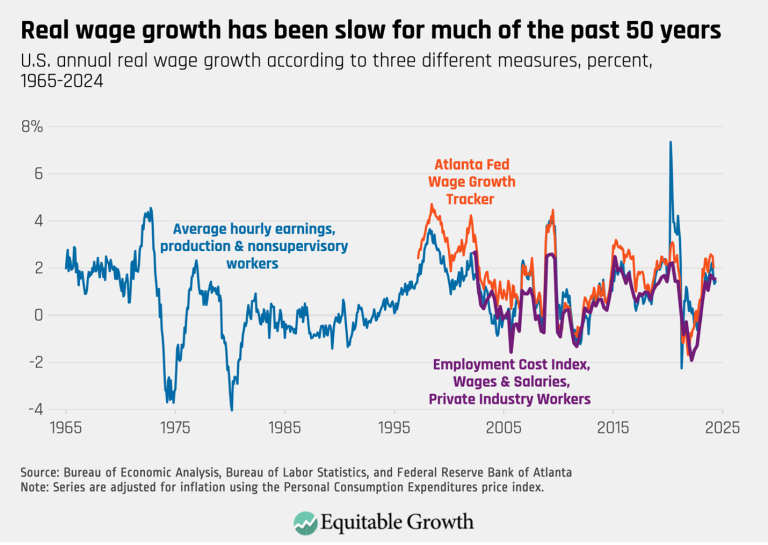
Real wage growth has been slow for much of the past 50 years (opens in a new tab)
Visualizations Aug 6, 2024
 View Chart
(opens in a new tab)
View Chart
(opens in a new tab)
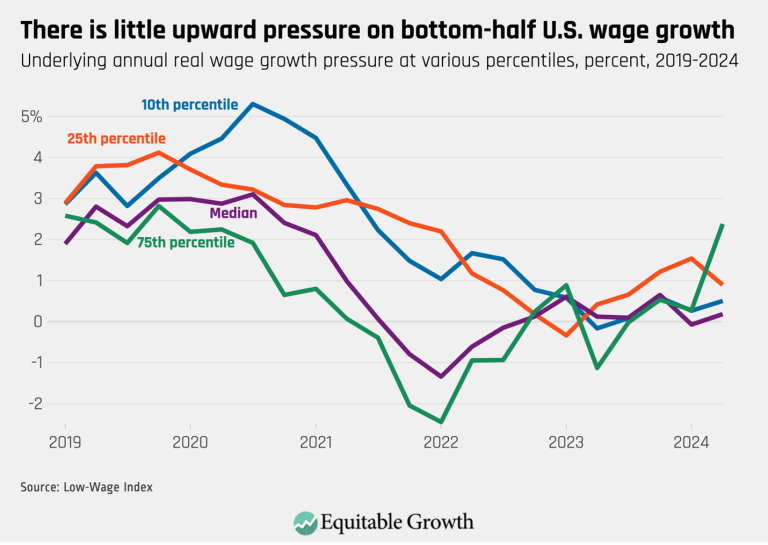
There is little upward pressure on bottom half of U.S. wage growth (opens in a new tab)
Visualizations Aug 6, 2024
 View Chart
(opens in a new tab)
View Chart
(opens in a new tab)
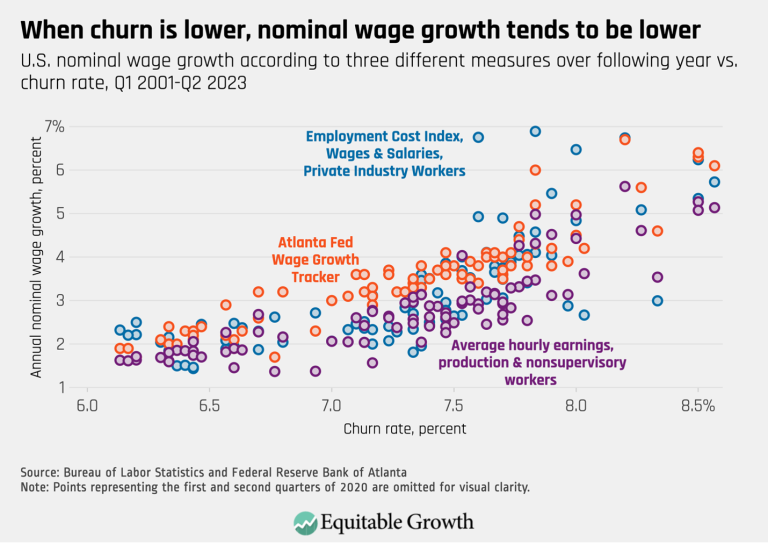
When churn is lower, nominal wage growth tends to be lower (opens in a new tab)
Visualizations Aug 6, 2024
 View Chart
(opens in a new tab)
View Chart
(opens in a new tab)
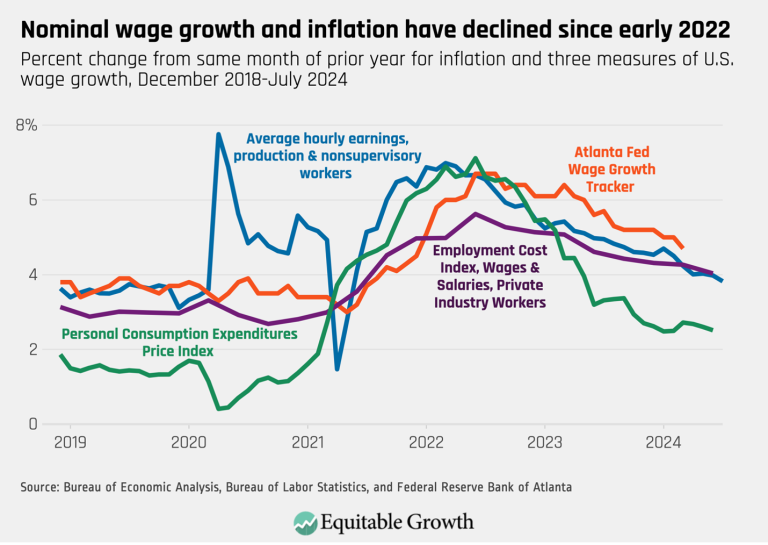
Nominal wage growth and inflation have declined since 2022 (opens in a new tab)
Visualizations Aug 6, 2024
 View Chart
(opens in a new tab)
View Chart
(opens in a new tab)
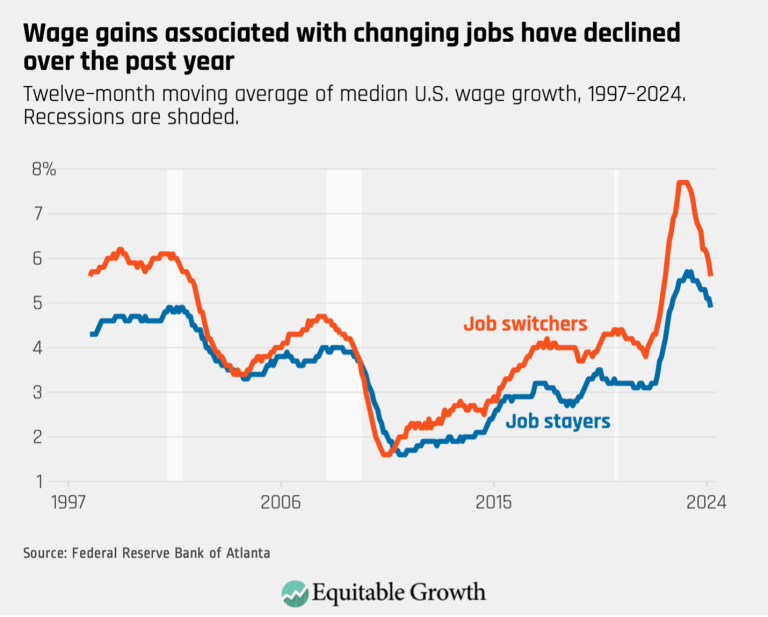
Wage gains associated with changing jobs have declined over the past year (opens in a new tab)
Visualizations May 16, 2024
 View Chart
(opens in a new tab)
View Chart
(opens in a new tab)
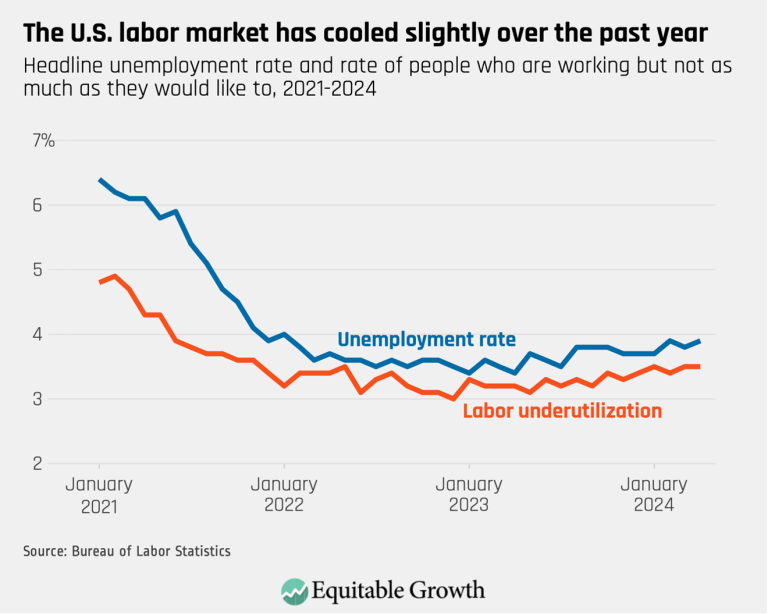
The U.S. labor market has cooled slightly over the past year (opens in a new tab)
Visualizations May 16, 2024
 View Chart
(opens in a new tab)
View Chart
(opens in a new tab)
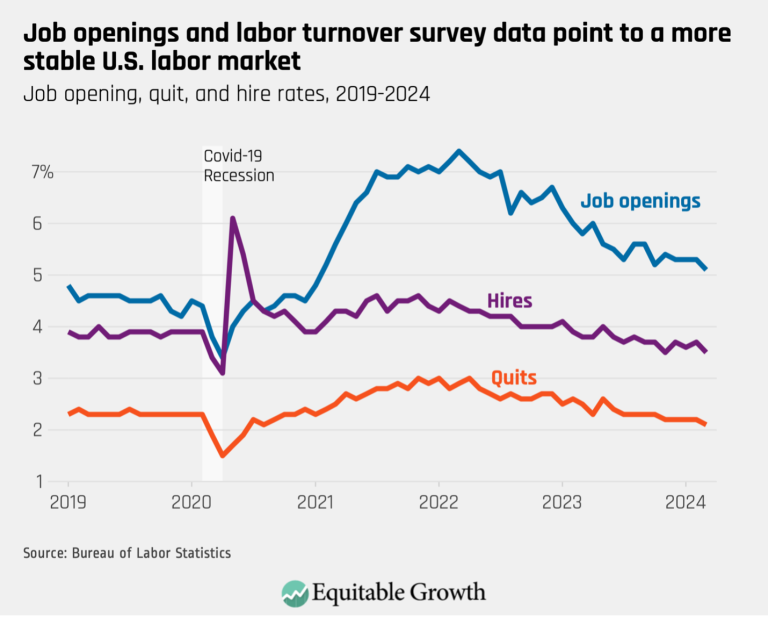
Job openings and labor turnover survey data point to a more stable U.S. labor market (opens in a new tab)
Visualizations May 16, 2024
 View Chart
(opens in a new tab)
View Chart
(opens in a new tab)
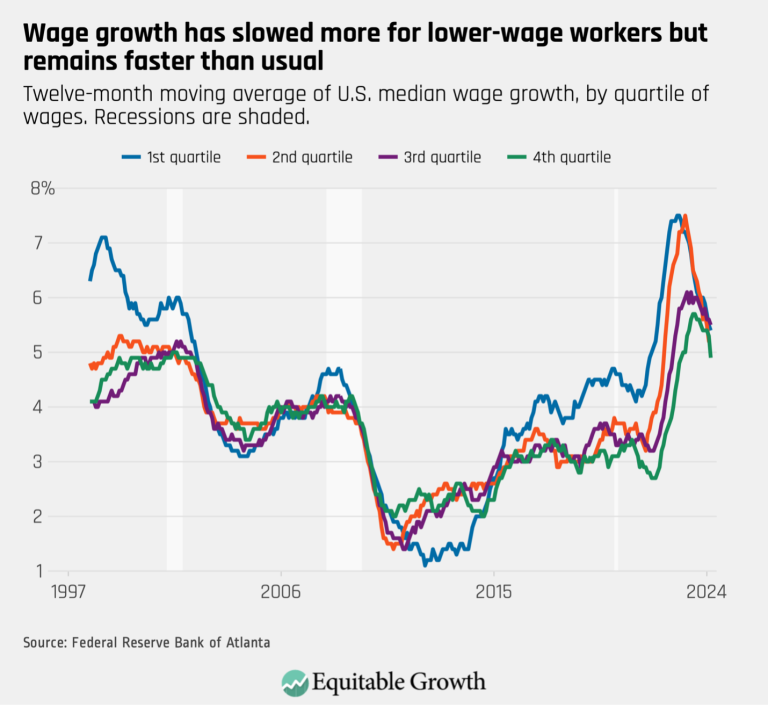
Wage growth has slowed more for lower-range workers but remains faster than usual (opens in a new tab)
Visualizations May 16, 2024
 View Chart
(opens in a new tab)
View Chart
(opens in a new tab)
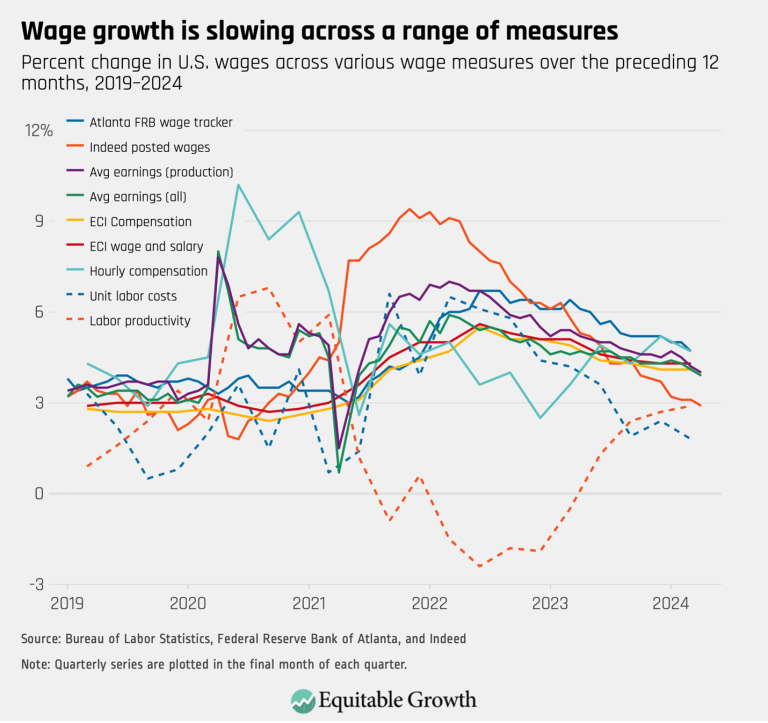
Wage growth is slowing across a range of measures (opens in a new tab)
Visualizations May 16, 2024
 View Chart
(opens in a new tab)
View Chart
(opens in a new tab)
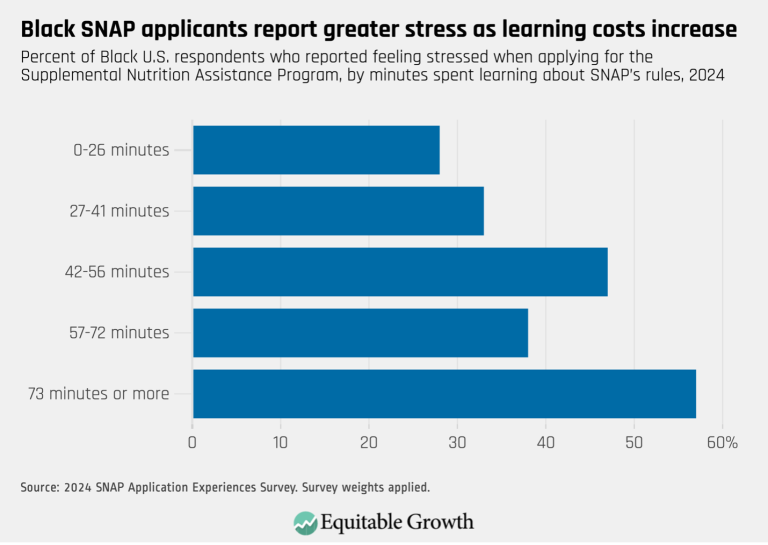
Black SNAP applicants report greater stress as learning costs increase (opens in a new tab)
Visualizations Apr 30, 2024
 View Chart
(opens in a new tab)
View Chart
(opens in a new tab)
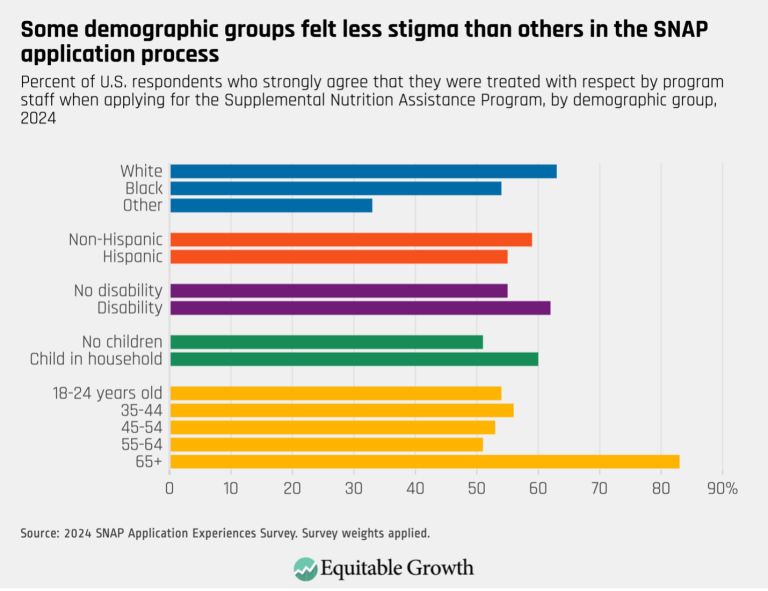
Some demographic groups felt less stigma than others in the SNAP application process (opens in a new tab)
Visualizations Apr 30, 2024
 View Chart
(opens in a new tab)
View Chart
(opens in a new tab)
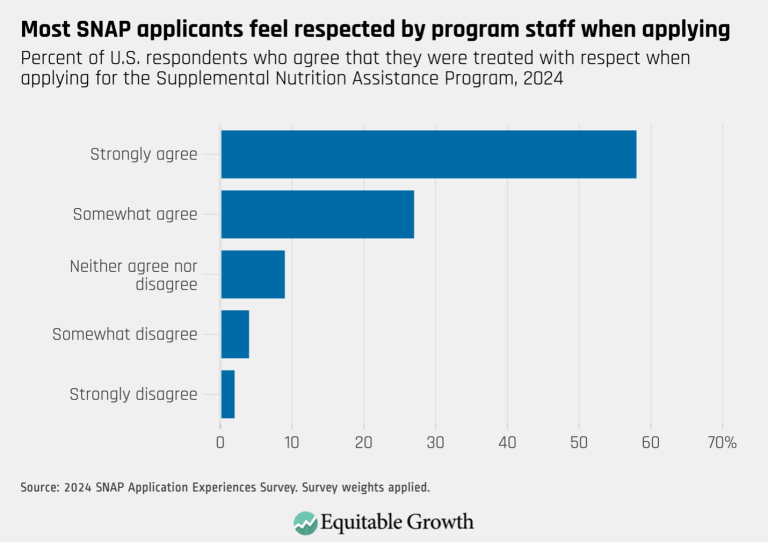
Most SNAP applicants feel respected by program staff when applying (opens in a new tab)
Visualizations Apr 30, 2024
 View Chart
(opens in a new tab)
View Chart
(opens in a new tab)
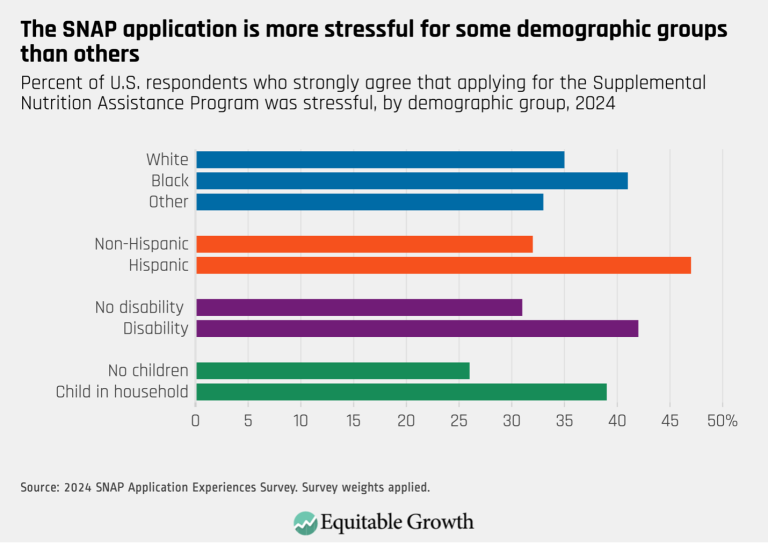
The SNAP application is more stressful for some demographic groups than others (opens in a new tab)
Visualizations Apr 30, 2024
 View Chart
(opens in a new tab)
View Chart
(opens in a new tab)
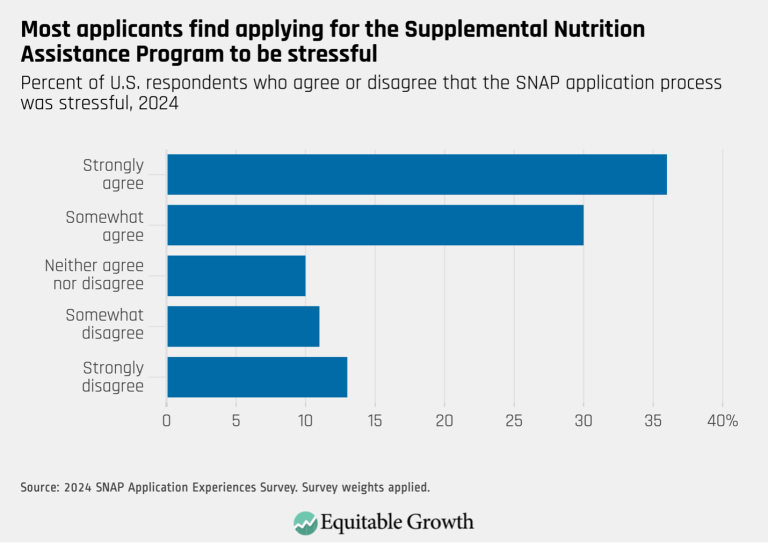
Most applicants find applying for the Supplemental Nutrition Assistance Program to be stressful (opens in a new tab)
Visualizations Apr 30, 2024
 View Chart
(opens in a new tab)
View Chart
(opens in a new tab)
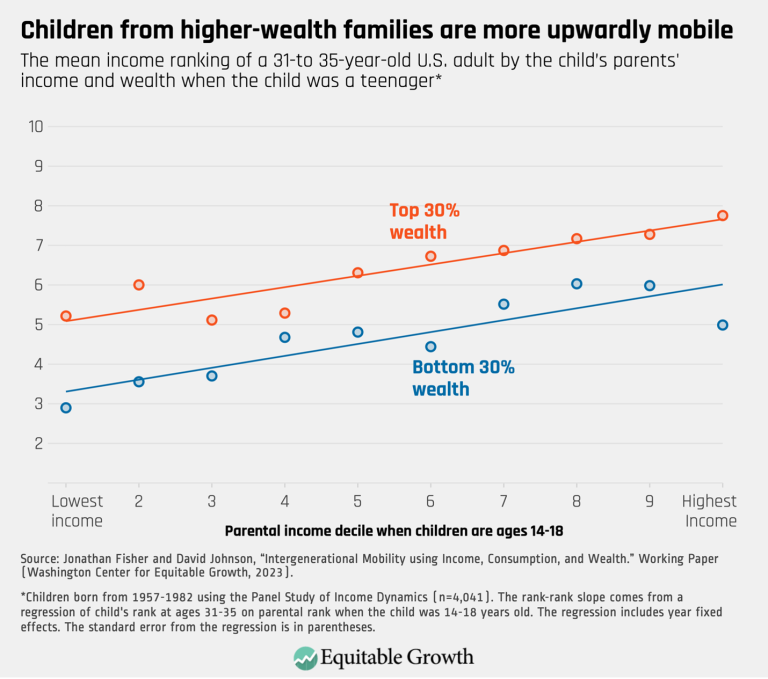
Children from higher-wealth families are more upwardly mobile (opens in a new tab)
Visualizations Apr 19, 2024
 View Chart
(opens in a new tab)
View Chart
(opens in a new tab)
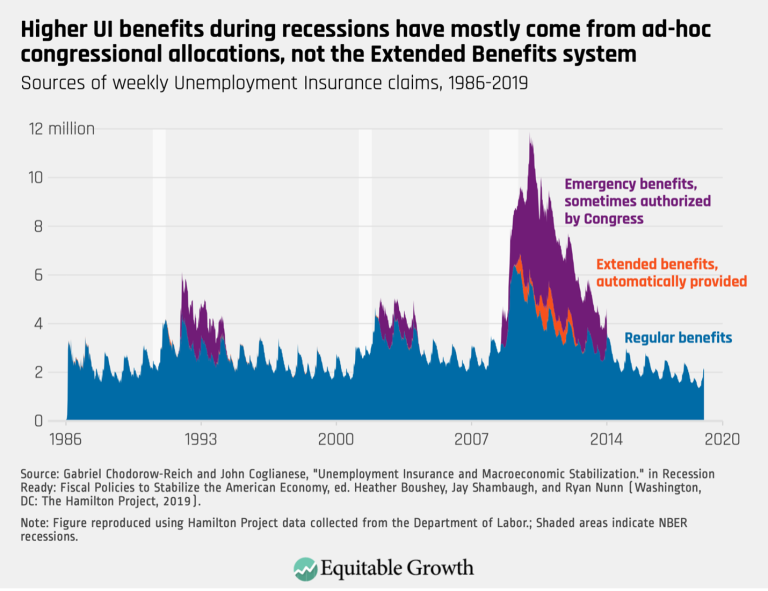
Higher UI benefits during recessions have mostly come from ad-hoc congressional allocations, not the Extended Benefits system (opens in a new tab)
Visualizations Apr 5, 2024
 View Chart
(opens in a new tab)
View Chart
(opens in a new tab)
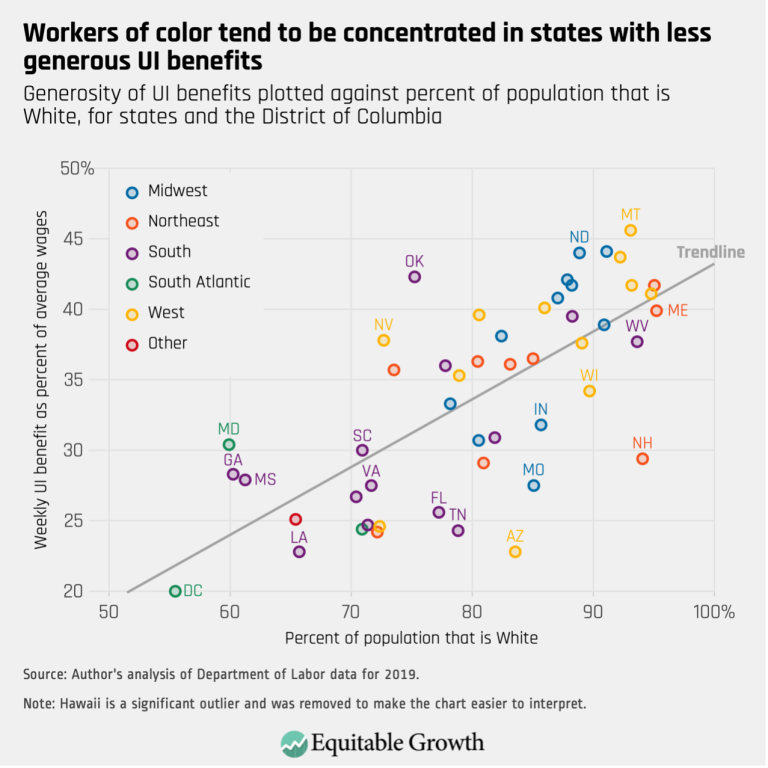
Workers of color tend to be concentrated in states with less generous UI benefits (opens in a new tab)
Visualizations Apr 5, 2024
 View Chart
(opens in a new tab)
View Chart
(opens in a new tab)
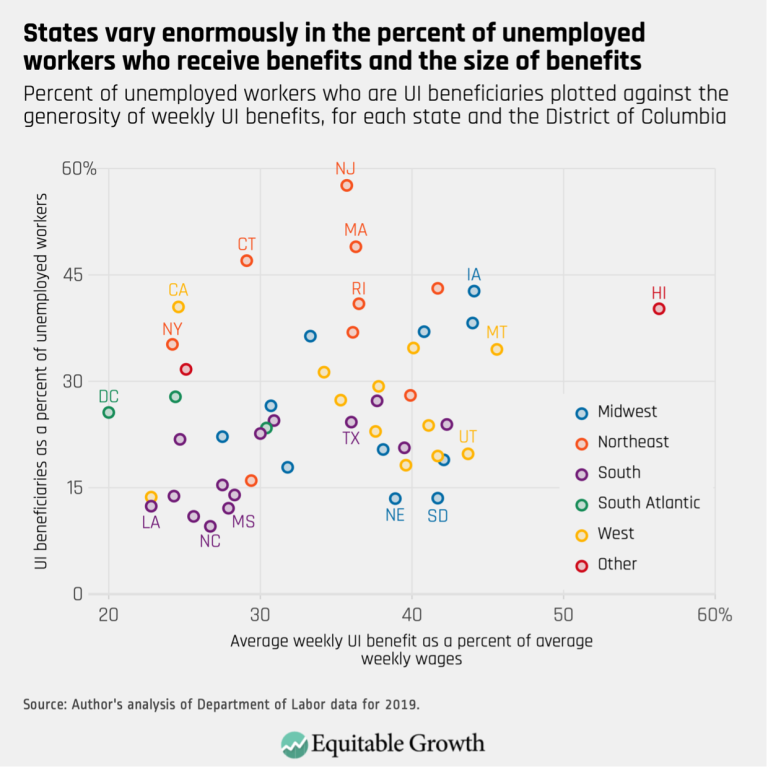
States vary enormously in the percent of unemployed workers who receive benefits and the size of benefits (opens in a new tab)
Visualizations Apr 5, 2024
 View Chart
(opens in a new tab)
View Chart
(opens in a new tab)
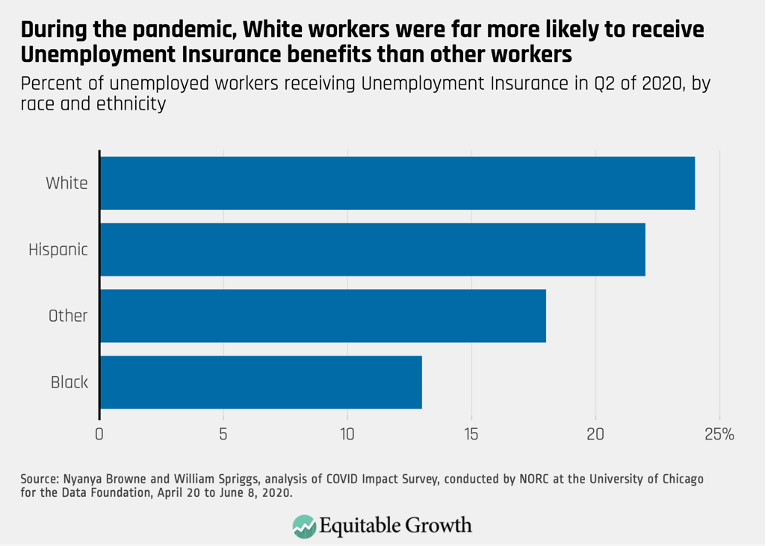
During the pandemic, White workers were far more likely to receive Unemployment Insurance benefits than other workers (opens in a new tab)
Visualizations Mar 28, 2024
 View Chart
(opens in a new tab)
View Chart
(opens in a new tab)
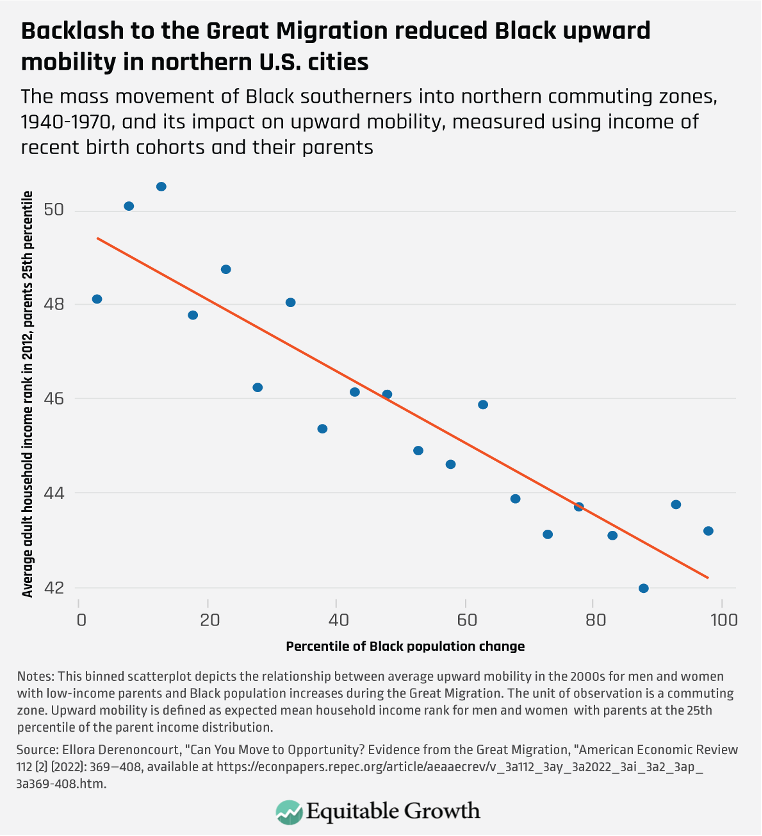
Backlash to the Great Migration reduced Black upward mobility in northern U.S. cities (opens in a new tab)
Visualizations Mar 28, 2024
 View Chart
(opens in a new tab)
View Chart
(opens in a new tab)
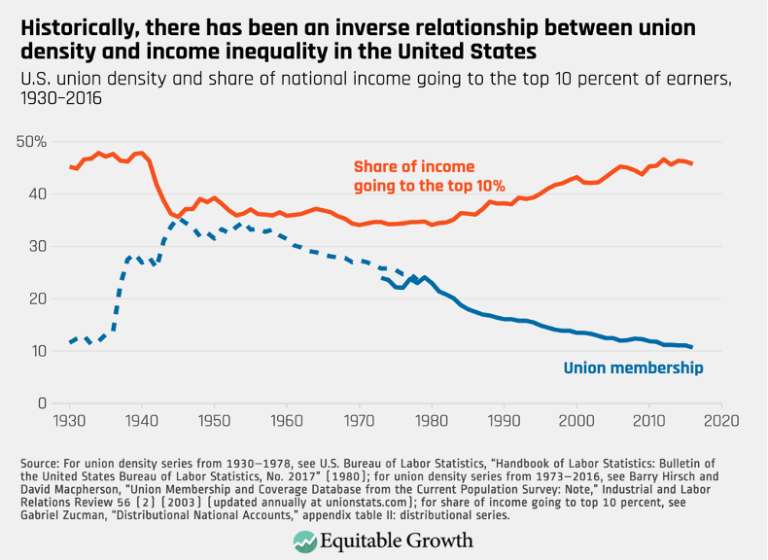
Historically, there has been an inverse relationship between union density and income inequality in the United Sates (opens in a new tab)
Visualizations Mar 28, 2024
 View Chart
(opens in a new tab)
View Chart
(opens in a new tab)
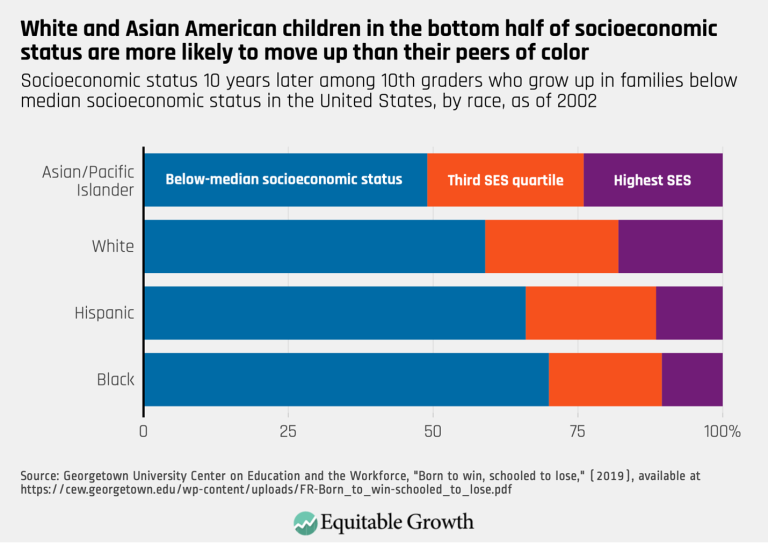
White and Asian American children in the bottom half of the socioeconomic status are more likely to move up than their peers of color (opens in a new tab)
Visualizations Mar 28, 2024
 View Chart
(opens in a new tab)
View Chart
(opens in a new tab)
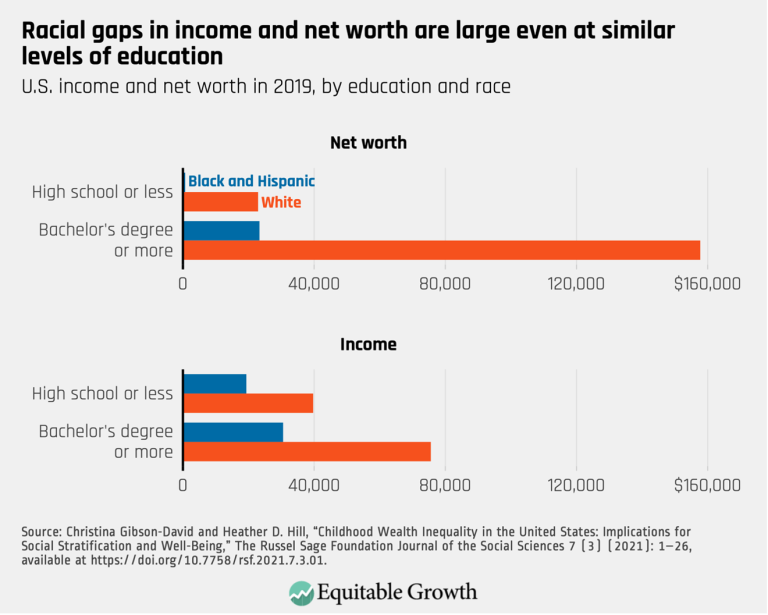
Racial gaps in income and net worth are large even at similar levels of education (opens in a new tab)
Visualizations Mar 28, 2024
 View Chart
(opens in a new tab)
View Chart
(opens in a new tab)
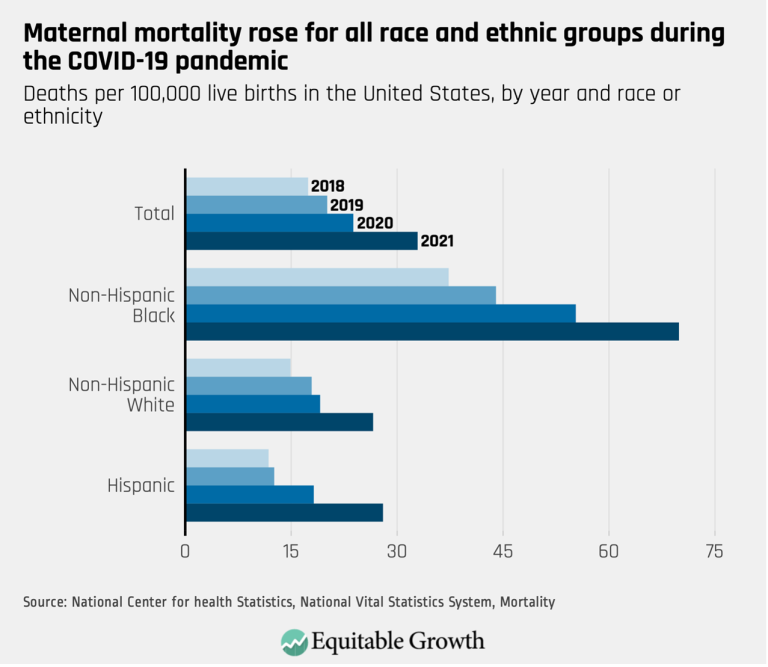
Maternal mortality rose for all race and ethnic groups during the COVID-19 pandemic (opens in a new tab)
Visualizations Mar 28, 2024
 View Chart
(opens in a new tab)
View Chart
(opens in a new tab)
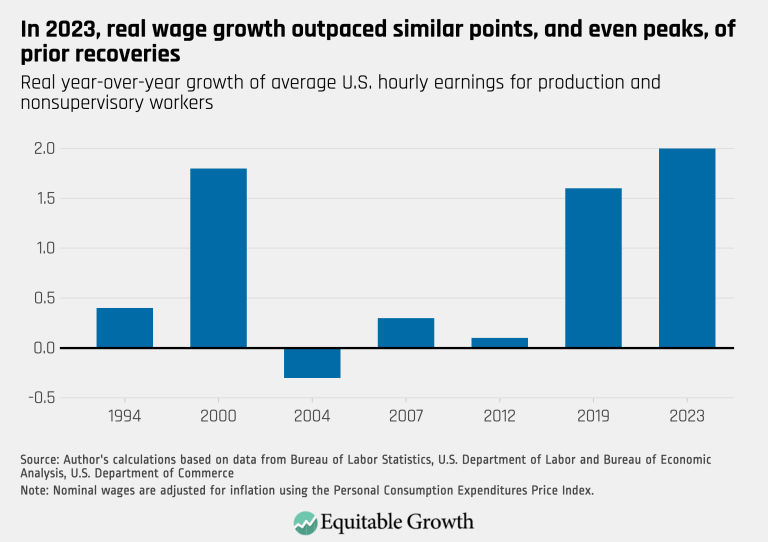
In 2023, real wage growth outpaces similar points, and even peaks, of prior recoveries (opens in a new tab)
Visualizations Mar 4, 2024
 View Chart
(opens in a new tab)
View Chart
(opens in a new tab)
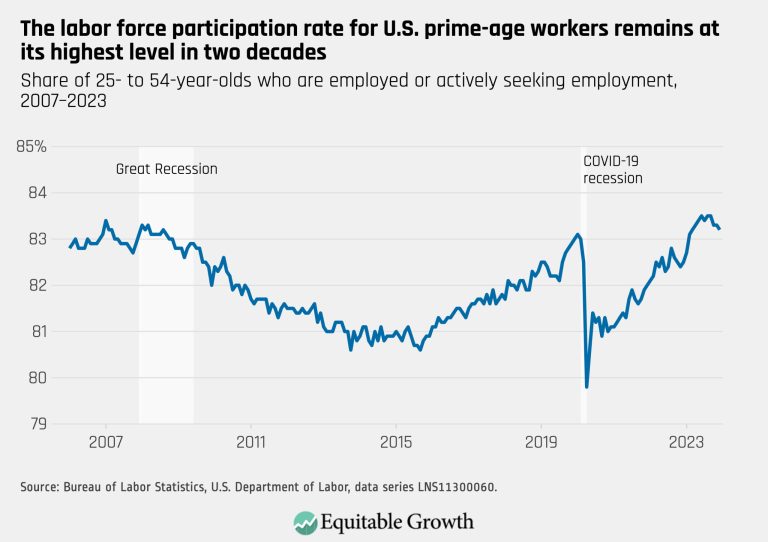
The labor force participation rate for U.S. prime-age workers remains at its highest level in two decades (opens in a new tab)
Visualizations Mar 4, 2024
 View Chart
(opens in a new tab)
View Chart
(opens in a new tab)
Personal loan delinquency is low or within normal levels for all major loan types (opens in a new tab)
Visualizations Feb 20, 2024
 View Chart
(opens in a new tab)
View Chart
(opens in a new tab)
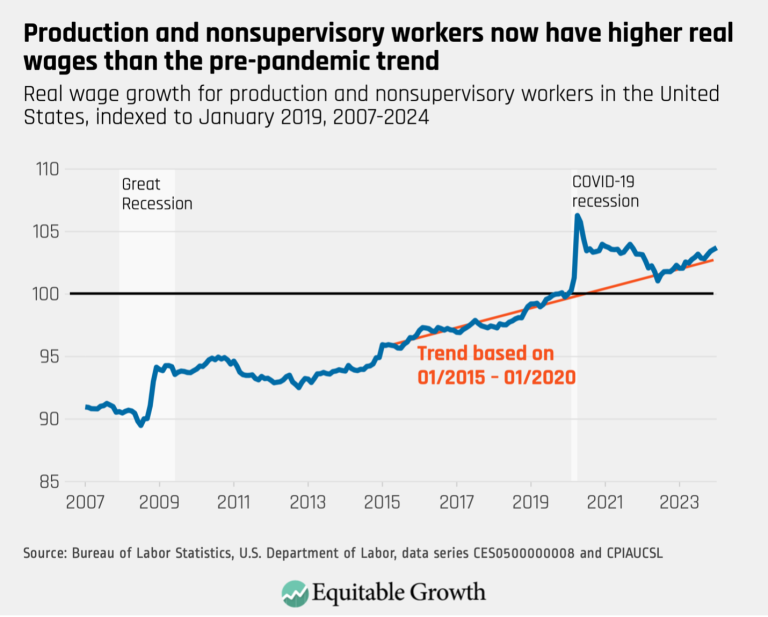
Production and nonsupervisory workers now have higher real wages than the pre-pandemic trend (opens in a new tab)
Visualizations Feb 20, 2024
 View Chart
(opens in a new tab)
View Chart
(opens in a new tab)
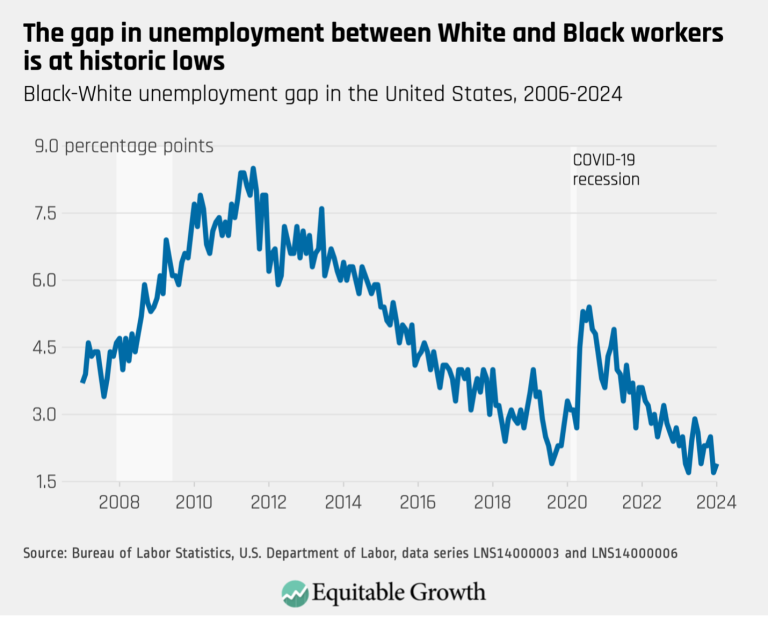
The gap in unemployment between White and Black workers is at historic lows (opens in a new tab)
Visualizations Feb 20, 2024
 View Chart
(opens in a new tab)
View Chart
(opens in a new tab)
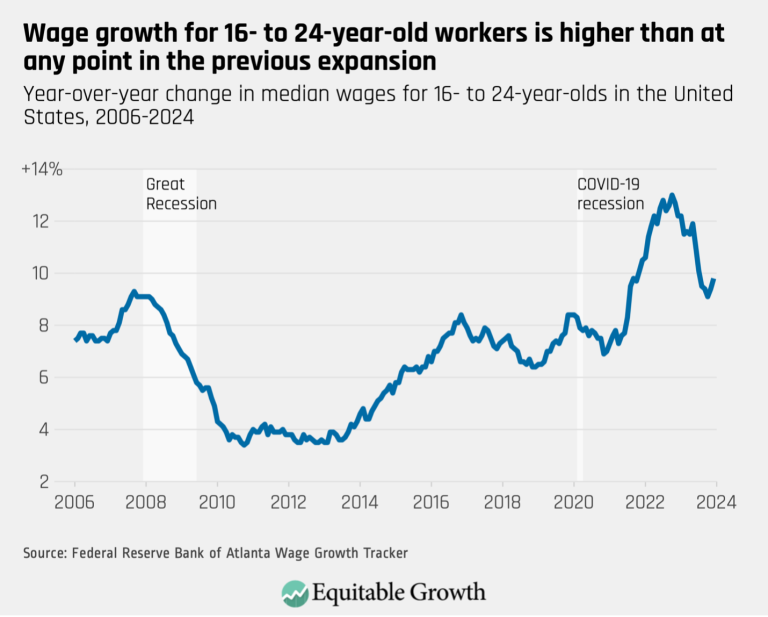
Wage growth for 16- to 24-year-old workers is higher than at any point in the previous expansion (opens in a new tab)
Visualizations Feb 20, 2024
 View Chart
(opens in a new tab)
View Chart
(opens in a new tab)
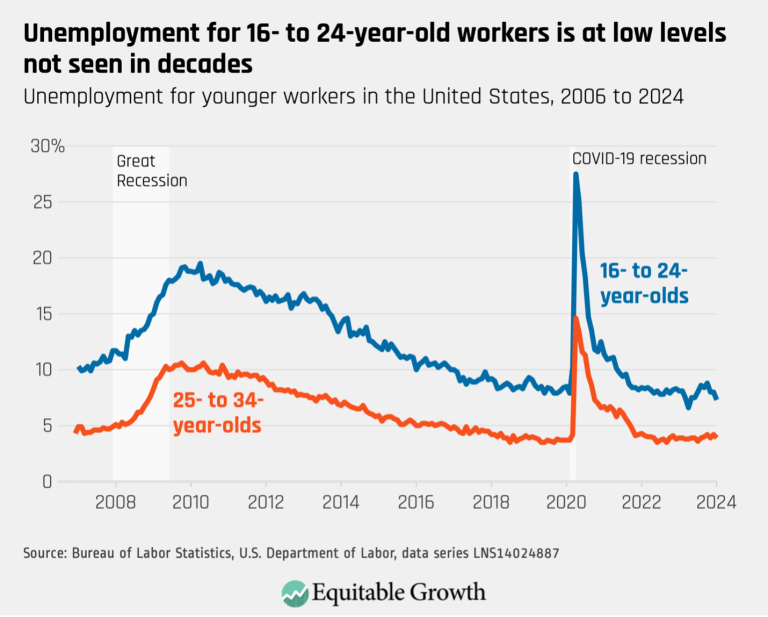
Unemployment for 16- to 24-year-old workers is at low levels not seen in decades (opens in a new tab)
Visualizations Feb 20, 2024
 View Chart
(opens in a new tab)
View Chart
(opens in a new tab)
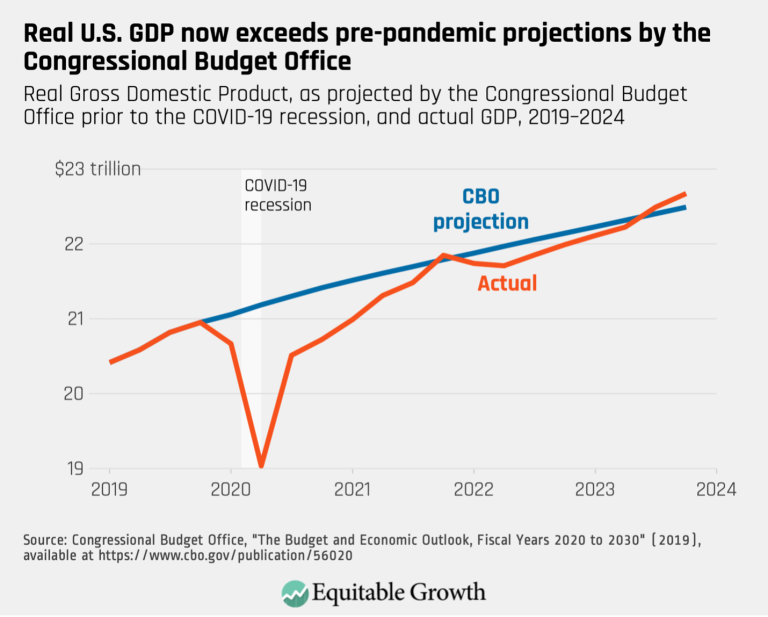
Real U.S. GDP now exceeds pre-pandemic projections by the Congressional budget Office (opens in a new tab)
Visualizations Feb 20, 2024
 View Chart
(opens in a new tab)
View Chart
(opens in a new tab)
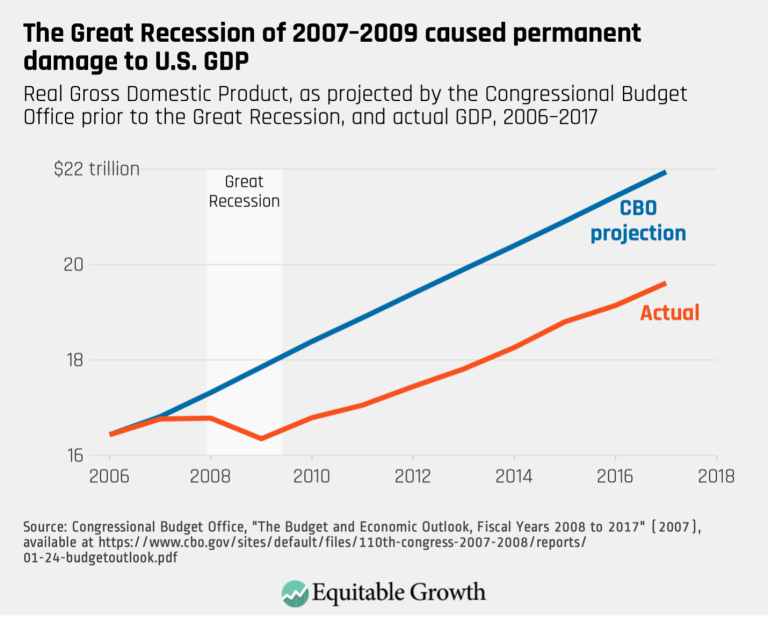
The Great Recession of 2007-2009 caused permanent damage to U.S. GDP (opens in a new tab)
Visualizations Feb 20, 2024
 View Chart
(opens in a new tab)
View Chart
(opens in a new tab)
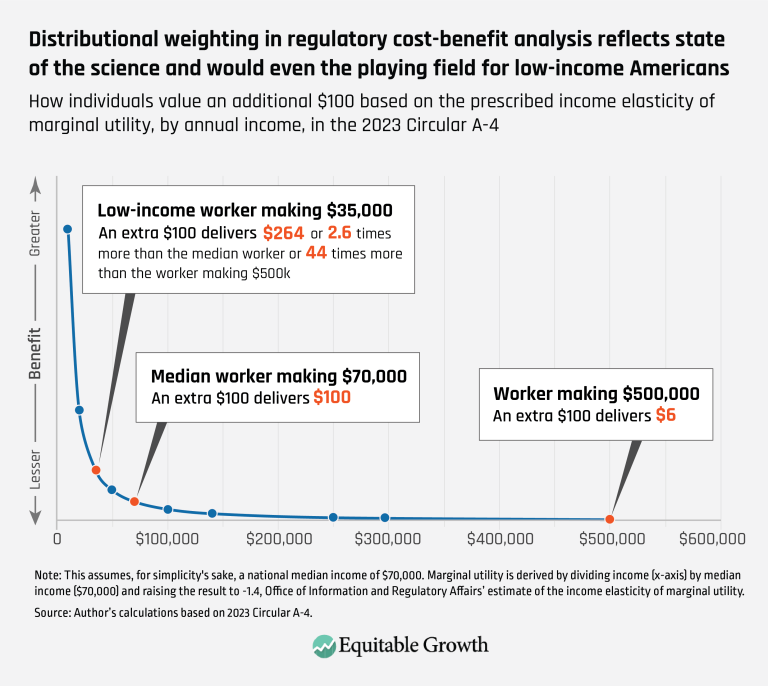
Distributional weighting in regulatory cost-benefit analysis reflects state of the science and would even the playing field for low-income Americans (opens in a new tab)
Visualizations Jan 31, 2024
 View Chart
(opens in a new tab)
View Chart
(opens in a new tab)
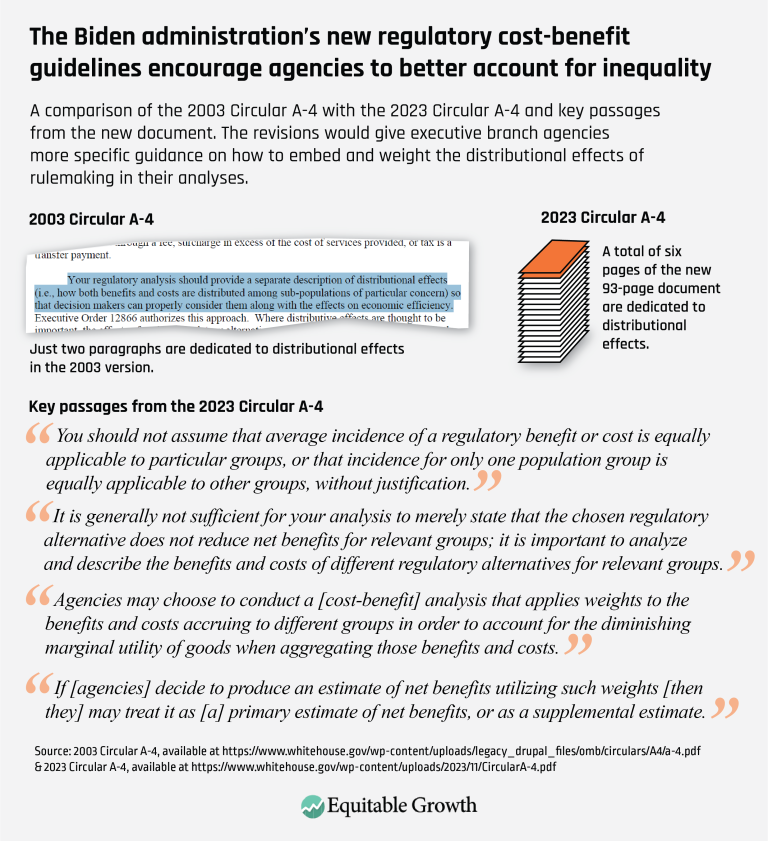
The Biden administration’s new regulatory cost-benefit guidelines encourage agencies to better account for inequality (opens in a new tab)
Visualizations Jan 31, 2024
 View Chart
(opens in a new tab)
View Chart
(opens in a new tab)
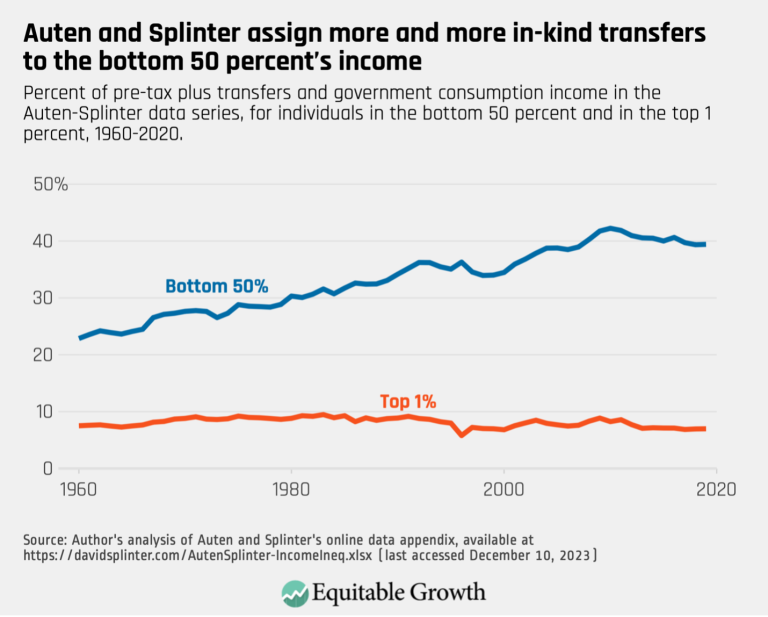
Auten and Splinter assign more and more in-kind transfers to the bottom 50 percent’s income (opens in a new tab)
Visualizations Jan 9, 2024
 View Chart
(opens in a new tab)
View Chart
(opens in a new tab)
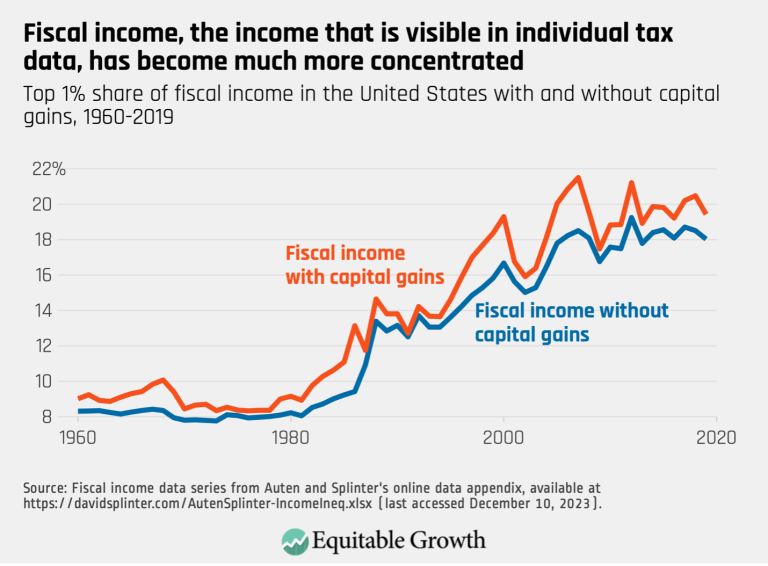
Fiscal income, the income that is visible in individual tax data, has become much more concentrated (opens in a new tab)
Visualizations Jan 9, 2024
 View Chart
(opens in a new tab)
View Chart
(opens in a new tab)
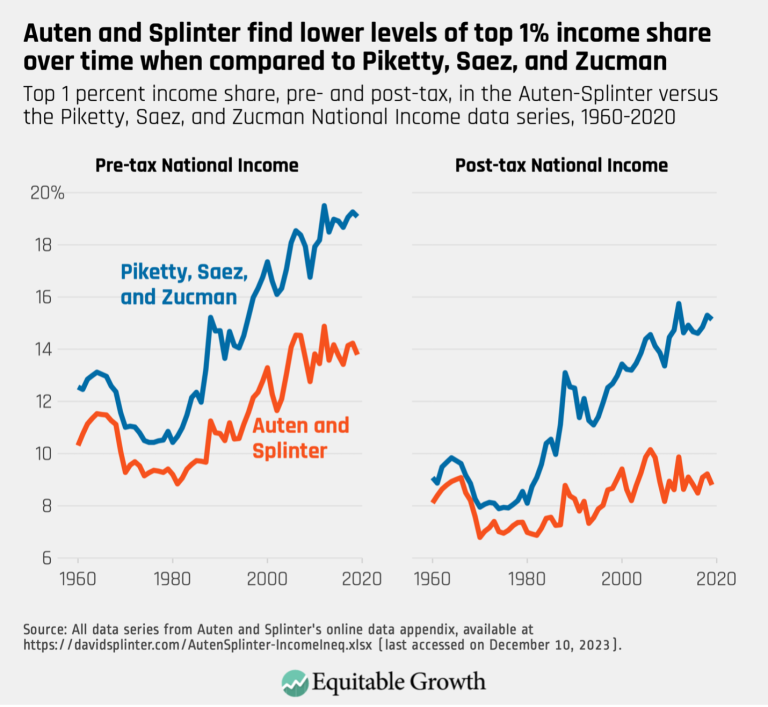
Auten and Splinter find lower levels of top 1% income share over time when compared to Piketty, Saez, and Zucman (opens in a new tab)
Visualizations Jan 9, 2024
 View Chart
(opens in a new tab)
View Chart
(opens in a new tab)
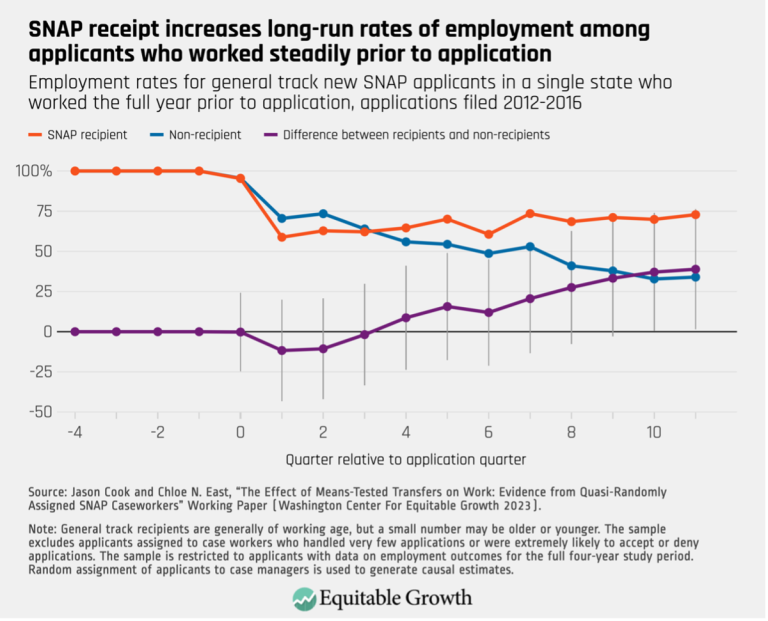
SNAP receipt increases long-run rates of employment among applicants who worked steadily prior to application (opens in a new tab)
Visualizations Nov 8, 2023
 View Chart
(opens in a new tab)
View Chart
(opens in a new tab)
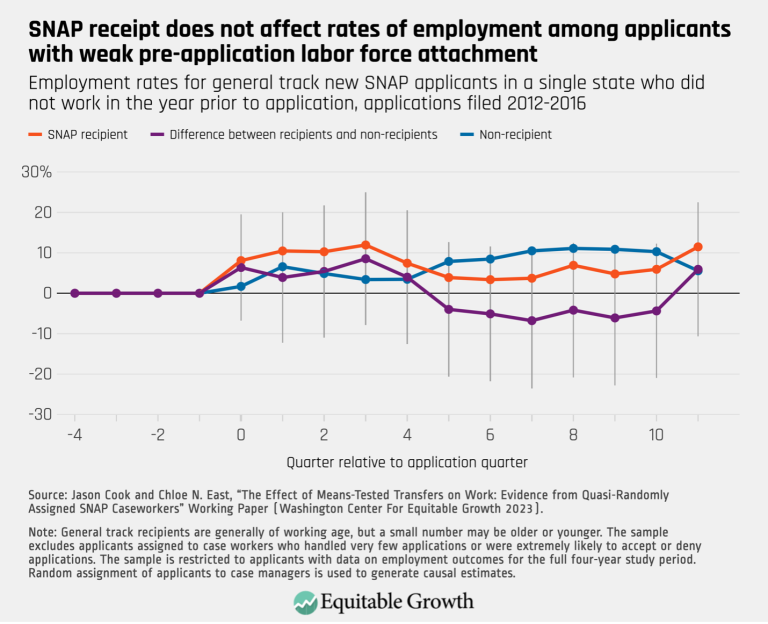
SNAP receipt does not affect rates of employment among applicants with weak pre-application labor force attachment (opens in a new tab)
Visualizations Nov 8, 2023
 View Chart
(opens in a new tab)
View Chart
(opens in a new tab)
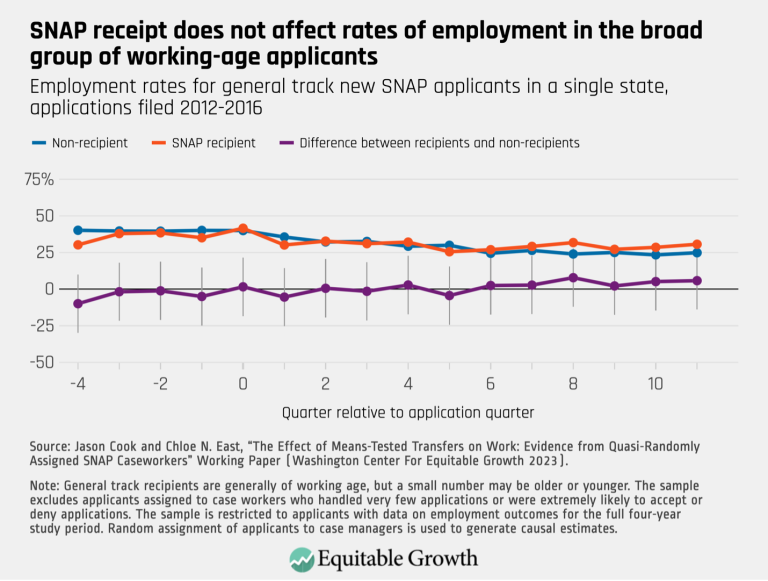
SNAP receipt does not affect rates of employment in the broad group of working-age applicant (opens in a new tab)
Visualizations Nov 8, 2023
 View Chart
(opens in a new tab)
View Chart
(opens in a new tab)
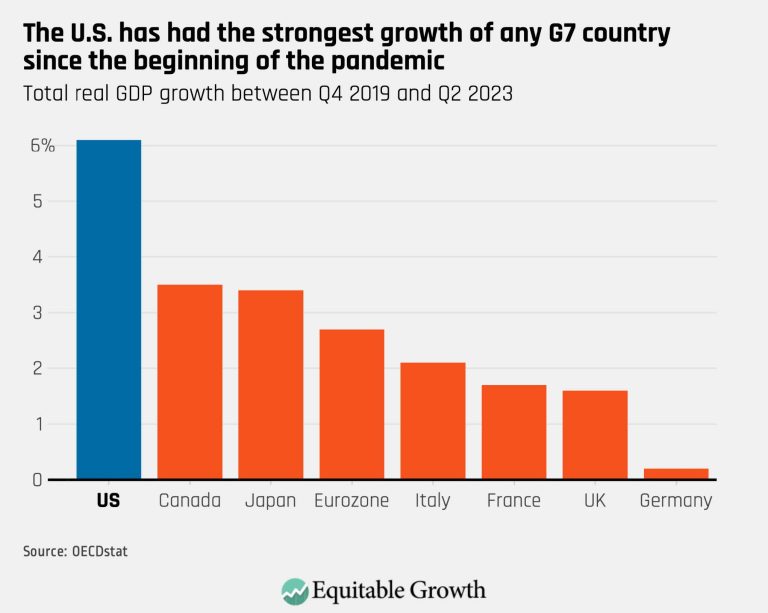
The U.S. has had the strongest growth of any G7 country since the beginning of the pandemic (opens in a new tab)
Visualizations Sep 20, 2023
 View Chart
(opens in a new tab)
View Chart
(opens in a new tab)
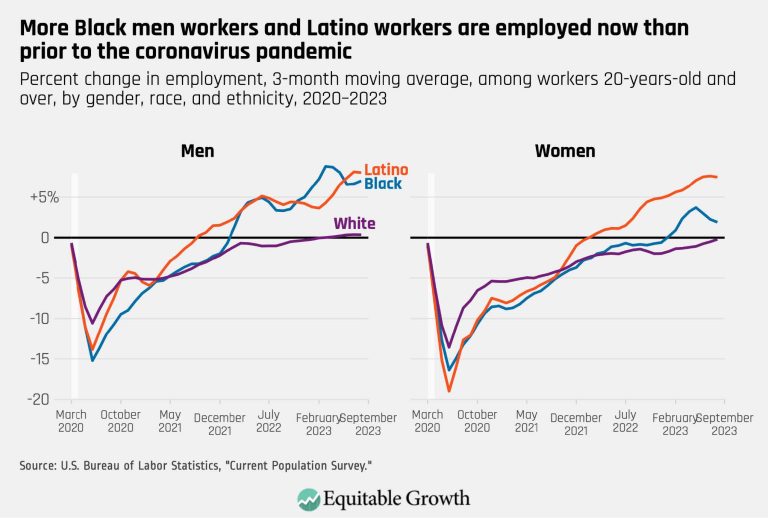
More Black men workers and Latino workers are employed now than prior to the coronavirus pandemic (opens in a new tab)
Visualizations Sep 20, 2023
 View Chart
(opens in a new tab)
View Chart
(opens in a new tab)
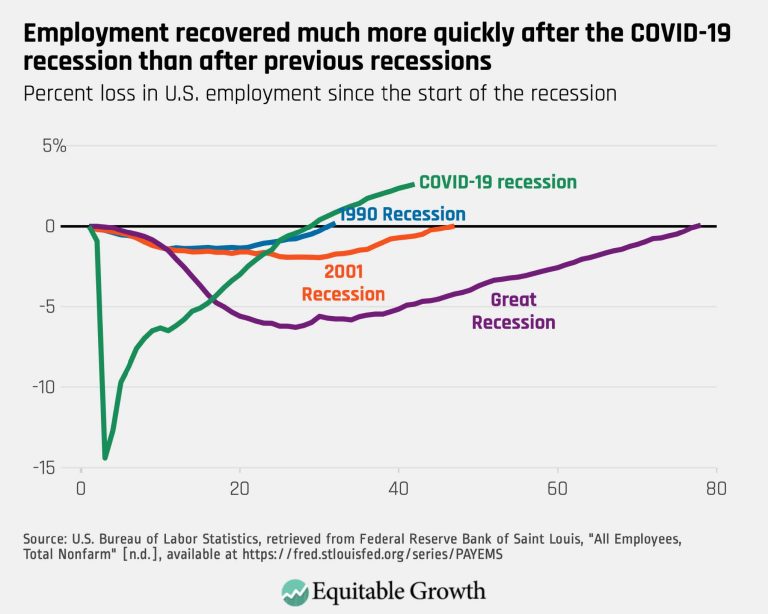
Employment recovered much more quickly after the COVID-19 recession than after previous recessions (opens in a new tab)
Visualizations Sep 20, 2023
 View Chart
(opens in a new tab)
View Chart
(opens in a new tab)
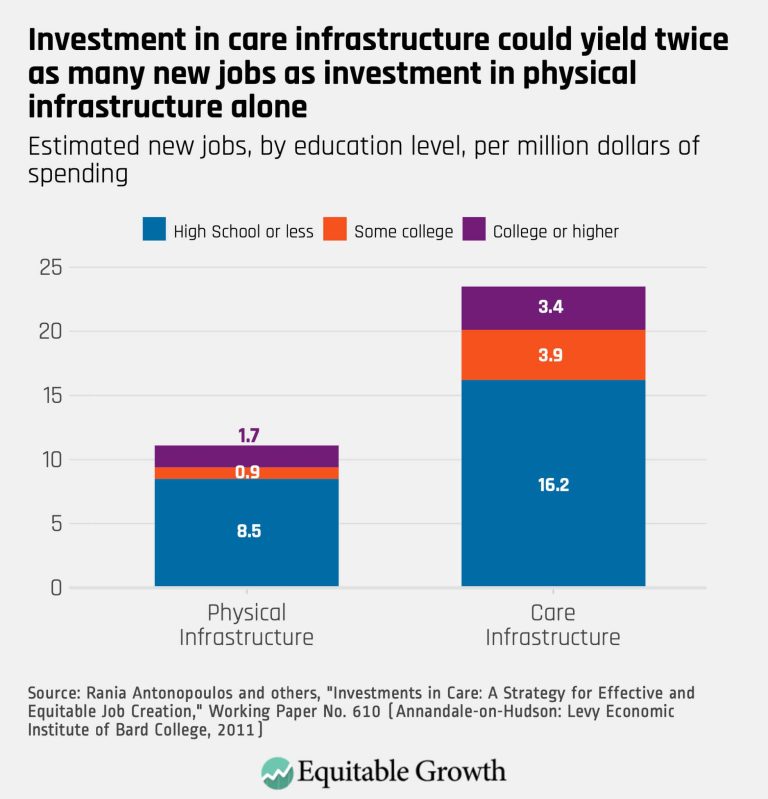
Investment in care infrastructure could yield twice as many new jobs as investment in physical infrastructure alone (opens in a new tab)
Visualizations Sep 19, 2023
 View Chart
(opens in a new tab)
View Chart
(opens in a new tab)
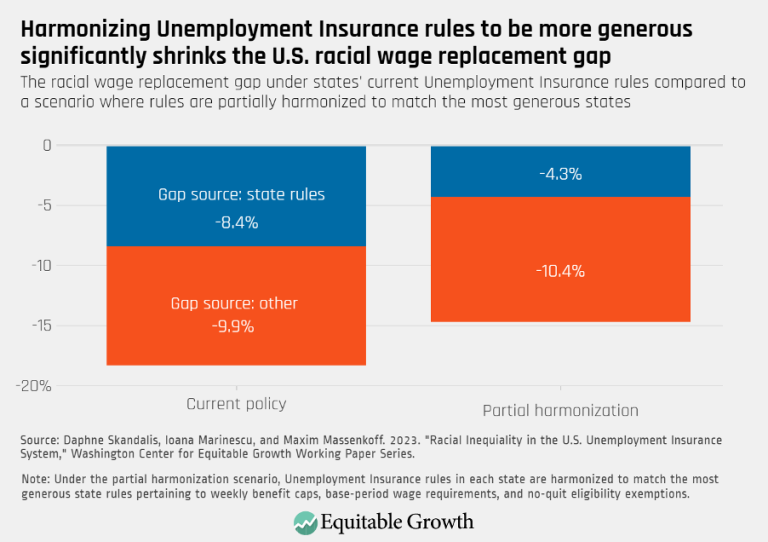
Harmonizing Unemployment Insurance rules to be more generous significantly shrinks the U.S. racial wage replacement gap (opens in a new tab)
Visualizations Jul 19, 2023
 View Chart
(opens in a new tab)
View Chart
(opens in a new tab)
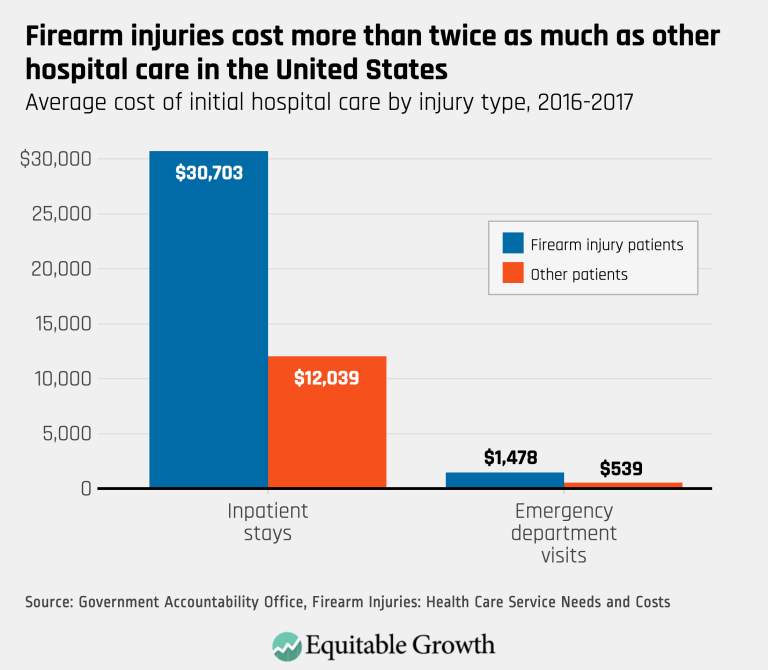
Firearm injuries cost more than twice as much as other hospital care in the United States (opens in a new tab)
Visualizations Jul 13, 2023
 View Chart
(opens in a new tab)
View Chart
(opens in a new tab)
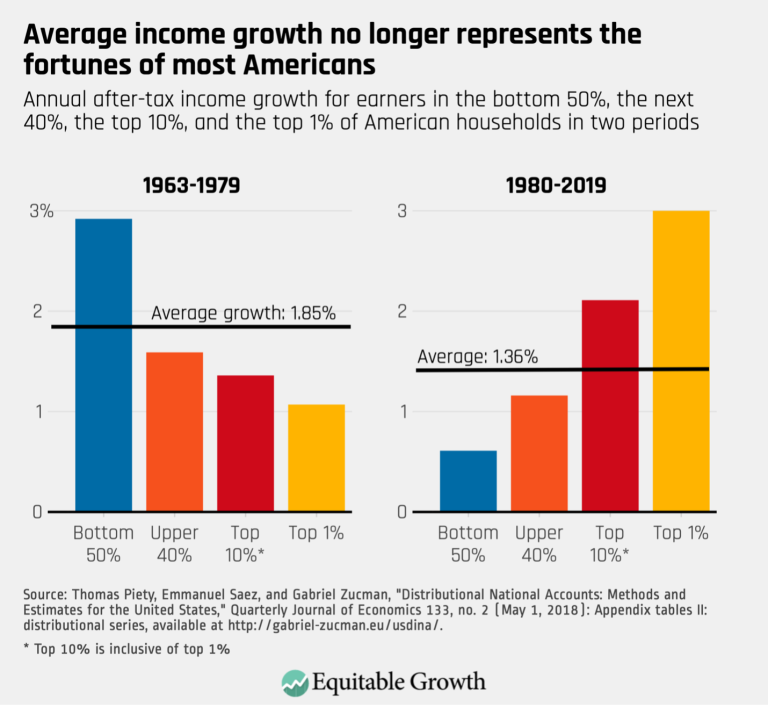
Average income growth no longer represents the fortunes of most Americans (opens in a new tab)
Visualizations Jul 11, 2023
 View Chart
(opens in a new tab)
View Chart
(opens in a new tab)
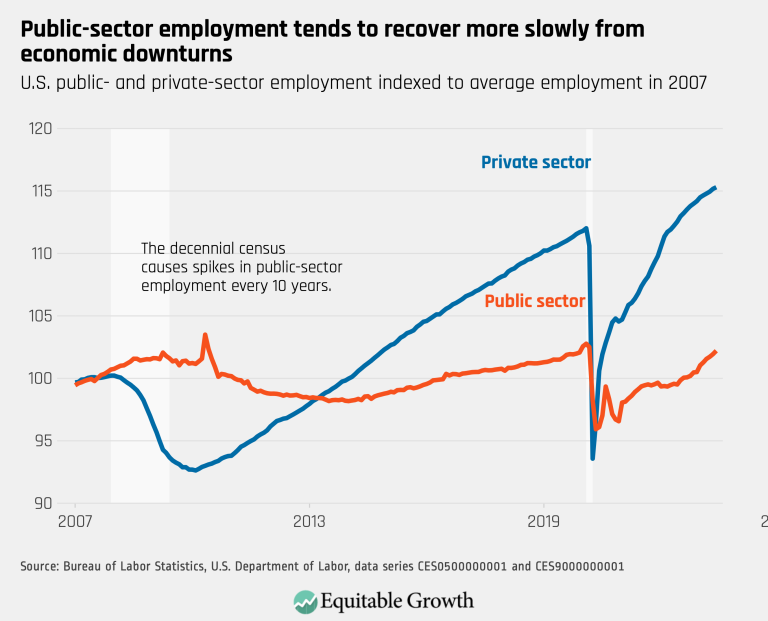
Public-sector employment tends to recover more slowly from economic downturns (opens in a new tab)
Visualizations Jul 7, 2023
 View Chart
(opens in a new tab)
View Chart
(opens in a new tab)
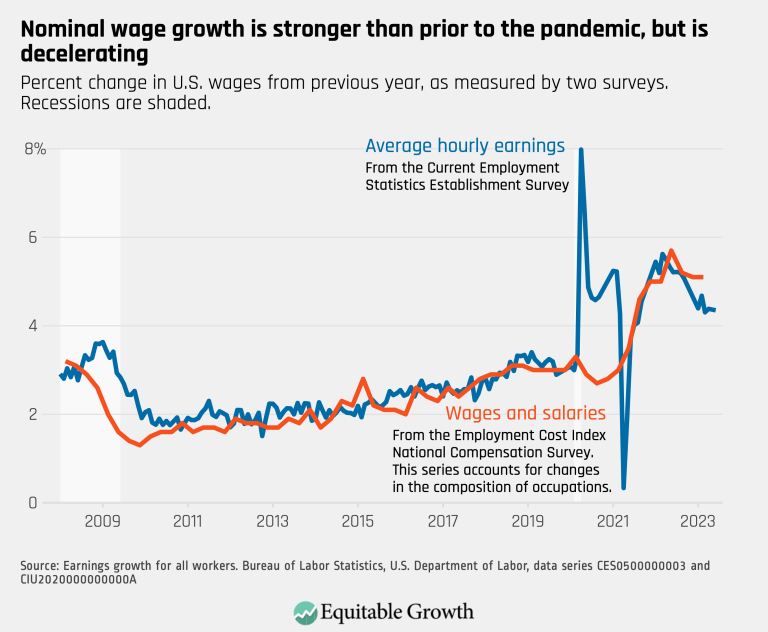
Nominal wage growth is stronger than prior to the pandemic, but is decelerating (opens in a new tab)
Visualizations Jul 7, 2023
 View Chart
(opens in a new tab)
View Chart
(opens in a new tab)
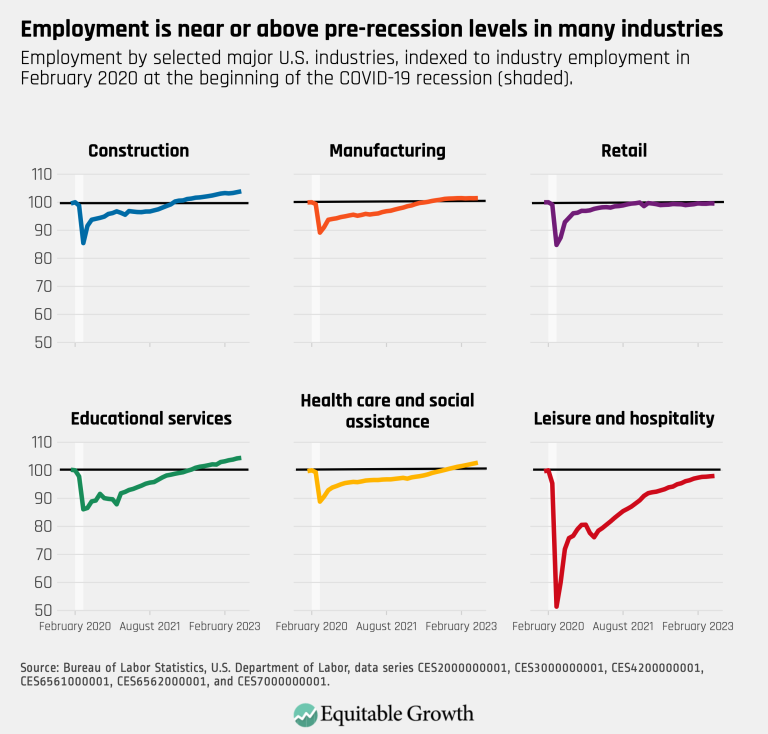
Employment is near or above pre-recession levels in many industries (opens in a new tab)
Visualizations Jul 7, 2023
 View Chart
(opens in a new tab)
View Chart
(opens in a new tab)
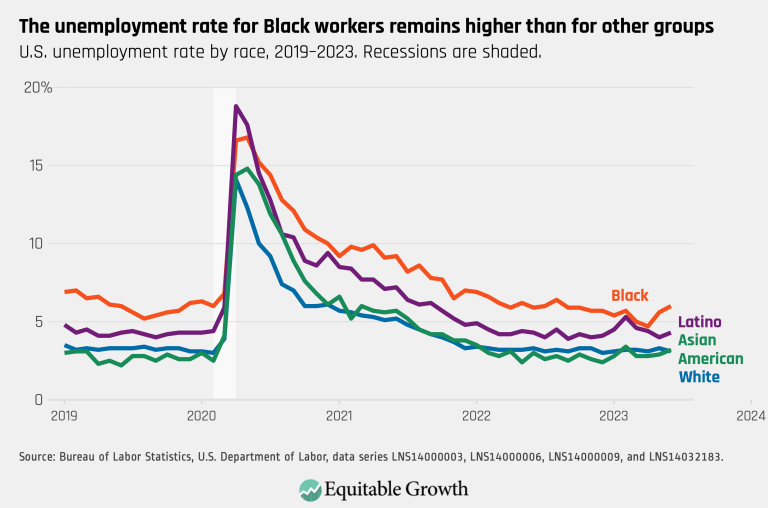
The unemployment rate for Black workers remains higher than for other groups (opens in a new tab)
Visualizations Jul 7, 2023
 View Chart
(opens in a new tab)
View Chart
(opens in a new tab)
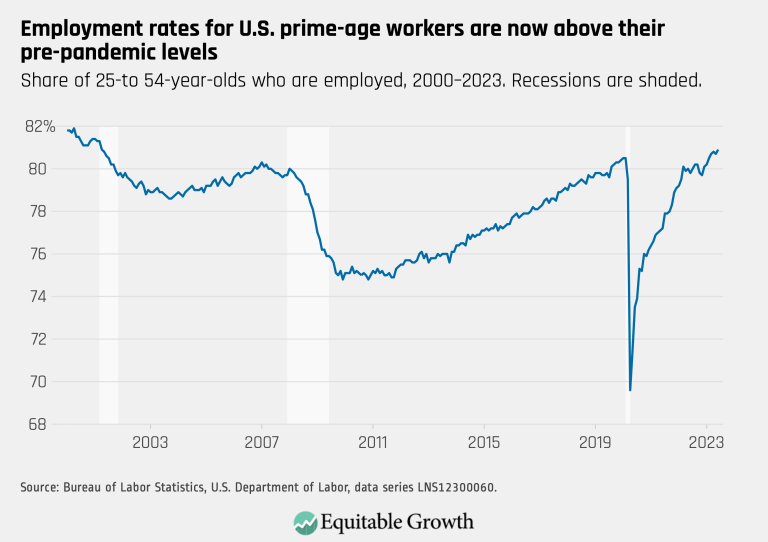
Employment rates for U.S. prime-age workers are now above their pre-pandemic levels (opens in a new tab)
Visualizations Jul 7, 2023
 View Chart
(opens in a new tab)
View Chart
(opens in a new tab)
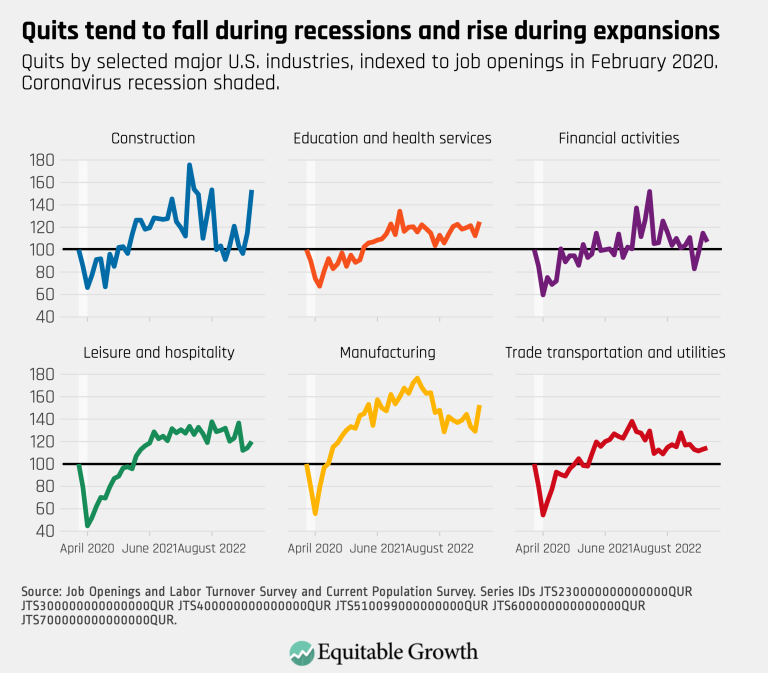
playfair-8 (opens in a new tab)
Visualizations Jul 6, 2023
 View Chart
(opens in a new tab)
View Chart
(opens in a new tab)
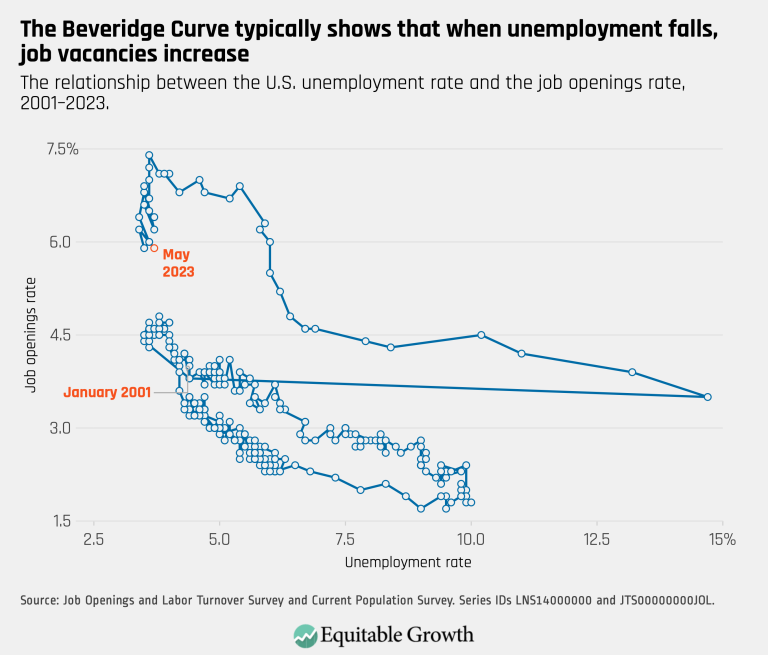
The Beveridge Curve typically shows that when unemployment falls, job vacancies increase (opens in a new tab)
Visualizations Jul 6, 2023
 View Chart
(opens in a new tab)
View Chart
(opens in a new tab)
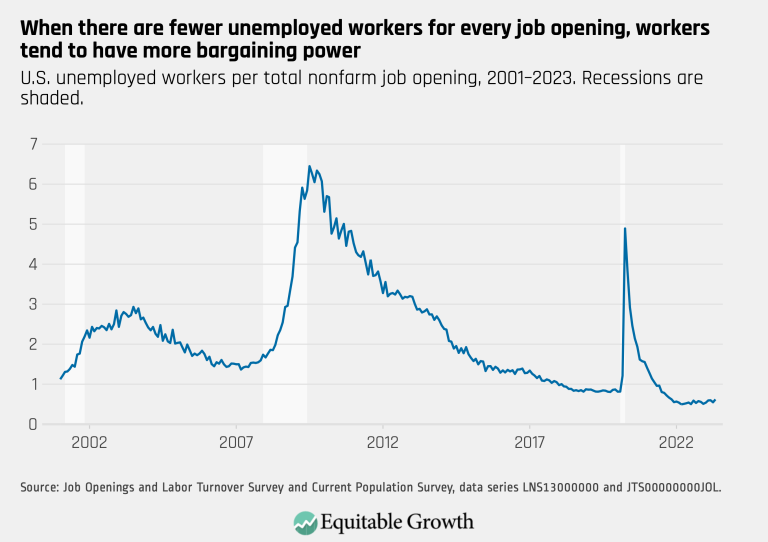
When there are fewer unemployed workers for every job opening, workers tend to have more bargaining power (opens in a new tab)
Visualizations Jul 6, 2023
 View Chart
(opens in a new tab)
View Chart
(opens in a new tab)
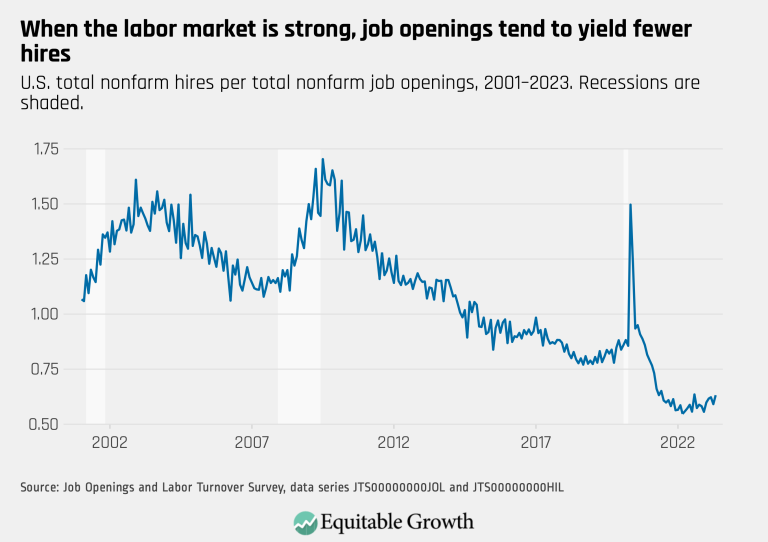
When the labor market is strong, job openings tend to yield fewer hires (opens in a new tab)
Visualizations Jul 6, 2023












































Your Source for the Latest Insights
Get updates on our latest research, event announcements, and policy insights delivered straight to your inbox. Stay connected with the leading voices on equitable growth.