


Resources
From peer-reviewed research to accessible policy briefs, explore the scholarship that’s shaping debates and driving change.

1,505 Results

 View Chart
(opens in a new tab)
View Chart
(opens in a new tab)
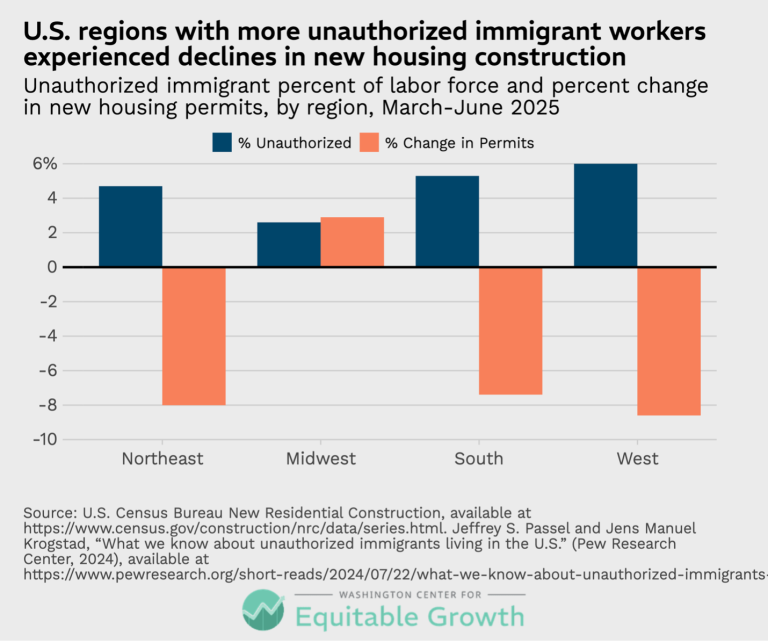
U.S. regions with more unauthorized immigrant workers experienced declines in new housing construction (opens in a new tab)
Visualizations AUG 31, 2026
 View Chart
(opens in a new tab)
View Chart
(opens in a new tab)
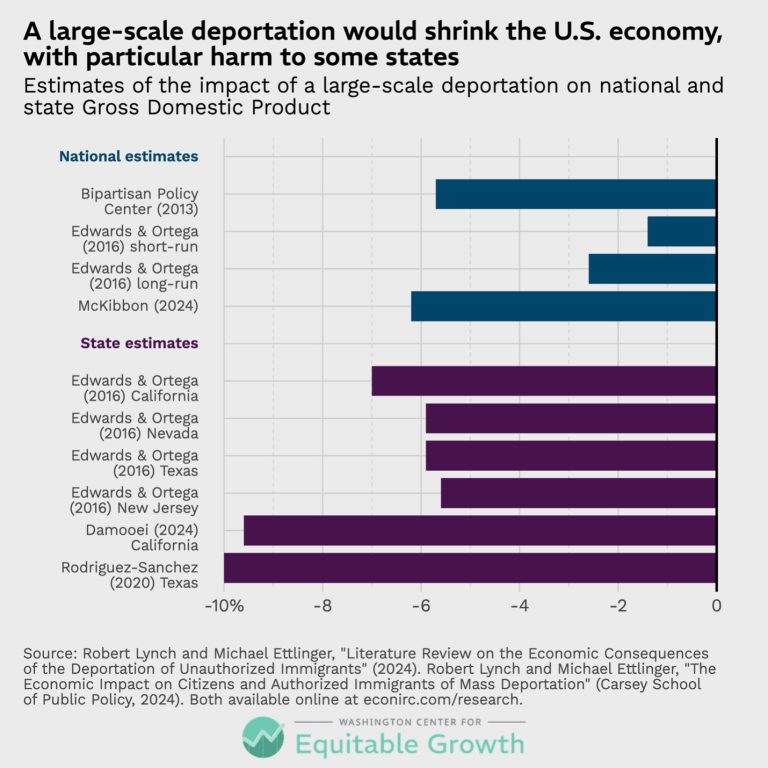
A large-scale deportation would shrink the U.S. economy, with particular harm to some states (opens in a new tab)
Visualizations AUG 31, 2026
 View Chart
(opens in a new tab)
View Chart
(opens in a new tab)
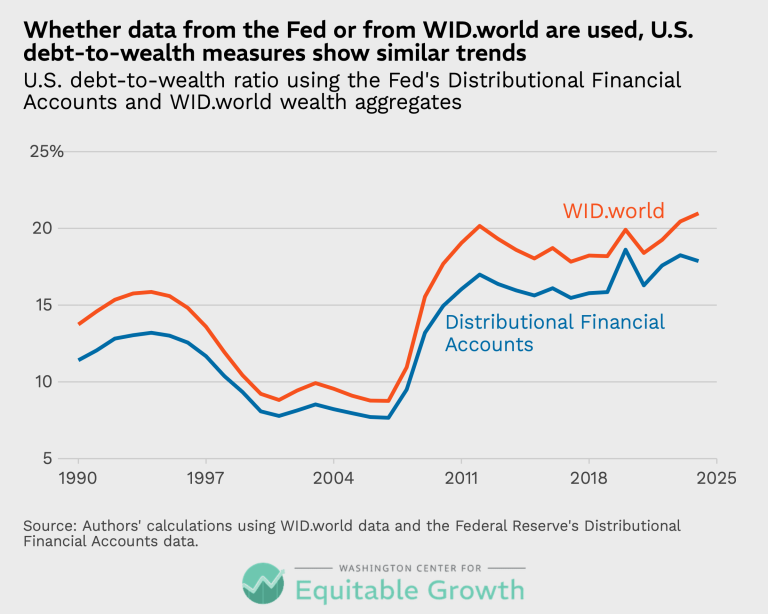
Whether data from the Fed or from WID.world are used, U.S. debt-to-wealth measures show similar trends (opens in a new tab)
Visualizations JUL 22, 2026
 View Chart
(opens in a new tab)
View Chart
(opens in a new tab)
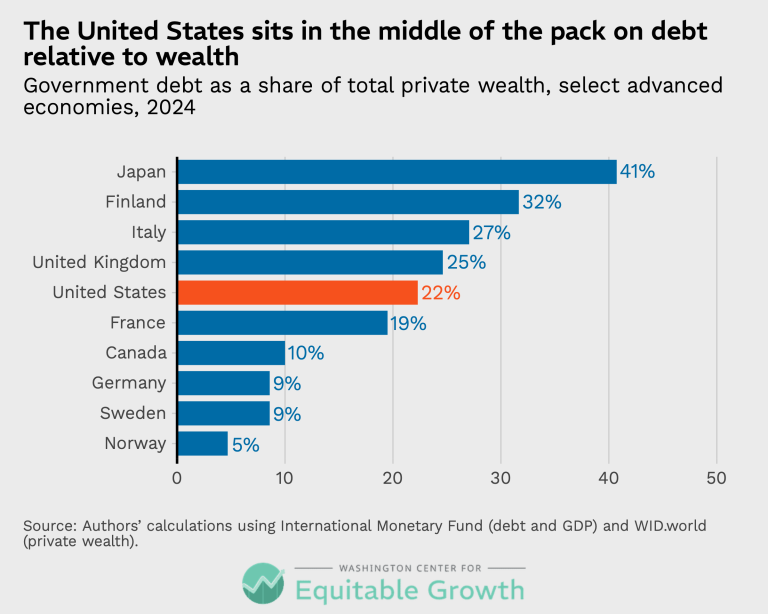
The United States sits in the middle of the pack on debt relative to wealth (opens in a new tab)
Visualizations JUL 22, 2026
 View Chart
(opens in a new tab)
View Chart
(opens in a new tab)
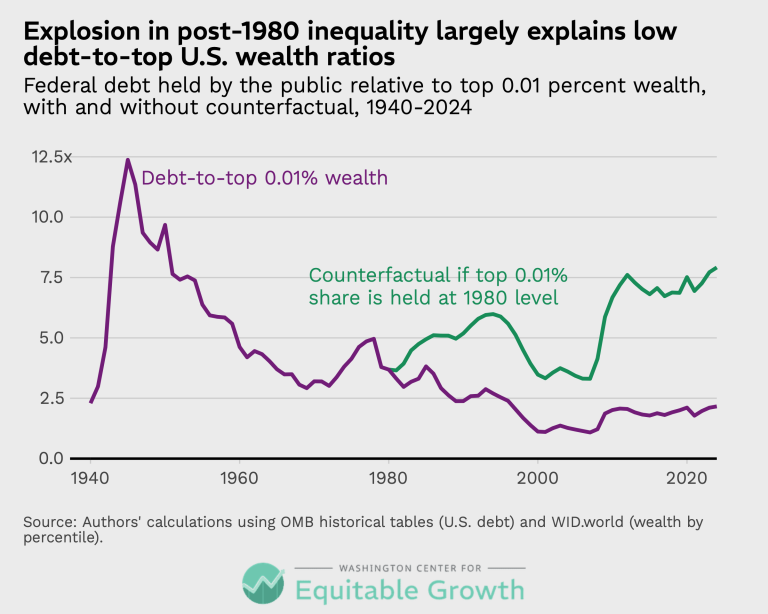
Explosion in post-1980 inequality largely explains low debt-to-top U.S. wealth ratios (opens in a new tab)
Visualizations JUL 22, 2026
 View Chart
(opens in a new tab)
View Chart
(opens in a new tab)
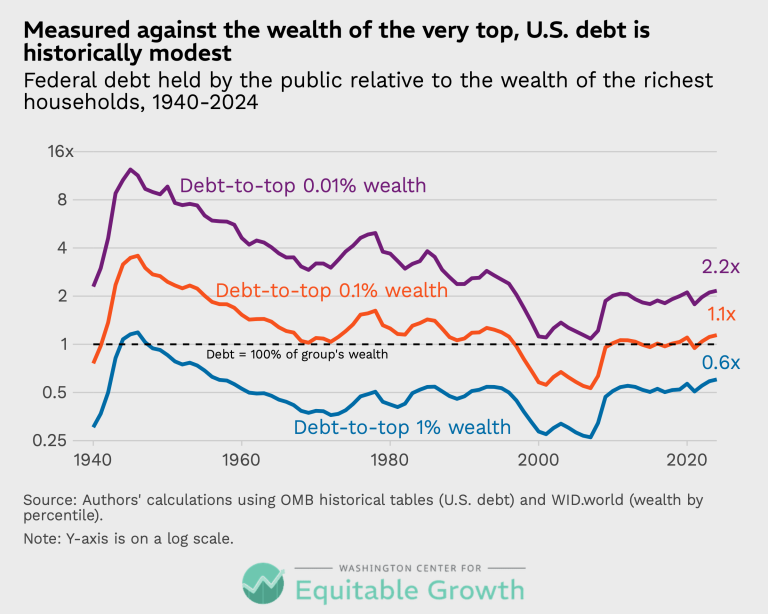
Measured against the wealth of the very top, U.S. debt is historically modest (opens in a new tab)
Visualizations JUL 22, 2026
 View Chart
(opens in a new tab)
View Chart
(opens in a new tab)
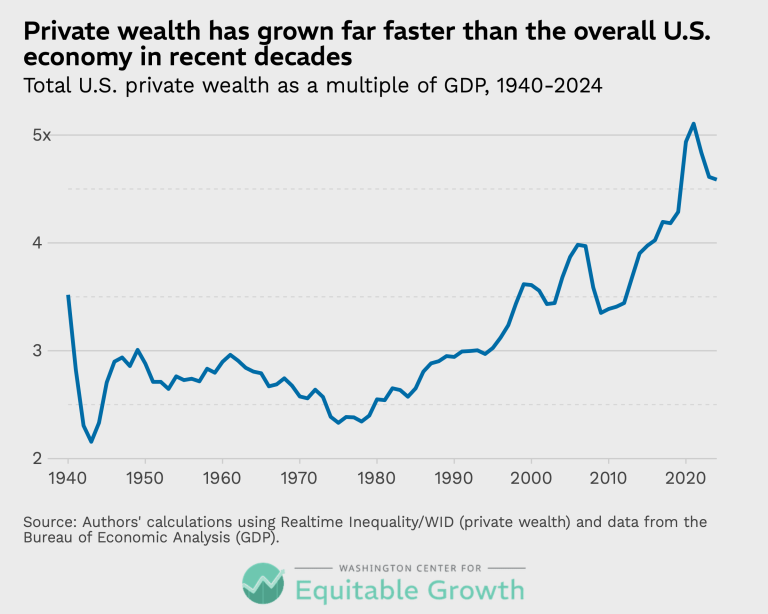
Private wealth has grown far faster than the overall U.S. economy in recent decades (opens in a new tab)
Visualizations JUL 22, 2026
 View Chart
(opens in a new tab)
View Chart
(opens in a new tab)
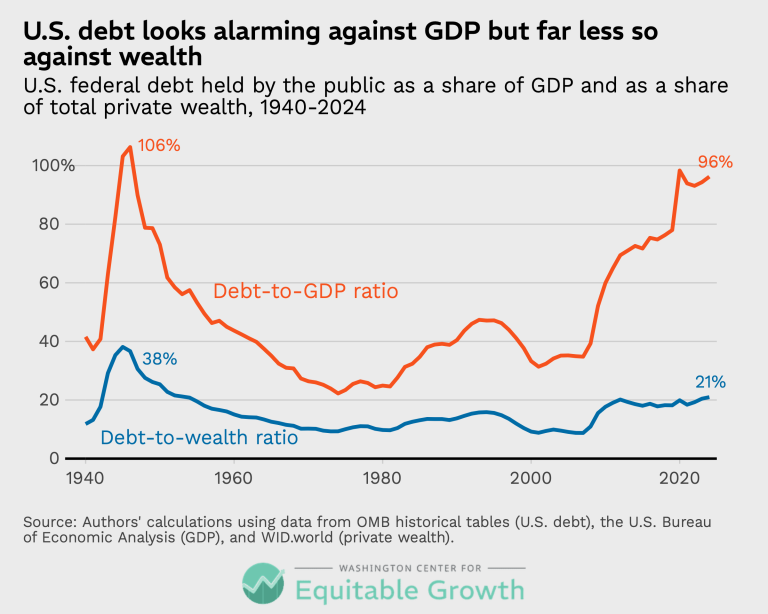
U.S. debt looks alarming against GDP but far less so against wealth (opens in a new tab)
Visualizations JUL 22, 2026
 View Chart
(opens in a new tab)
View Chart
(opens in a new tab)
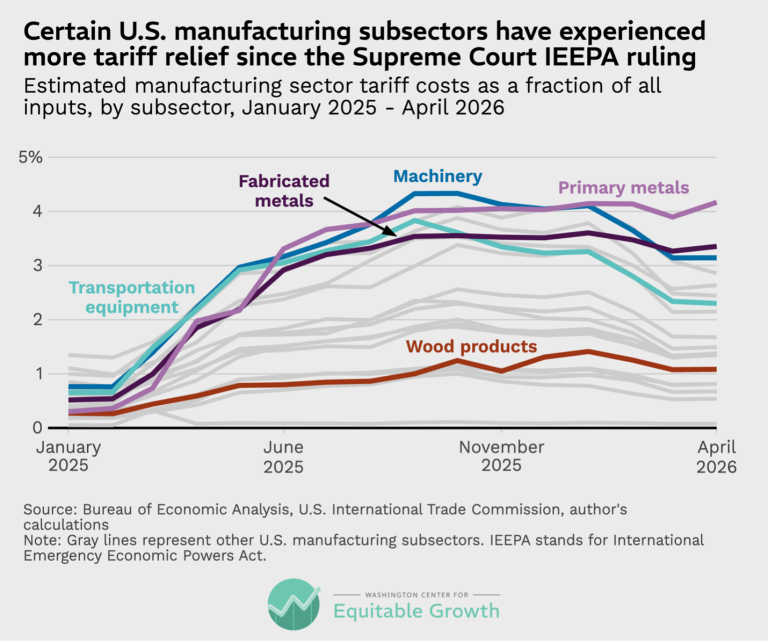
Certain U.S. manufacturing subsectors have experienced more tariff relief since the Supreme Court IEEPA ruling (opens in a new tab)
Visualizations JUL 13, 2026
 View Chart
(opens in a new tab)
View Chart
(opens in a new tab)
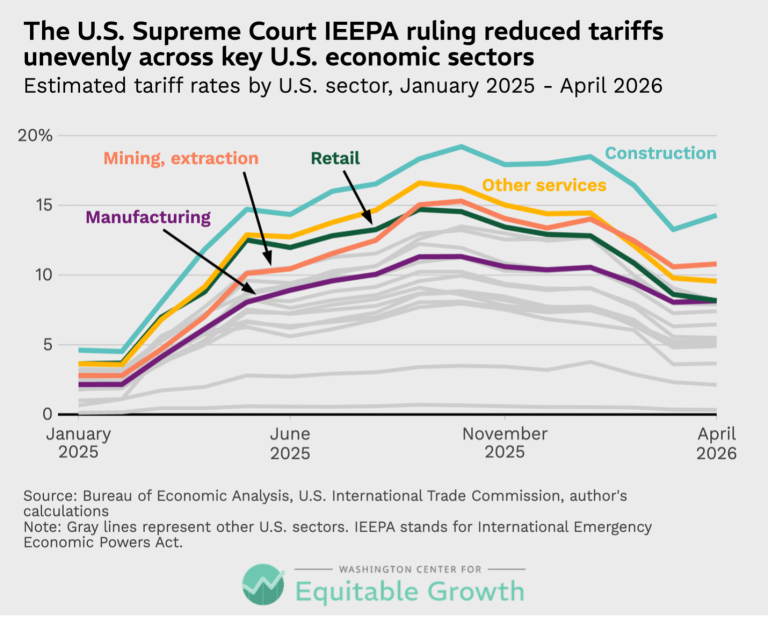
The U.S. Supreme Court IEEPA ruling reduced tariffs unevenly across key U.S. economic sectors (opens in a new tab)
Visualizations JUL 13, 2026
 View Chart
(opens in a new tab)
View Chart
(opens in a new tab)
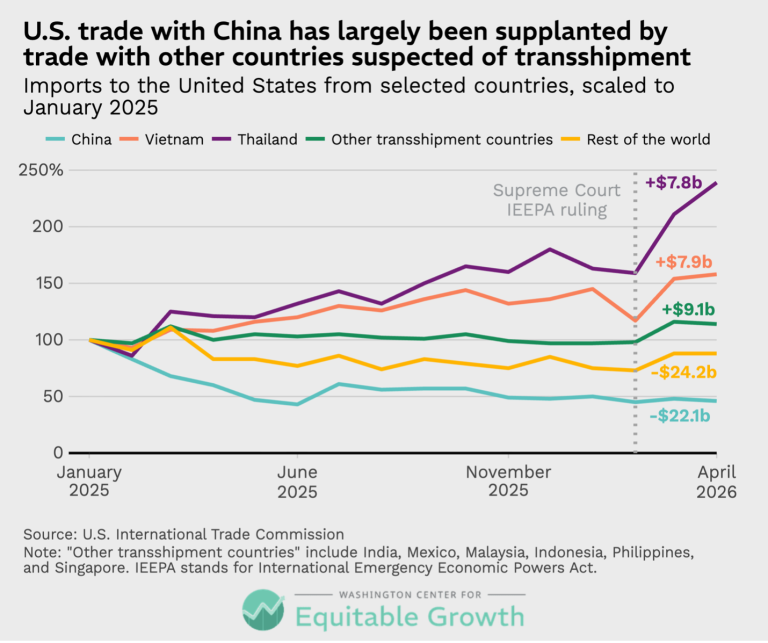
U.S. trade with China has largely been supplanted by trade with other countries suspected of transshipment (opens in a new tab)
Visualizations JUL 13, 2026
 View Chart
(opens in a new tab)
View Chart
(opens in a new tab)
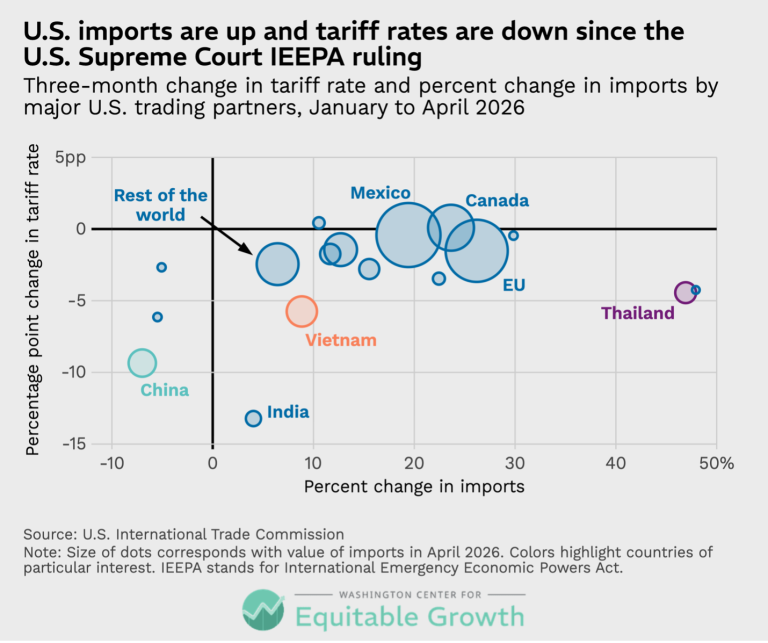
U.S. imports are up and tariff rates are down since the U.S. Supreme Court IEEPA ruling (opens in a new tab)
Visualizations JUL 13, 2026
 View Chart
(opens in a new tab)
View Chart
(opens in a new tab)
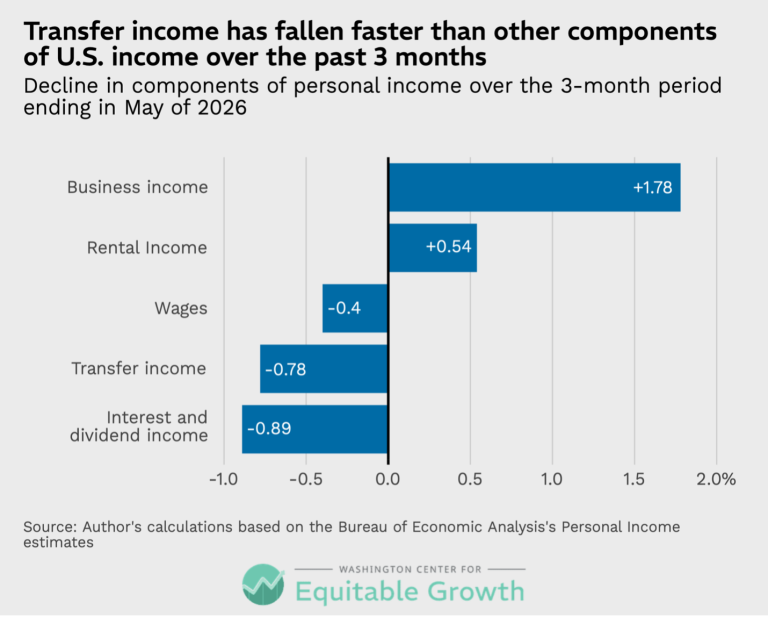
Transfer income has fallen faster than other components of U.S. income over the past 3 months (opens in a new tab)
Visualizations JUN 25, 2026
 View Chart
(opens in a new tab)
View Chart
(opens in a new tab)
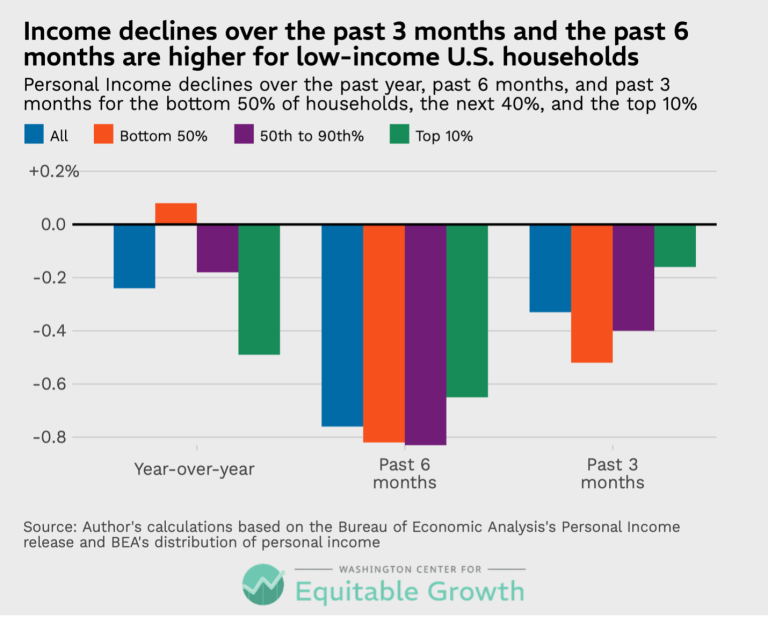
Income declines over the past 3 months and the past 6 months are higher for low-income U.S. households (opens in a new tab)
Visualizations JUN 25, 2026
 View Chart
(opens in a new tab)
View Chart
(opens in a new tab)
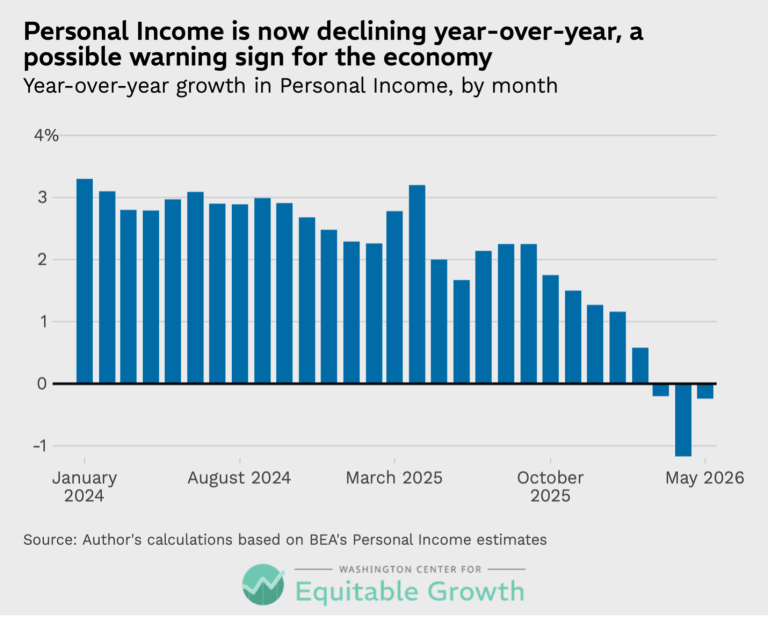
Personal Income is now declining year-over-year, a possible warning sign for the economy (opens in a new tab)
Visualizations JUN 25, 2026
 View Chart
(opens in a new tab)
View Chart
(opens in a new tab)
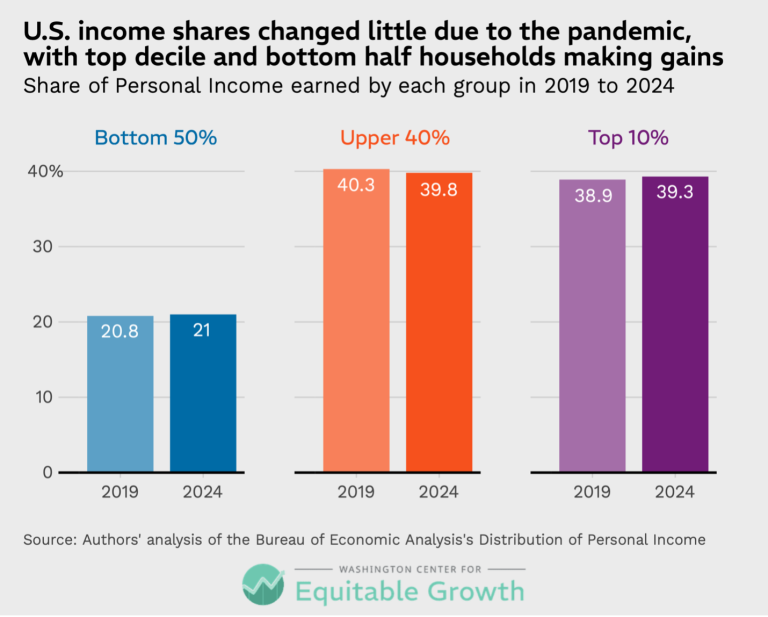
U.S. income shares changed little due to the pandemic, with top decile and bottom half households making gains (opens in a new tab)
Visualizations JUN 24, 2026
 View Chart
(opens in a new tab)
View Chart
(opens in a new tab)
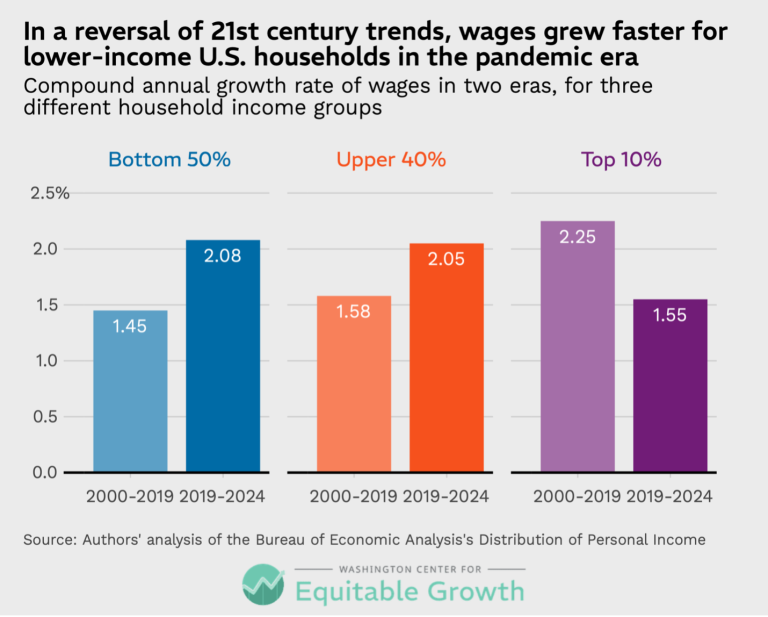
In a reversal of 21st century trends, wages grew faster for lower-income U.S. households in the pandemic era (opens in a new tab)
Visualizations JUN 24, 2026
 View Chart
(opens in a new tab)
View Chart
(opens in a new tab)
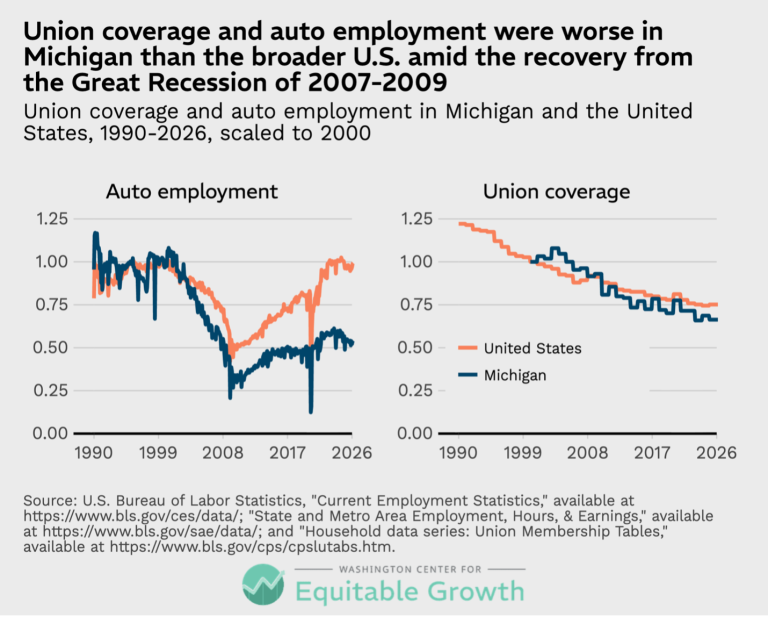
Union coverage and auto employment were worse in Michigan than the broader U.S. amid the recovery from the Great Recession of 2007-2009 (opens in a new tab)
Visualizations JUN 3, 2026
 View Chart
(opens in a new tab)
View Chart
(opens in a new tab)
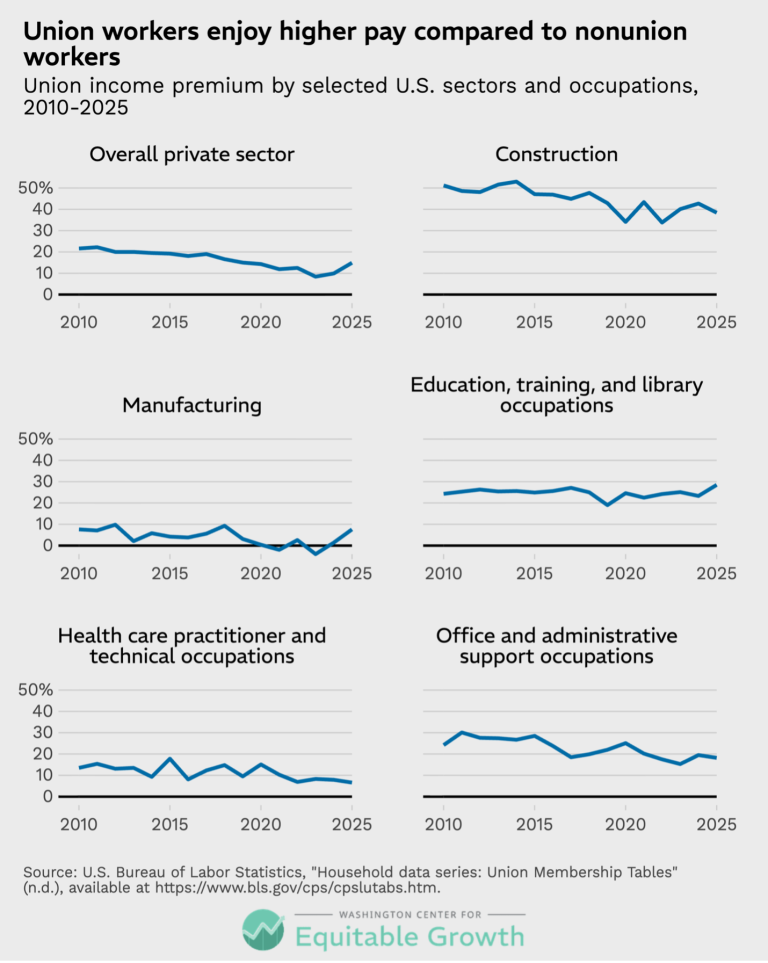
Union workers enjoy higher pay compared to nonunion workers (opens in a new tab)
Visualizations JUN 3, 2026
 View Chart
(opens in a new tab)
View Chart
(opens in a new tab)
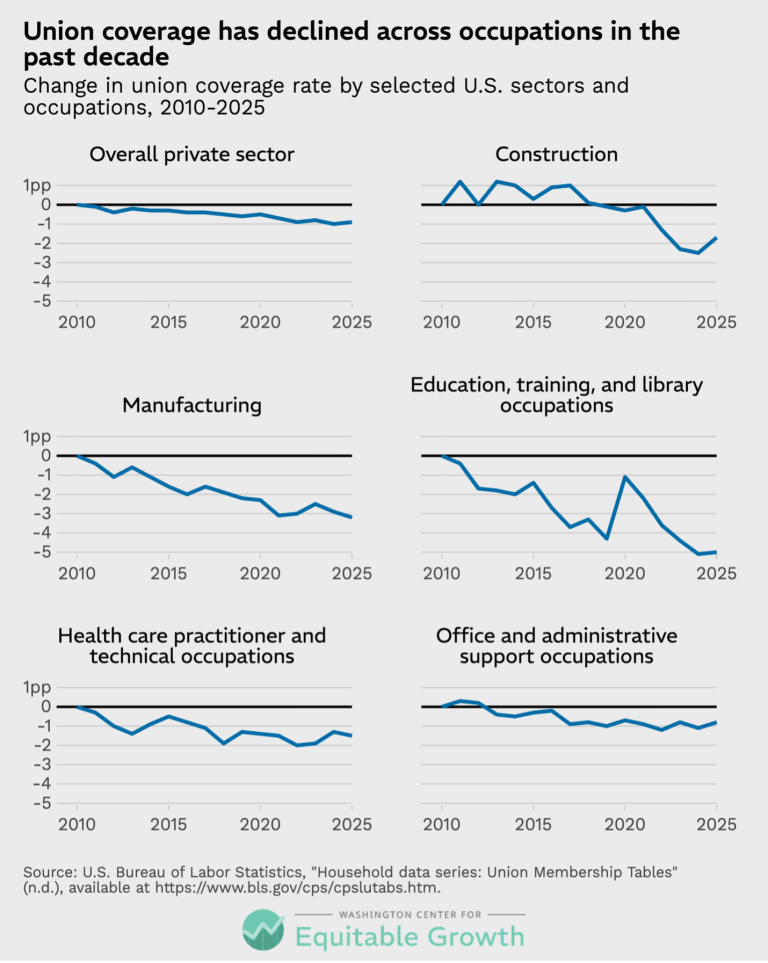
Union coverage has declined across occupations in the past decade (opens in a new tab)
Visualizations JUN 3, 2026
 View Chart
(opens in a new tab)
View Chart
(opens in a new tab)
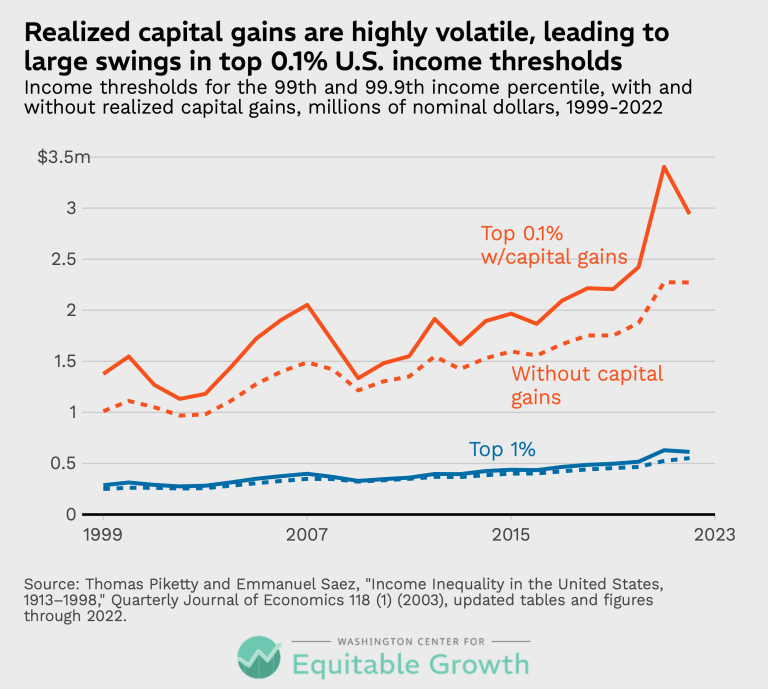
Realized capital gains are highly volatile, leading to large swings in the top 0.1% U.S. income thresholds (opens in a new tab)
Visualizations MAY 26, 2026
 View Chart
(opens in a new tab)
View Chart
(opens in a new tab)
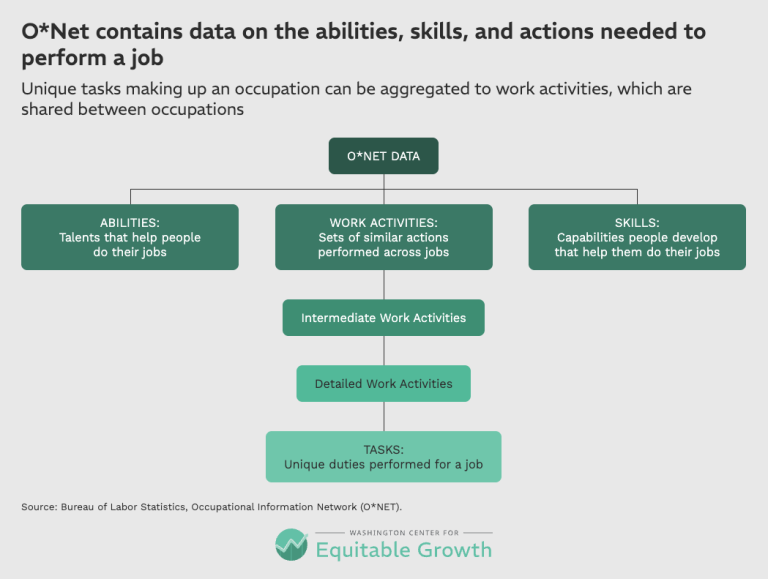
O*NET contains data on the abilities, skills, and actions needed to perform a job – revised (opens in a new tab)
Visualizations MAY 20, 2026
 View Chart
(opens in a new tab)
View Chart
(opens in a new tab)
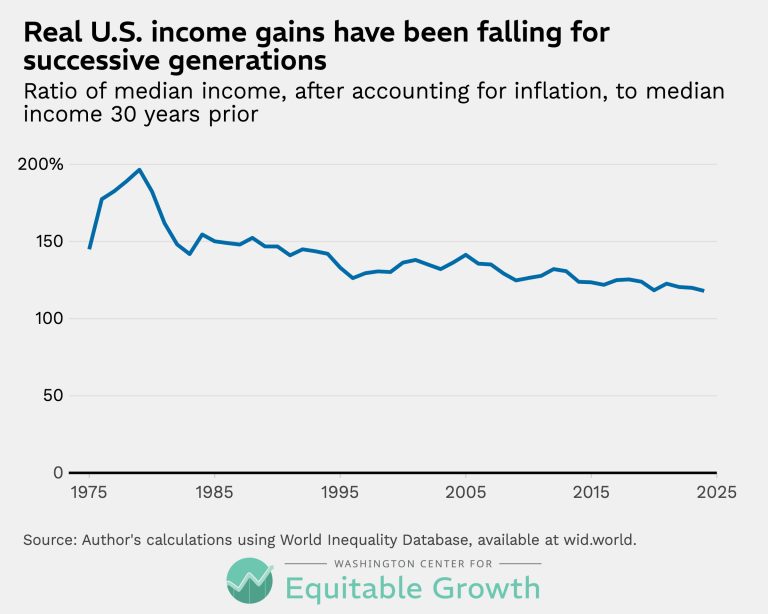
Real U.S. income gains have been falling for successive generations (opens in a new tab)
Visualizations MAY 13, 2026
 View Chart
(opens in a new tab)
View Chart
(opens in a new tab)
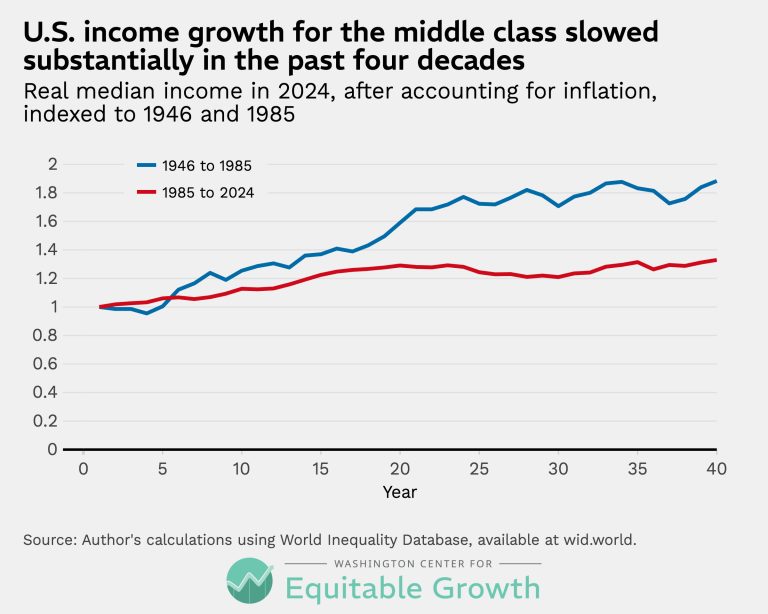
U.S. income growth for the middle class slowed substantially in the past four decades (opens in a new tab)
Visualizations MAY 13, 2026
 View Chart
(opens in a new tab)
View Chart
(opens in a new tab)
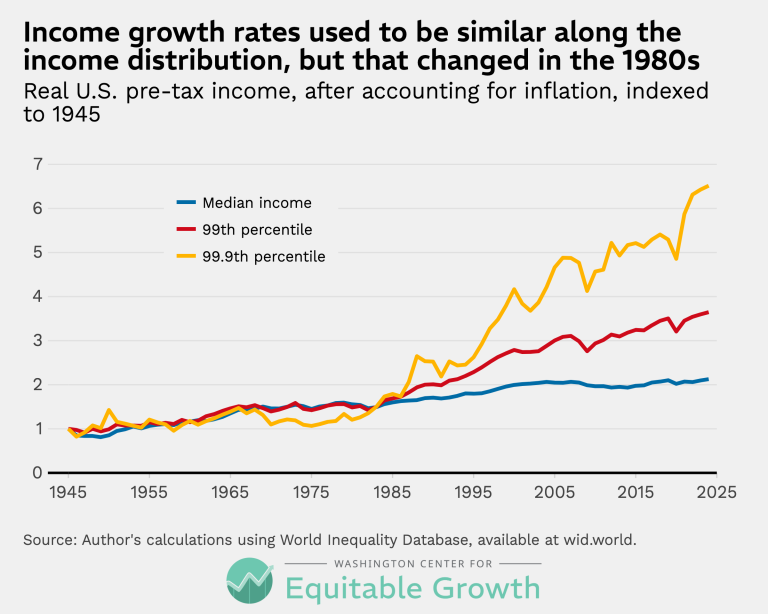
Income growth rates used to be similar along the income distribution, but that changed in the 1980s (opens in a new tab)
Visualizations MAY 13, 2026
 View Chart
(opens in a new tab)
View Chart
(opens in a new tab)
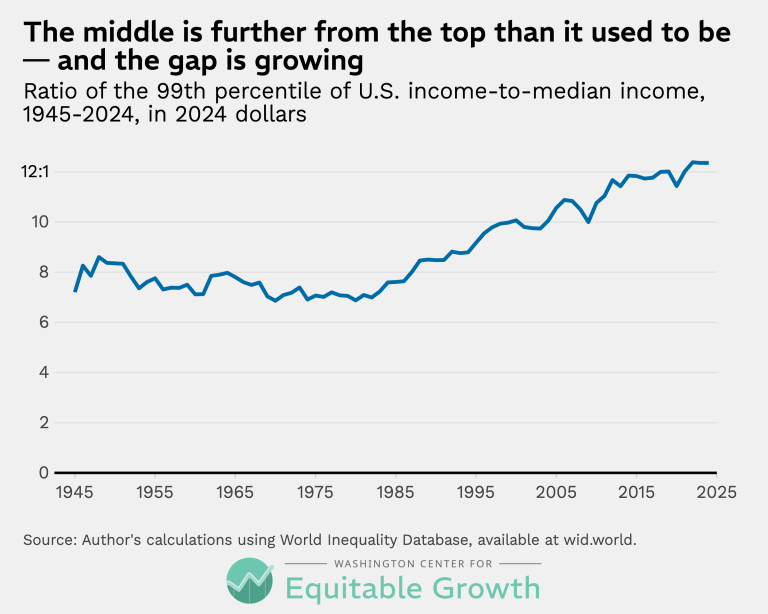
The middle is further from the top than it used to be—and the gap is growing (opens in a new tab)
Visualizations MAY 13, 2026
 View Chart
(opens in a new tab)
View Chart
(opens in a new tab)
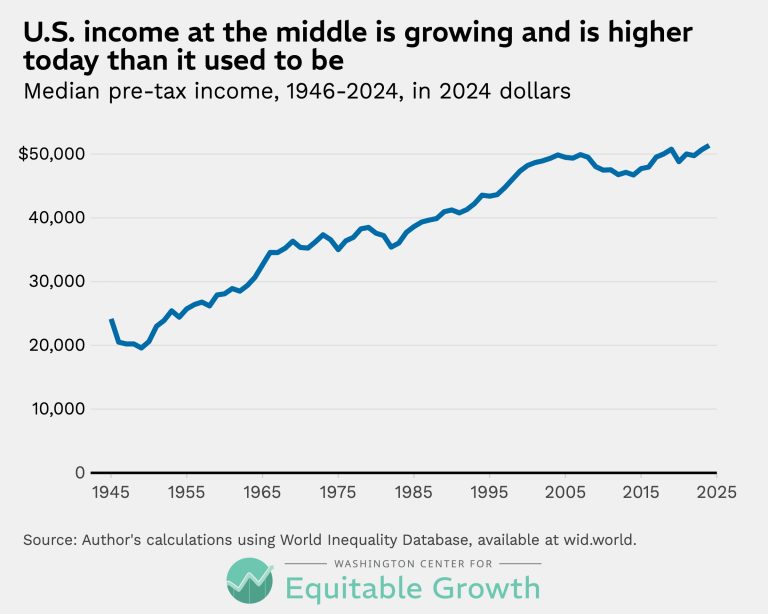
U.S. income at the middle is growing and is higher today than it used to be (opens in a new tab)
Visualizations MAY 13, 2026
 View Chart
(opens in a new tab)
View Chart
(opens in a new tab)
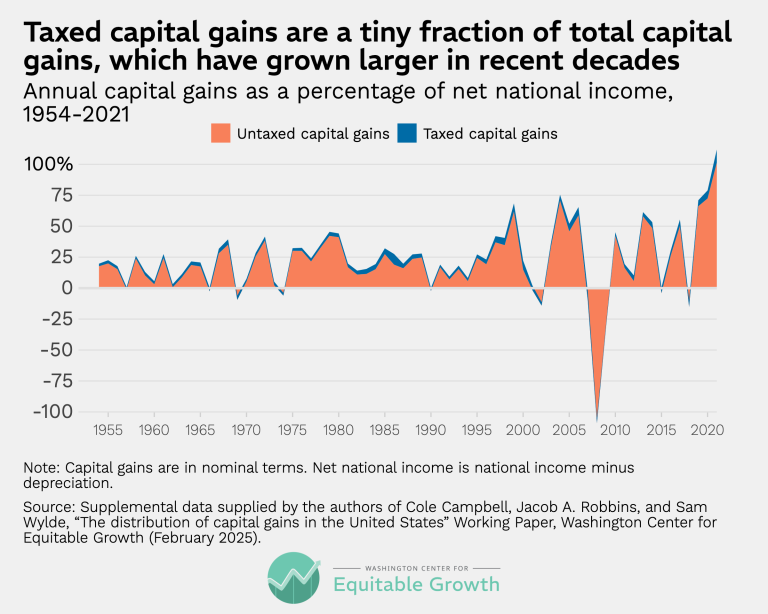
Taxed capital gains are a tiny fraction of total capital gains, which have grown larger in recent decades (opens in a new tab)
Visualizations MAY 6, 2026
 View Chart
(opens in a new tab)
View Chart
(opens in a new tab)
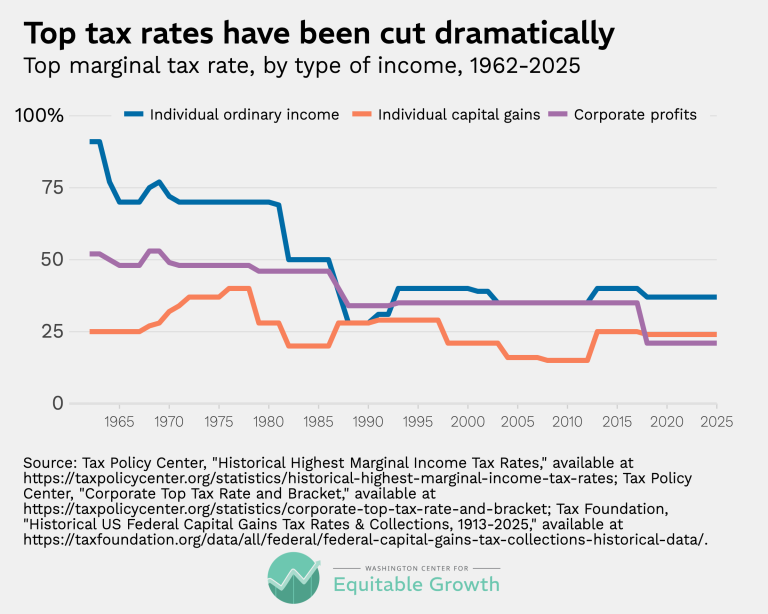
Top tax rates have been cut dramatically (opens in a new tab)
Visualizations MAY 6, 2026
 View Chart
(opens in a new tab)
View Chart
(opens in a new tab)
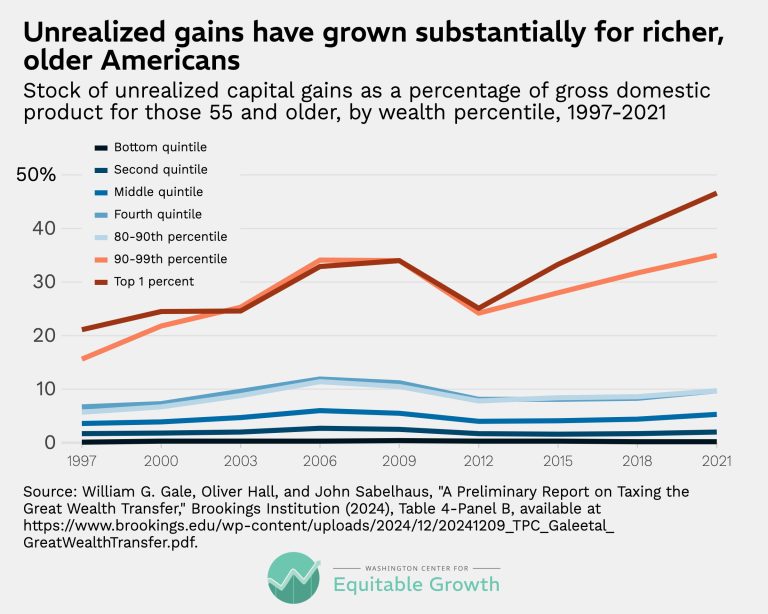
Unrealized gains have grown substantially for richer, older Americans (opens in a new tab)
Visualizations MAY 6, 2026
 View Chart
(opens in a new tab)
View Chart
(opens in a new tab)
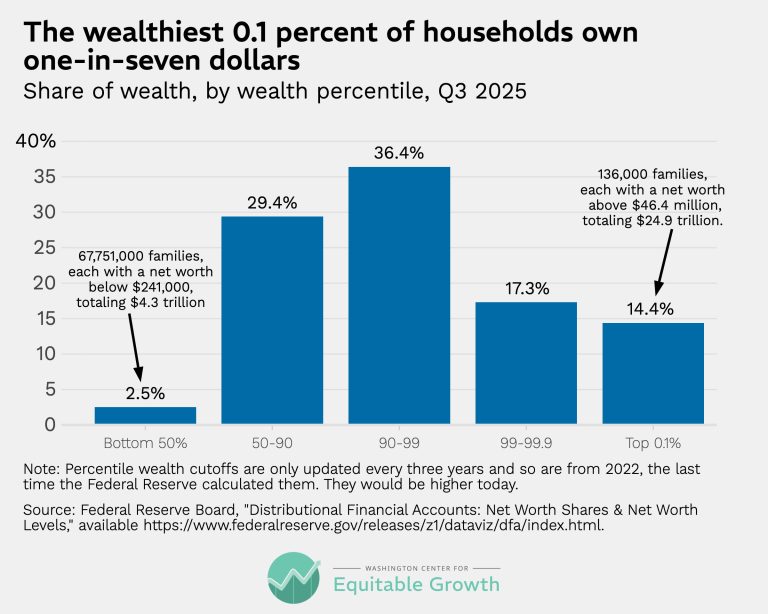
The wealthiest 0.1 percent of households own one-in-seven dollars (opens in a new tab)
Visualizations MAY 6, 2026
 View Chart
(opens in a new tab)
View Chart
(opens in a new tab)
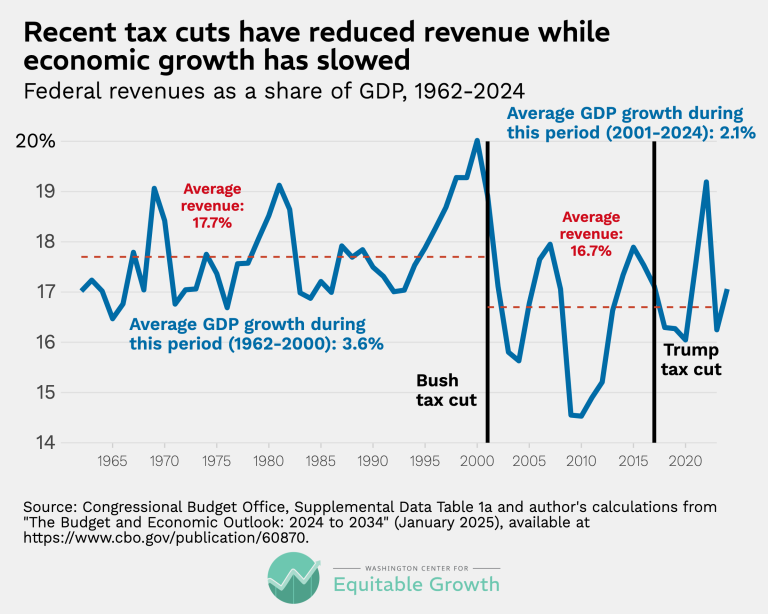
Recent tax cuts have reduced revenue while economic growth has slowed (opens in a new tab)
Visualizations MAY 6, 2026
 View Chart
(opens in a new tab)
View Chart
(opens in a new tab)
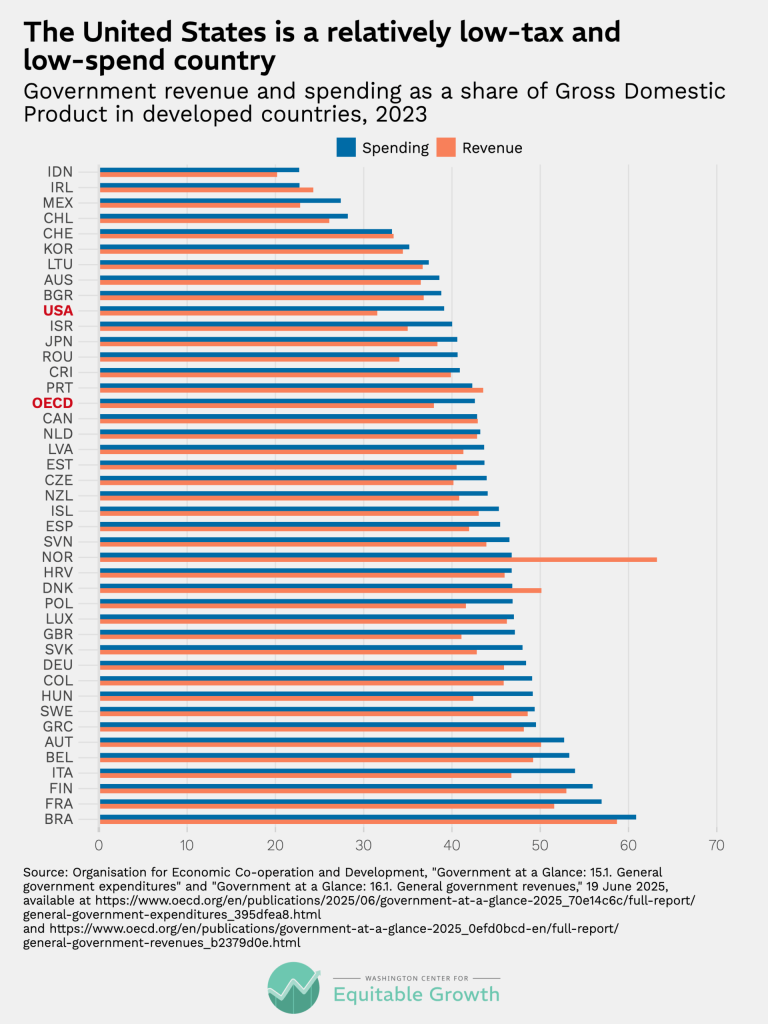
The United States is a relatively low-tax and low-spend country (opens in a new tab)
Visualizations MAY 6, 2026
 View Chart
(opens in a new tab)
View Chart
(opens in a new tab)
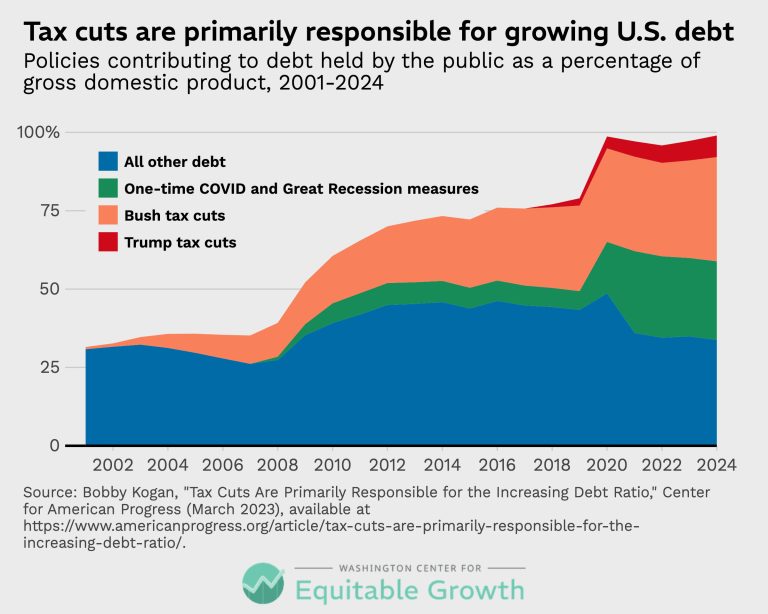
Tax cuts are primarily responsible for the growing U.S. debt (opens in a new tab)
Visualizations MAY 6, 2026
 View Chart
(opens in a new tab)
View Chart
(opens in a new tab)
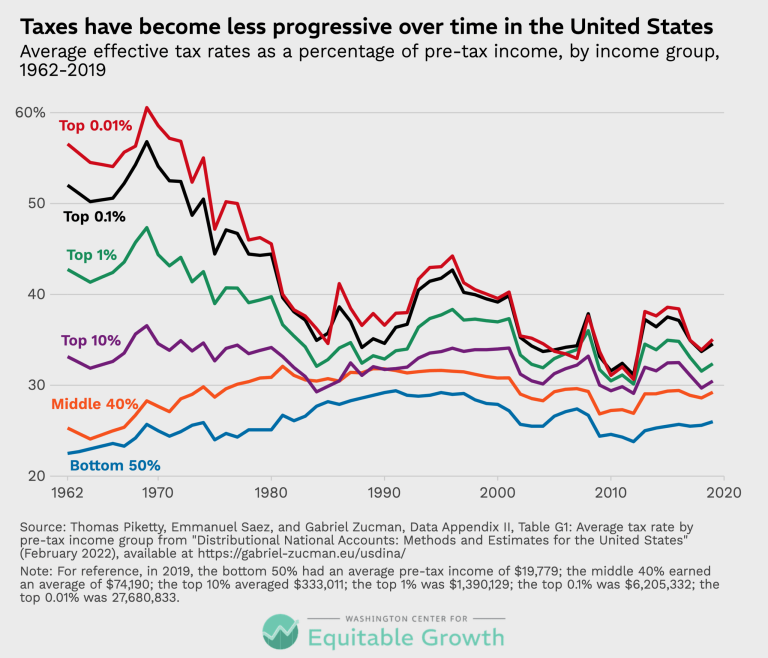
Taxes have become less progressive over time in the United States (opens in a new tab)
Visualizations MAY 6, 2026
 View Chart
(opens in a new tab)
View Chart
(opens in a new tab)
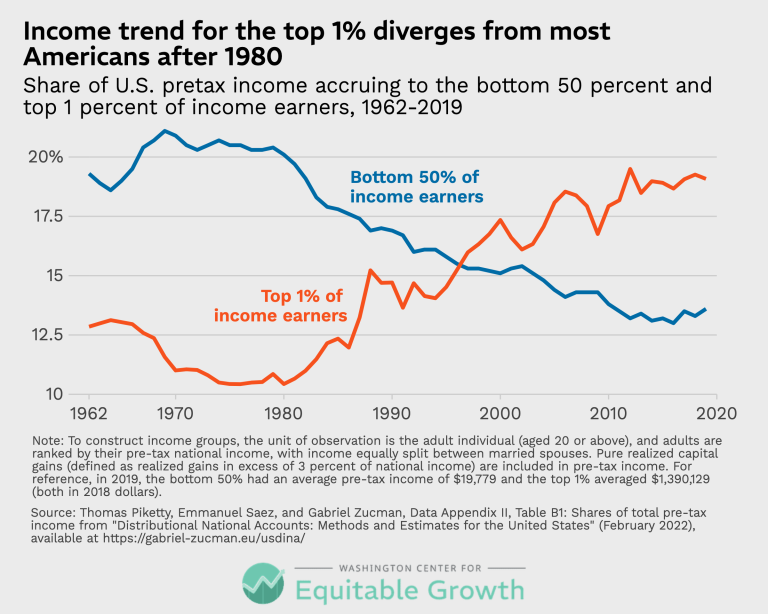
Income trend for the top 1% diverges from most Americans after 1980 (opens in a new tab)
Visualizations MAY 6, 2026
 View Chart
(opens in a new tab)
View Chart
(opens in a new tab)
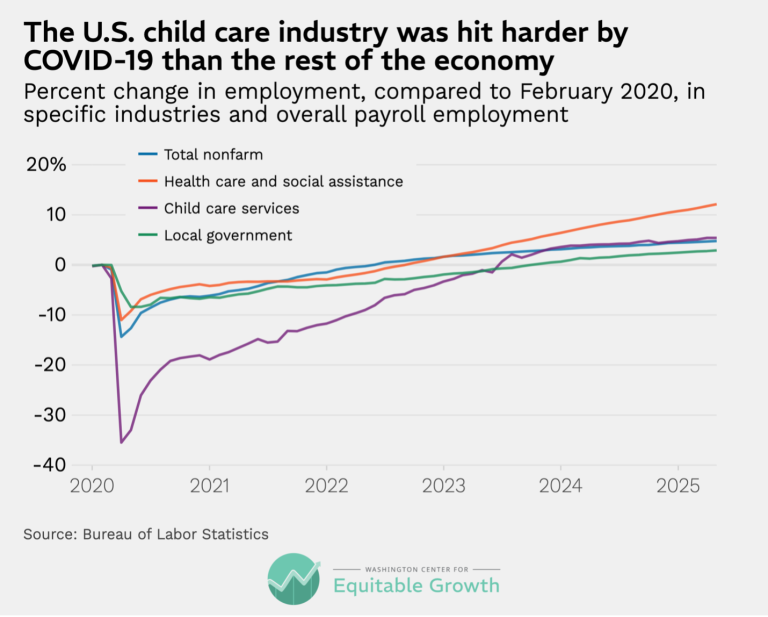
The U.S. child care industry was hit harder by COVID-19 than the rest of the economy (opens in a new tab)
Visualizations APR 15, 2026
 View Chart
(opens in a new tab)
View Chart
(opens in a new tab)
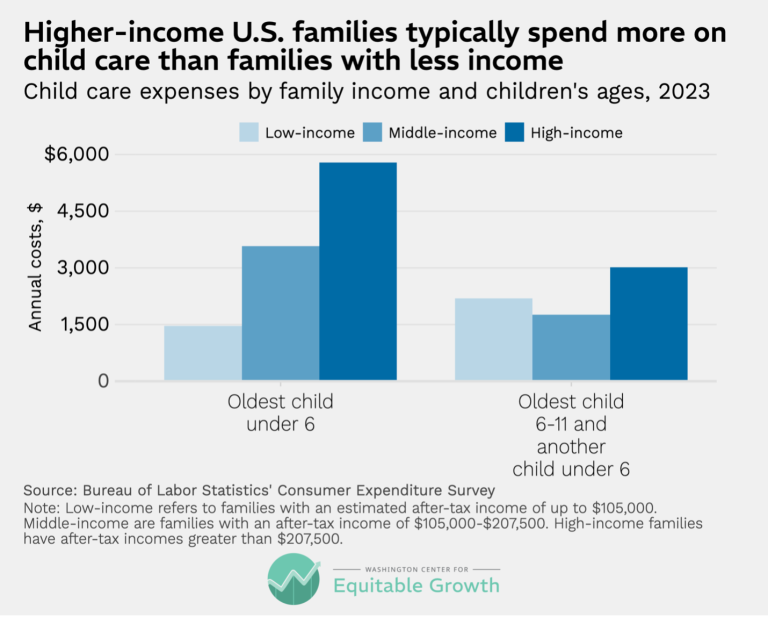
Higher-income U.S. families typically spend more on child care than families with less income (opens in a new tab)
Visualizations APR 15, 2026
 View Chart
(opens in a new tab)
View Chart
(opens in a new tab)
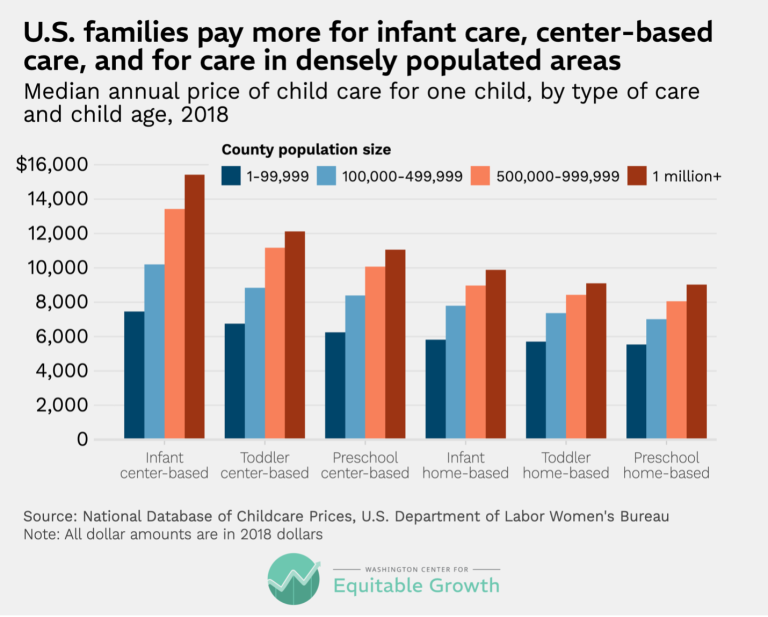
U.S. families pay more for infant care, center-based care, and for care in densely populated areas (opens in a new tab)
Visualizations APR 15, 2026
 View Chart
(opens in a new tab)
View Chart
(opens in a new tab)
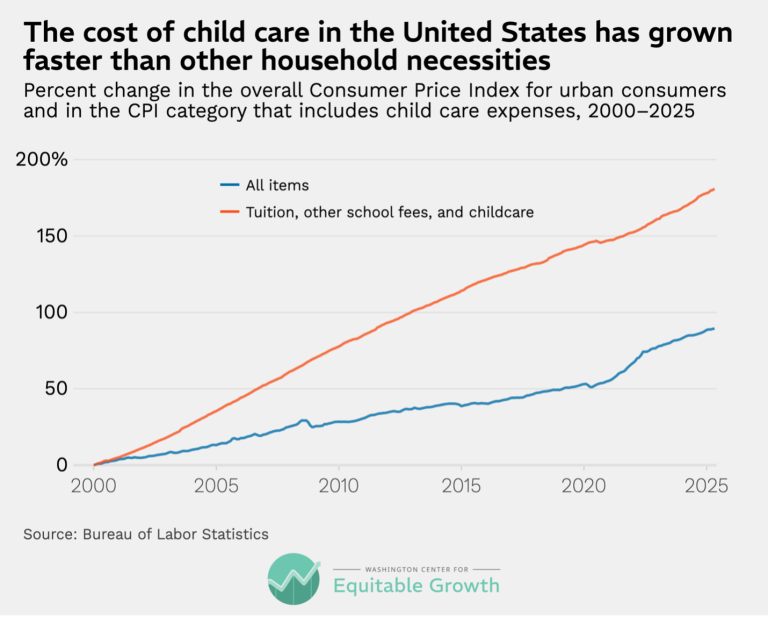
The cost of child care in the United States has grown faster than other household necessities (opens in a new tab)
Visualizations APR 15, 2026
 View Chart
(opens in a new tab)
View Chart
(opens in a new tab)
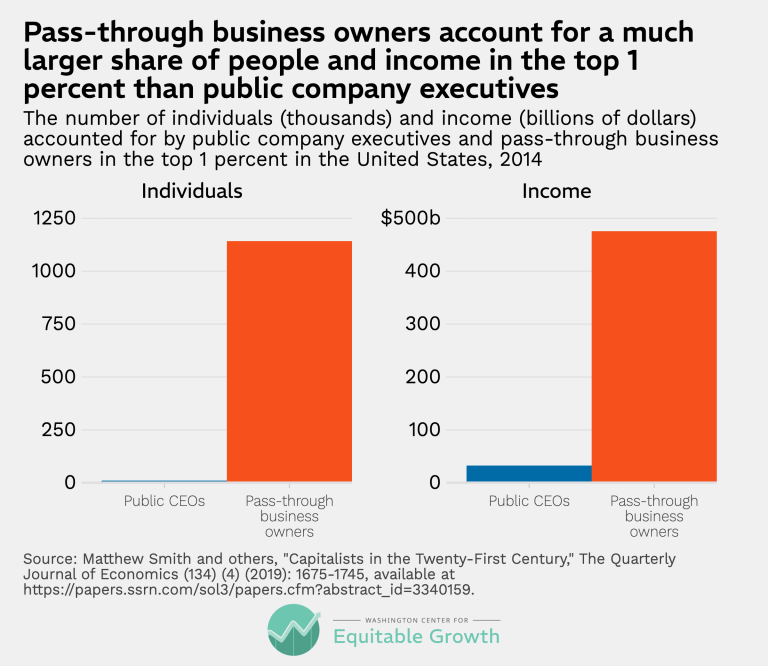
Pass-through business owners account for a much larger share of people and income in the top 1 percent than public company executives (opens in a new tab)
Visualizations APR 14, 2026
 View Chart
(opens in a new tab)
View Chart
(opens in a new tab)
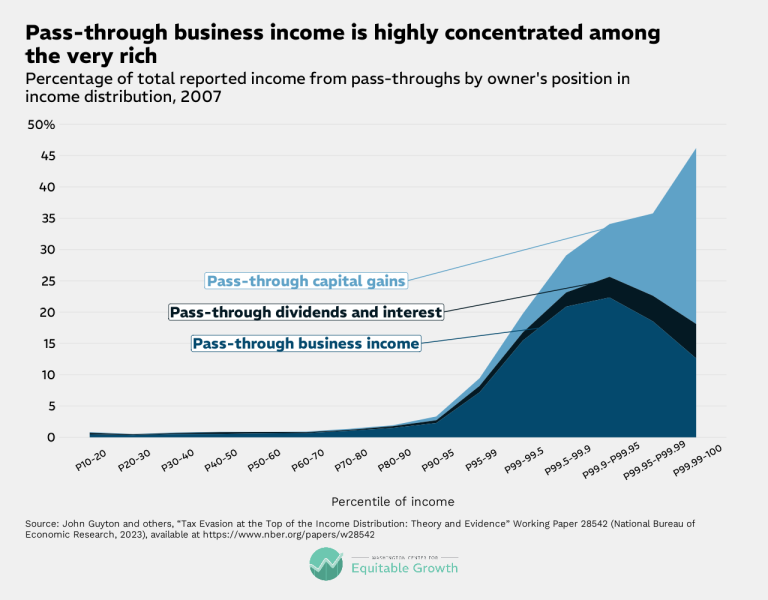
Pass-through business income is highly concentrated among the very rich (opens in a new tab)
Visualizations APR 14, 2026
 View Chart
(opens in a new tab)
View Chart
(opens in a new tab)
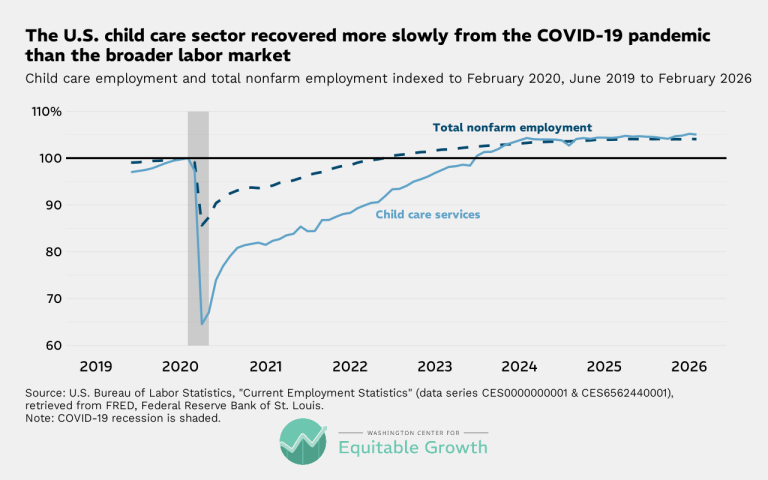
The U.S. child care sector recovered more slowly from the COVID-19 pandemic than the broader labor market (opens in a new tab)
Visualizations APR 8, 2026
 View Chart
(opens in a new tab)
View Chart
(opens in a new tab)
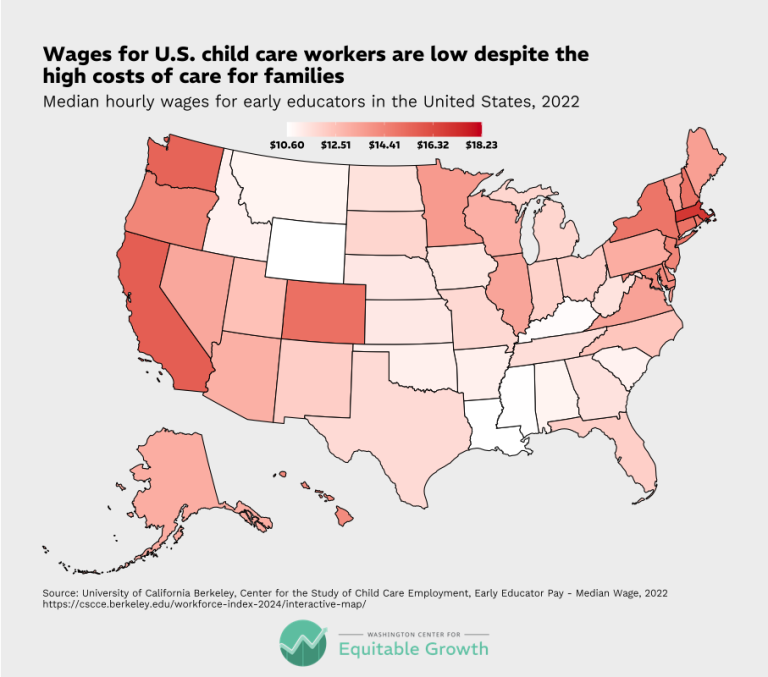
Wages for U.S. child care workers are low despite the high costs of care for families (opens in a new tab)
Visualizations APR 8, 2026
 View Chart
(opens in a new tab)
View Chart
(opens in a new tab)
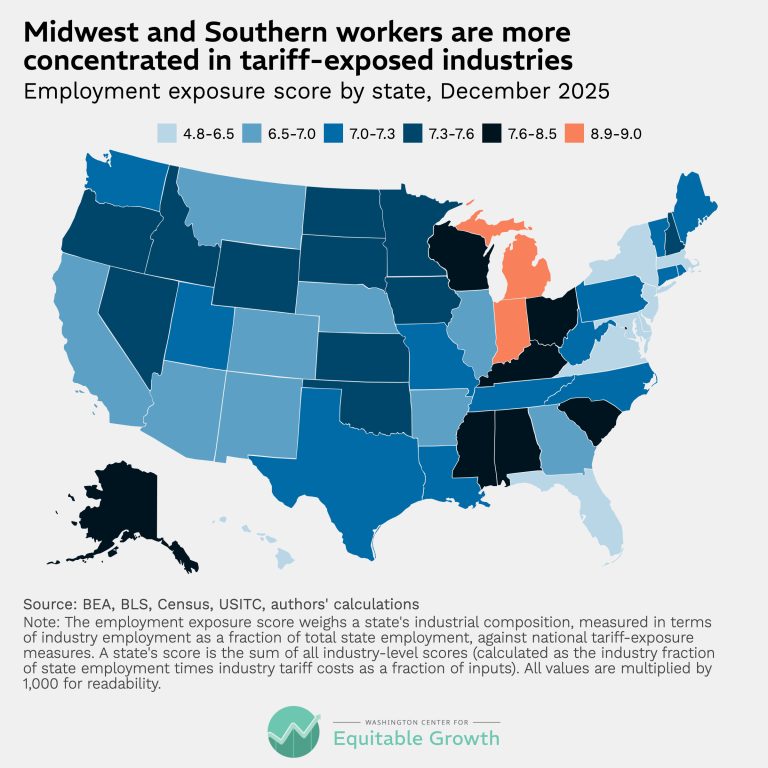
Midwest and Southern workers are more concentrated in tariff-exposed industries (opens in a new tab)
Visualizations MAR 17, 2026
 View Chart
(opens in a new tab)
View Chart
(opens in a new tab)
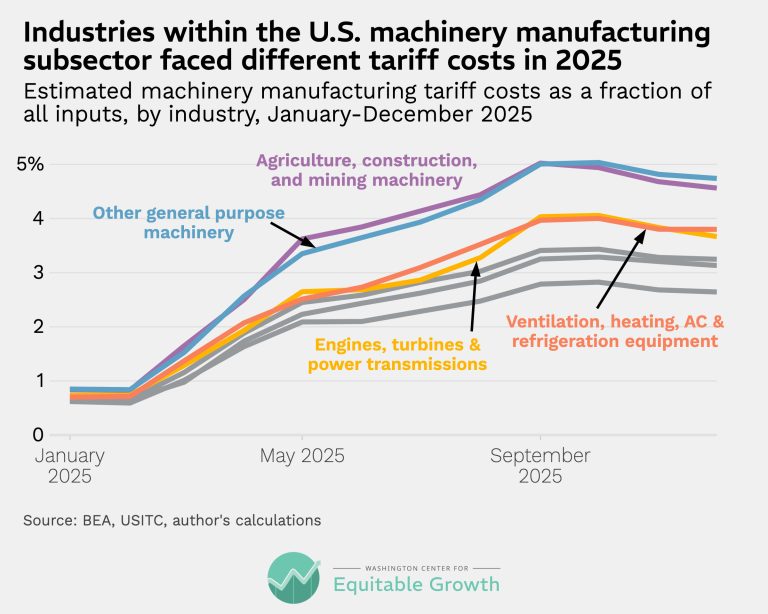
Industries within the U.S. machinery manufacturing subsector faced different tariff costs in 2025 (opens in a new tab)
Visualizations MAR 17, 2026
 View Chart
(opens in a new tab)
View Chart
(opens in a new tab)
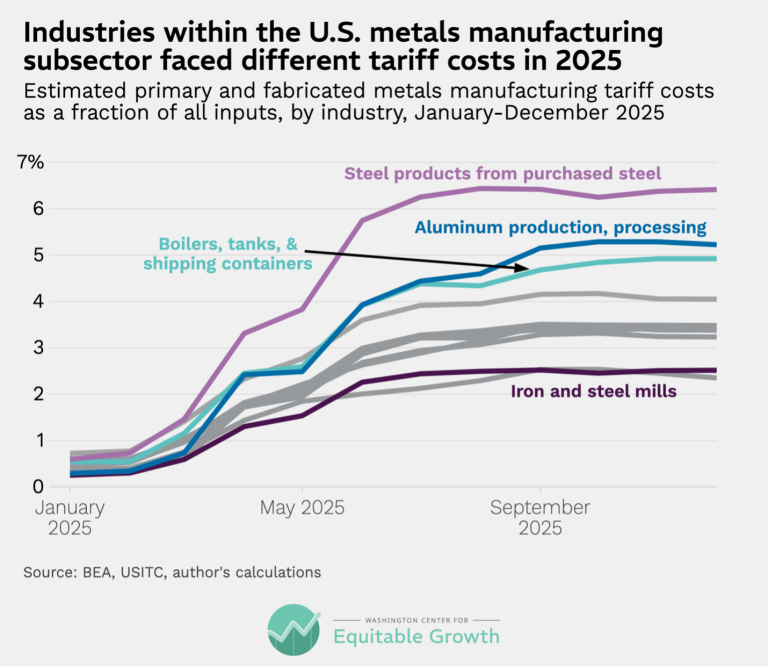
Industries within the U.S. metals manufacturing subsector faced different tariff costs in 2025 (opens in a new tab)
Visualizations MAR 17, 2026
 View Chart
(opens in a new tab)
View Chart
(opens in a new tab)
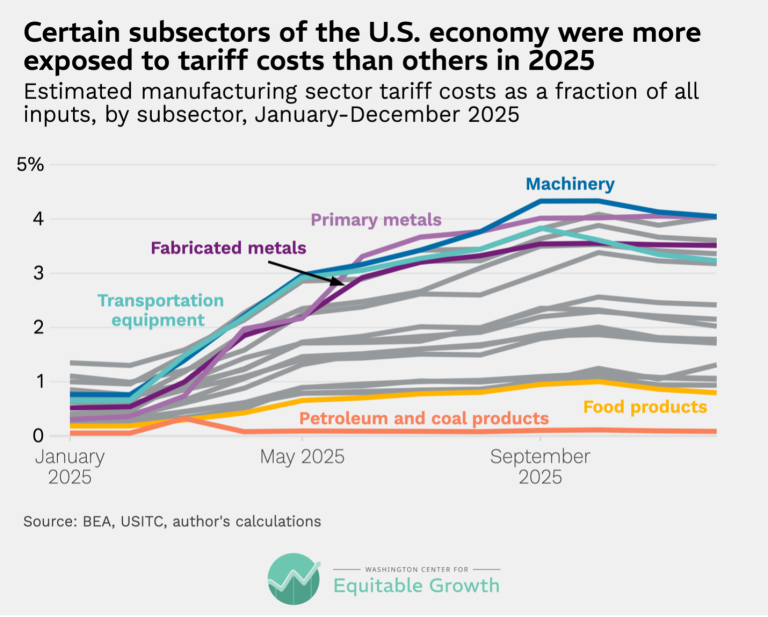
Certain subsectors of the U.S. economy were more exposed to tariff costs than others in 2025 (opens in a new tab)
Visualizations MAR 17, 2026
 View Chart
(opens in a new tab)
View Chart
(opens in a new tab)
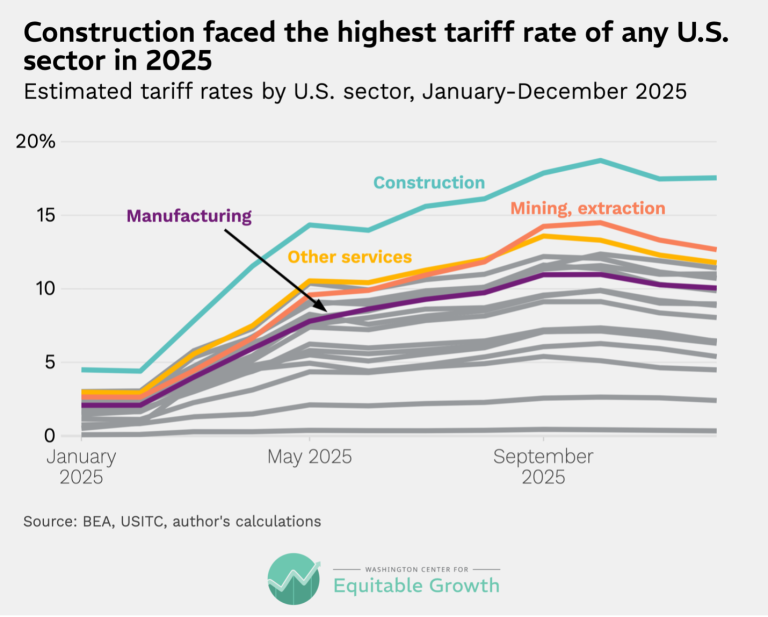
Construction faced the highest tariff rate of any U.S. sector in 2025 (opens in a new tab)
Visualizations MAR 17, 2026
 View Chart
(opens in a new tab)
View Chart
(opens in a new tab)
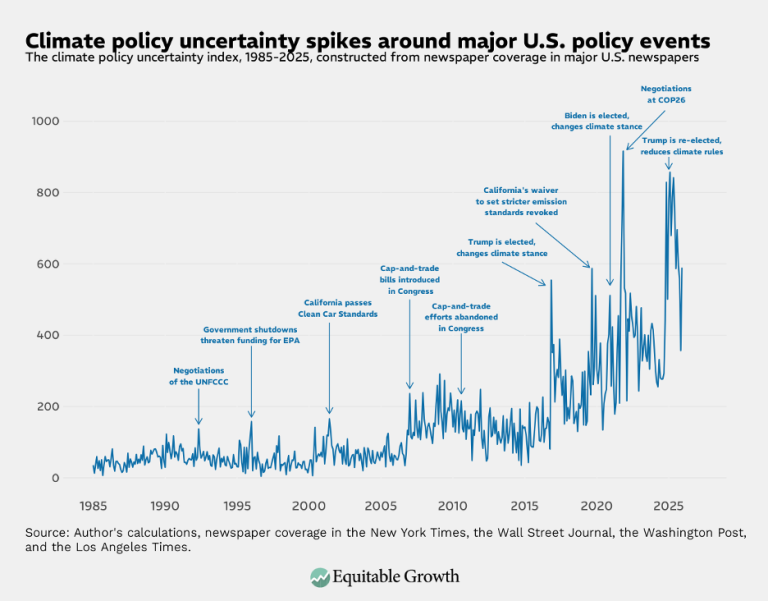
Climate policy uncertainty spikes around major U.S. policy events (opens in a new tab)
Visualizations MAR 17, 2026
 View Chart
(opens in a new tab)
View Chart
(opens in a new tab)
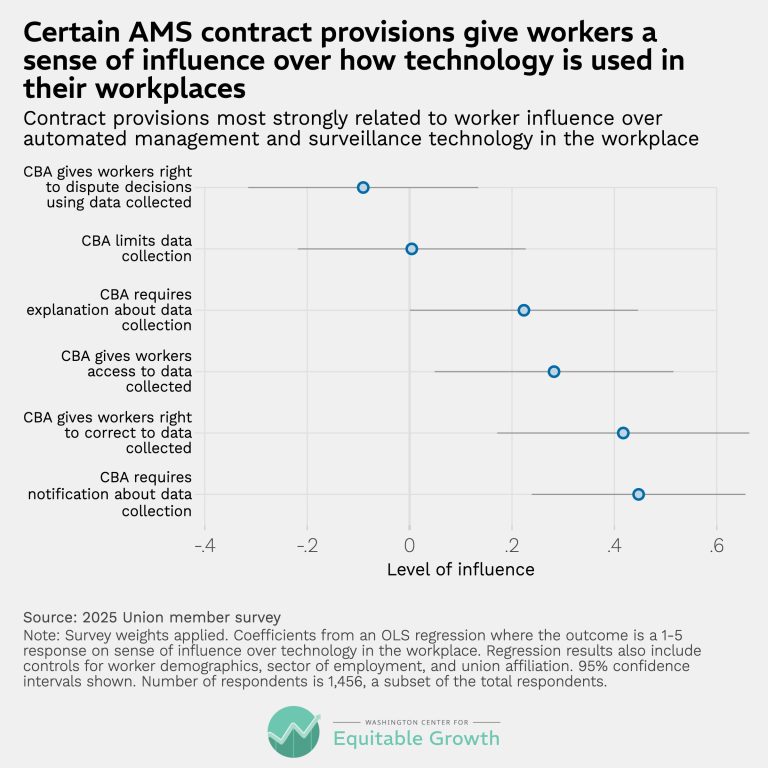
Certain AMS contract provisions give workers a sense of influence over how technology is used in their workplaces (opens in a new tab)
Visualizations MAR 12, 2026
 View Chart
(opens in a new tab)
View Chart
(opens in a new tab)
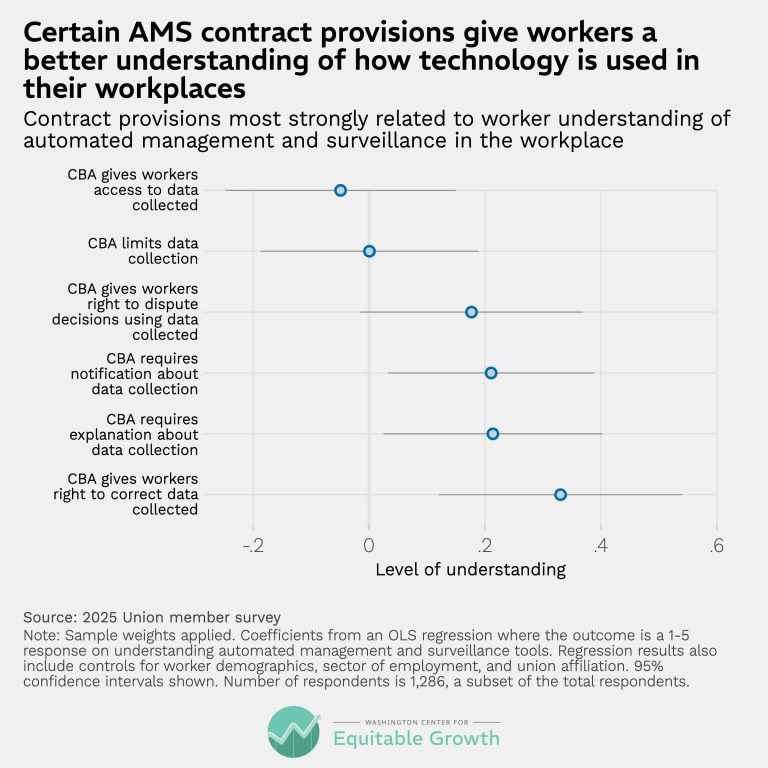
Certain AMS contract provisions give workers a better understanding of how technology is used in their workplaces (opens in a new tab)
Visualizations MAR 12, 2026
 View Chart
(opens in a new tab)
View Chart
(opens in a new tab)
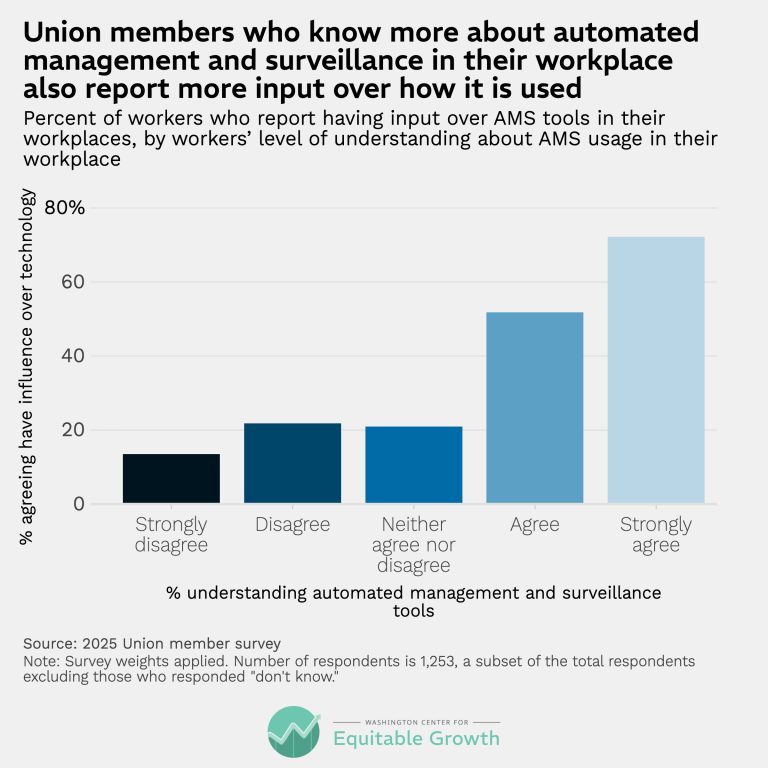
Union members who know more about automated management and surveillance in their workplace also report more input over how it is used (opens in a new tab)
Visualizations MAR 12, 2026
 View Chart
(opens in a new tab)
View Chart
(opens in a new tab)
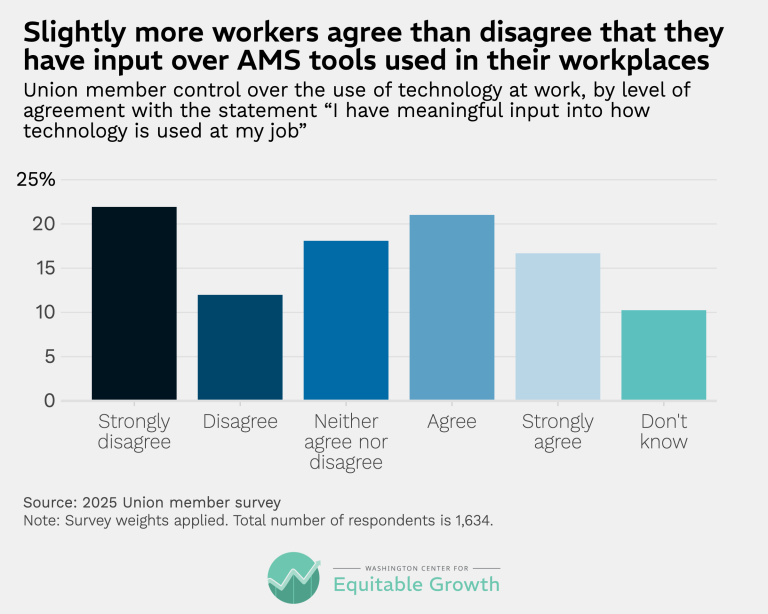
Slightly more workers agree than disagree that they have input over AMS tools used in their workplaces (opens in a new tab)
Visualizations MAR 12, 2026
 View Chart
(opens in a new tab)
View Chart
(opens in a new tab)
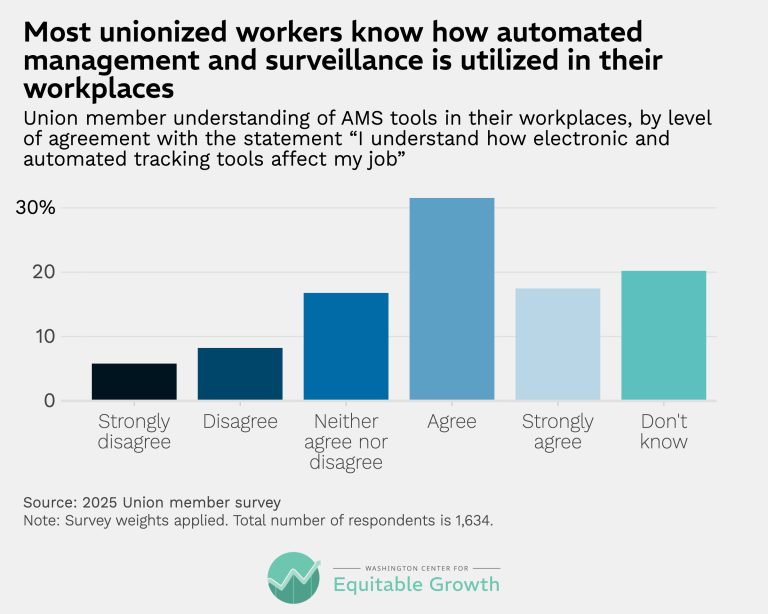
Most unionized workers know how automated management and surveillance are utilized in their workplaces (opens in a new tab)
Visualizations MAR 12, 2026
 View Chart
(opens in a new tab)
View Chart
(opens in a new tab)
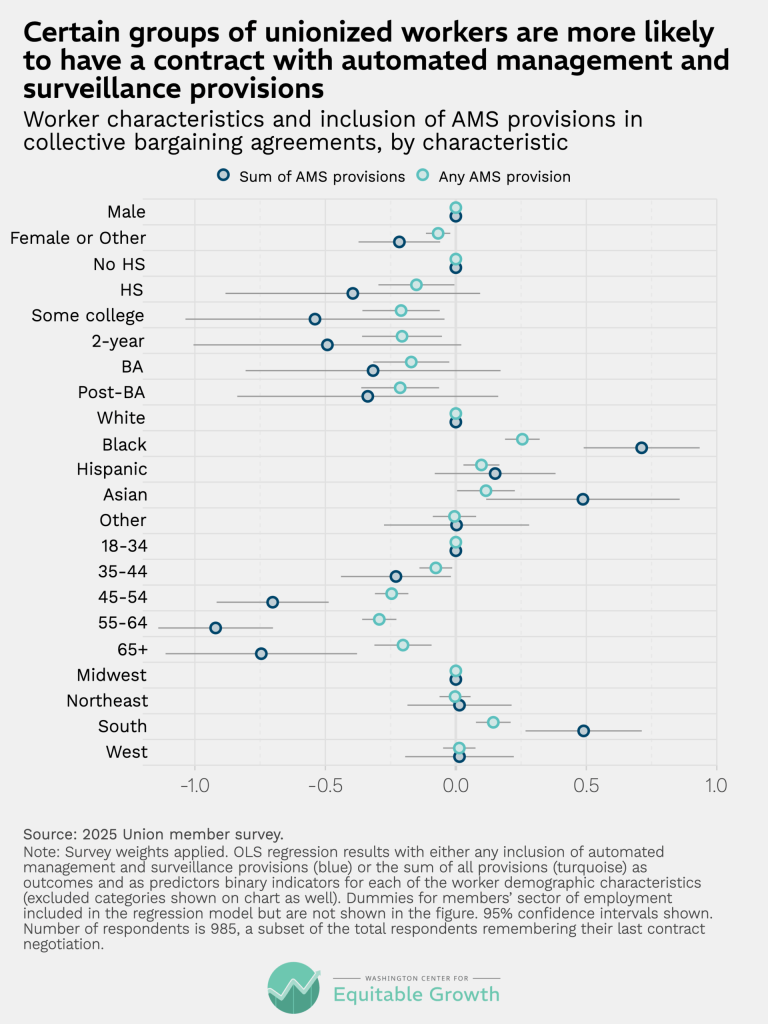
Certain groups of unionized workers are more likely to have a contract with automated management and surveillance provisions (opens in a new tab)
Visualizations MAR 12, 2026
 View Chart
(opens in a new tab)
View Chart
(opens in a new tab)
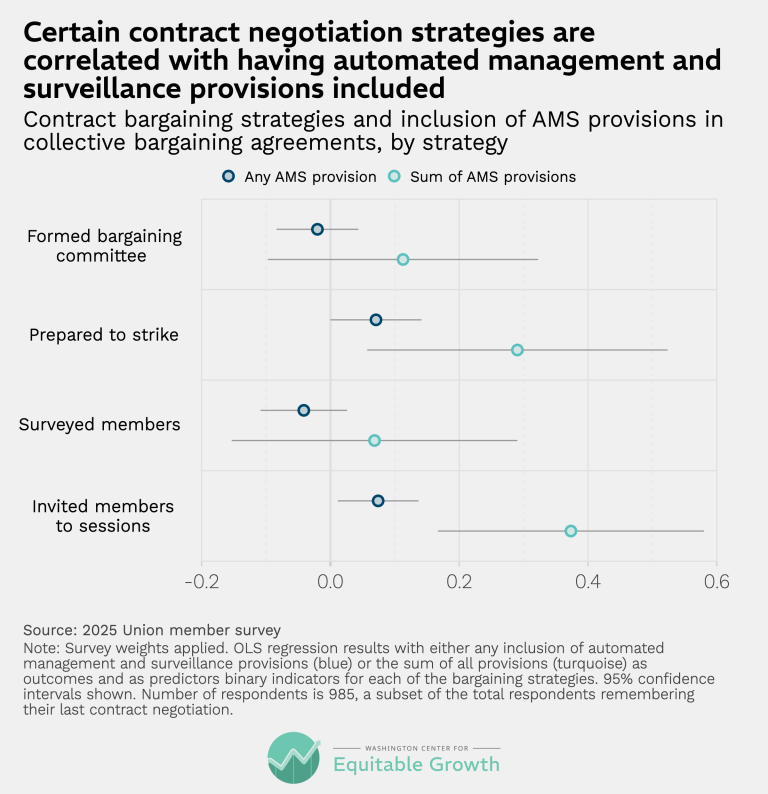
Certain contract negotiation strategies are correlated having automated management and surveillance provisions included (opens in a new tab)
Visualizations MAR 12, 2026
 View Chart
(opens in a new tab)
View Chart
(opens in a new tab)
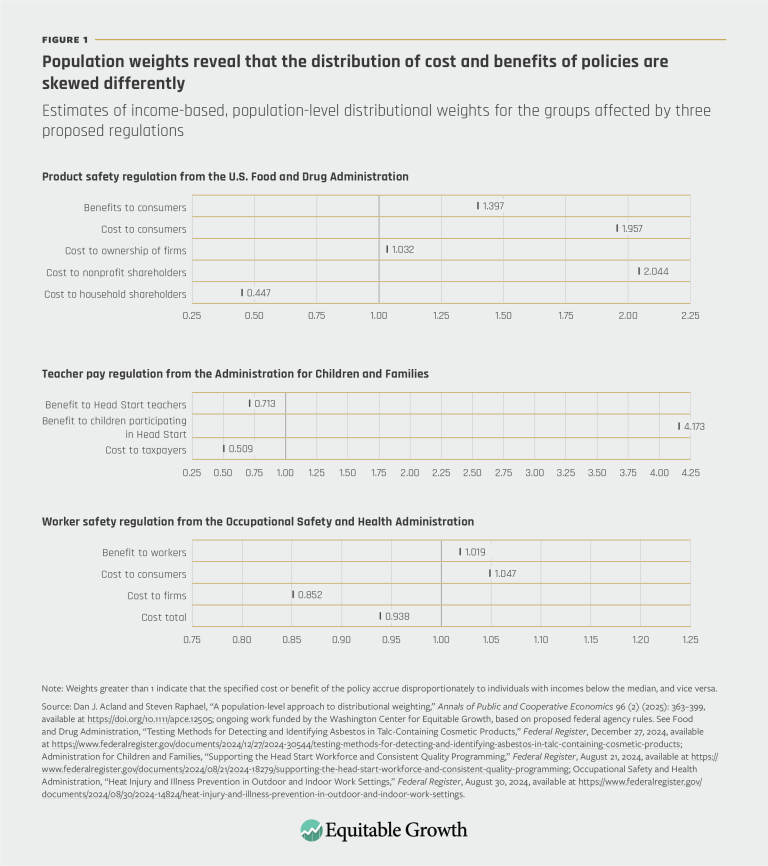
Population weights reveal that the distribution of cost and benefits of policies are skewed differently (opens in a new tab)
Visualizations NOV 13, 2025
 View Chart
(opens in a new tab)
View Chart
(opens in a new tab)
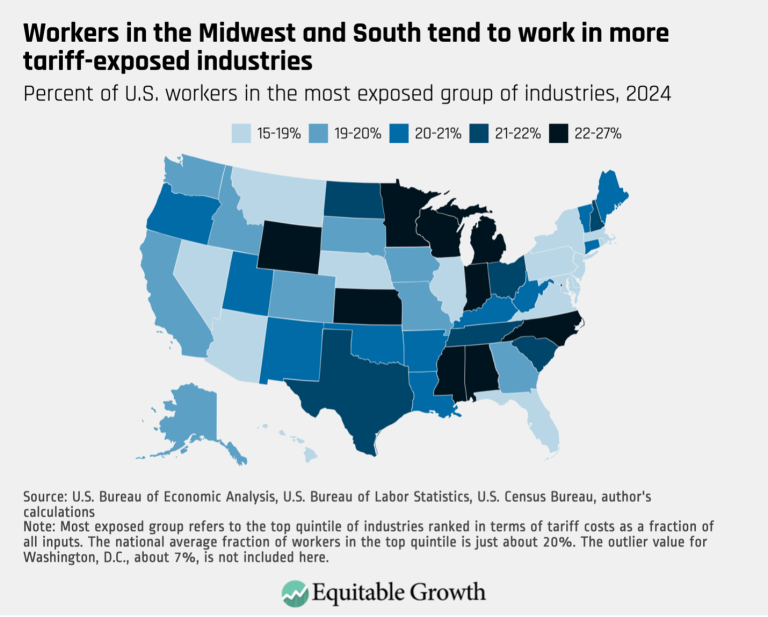
Workers in the Midwest and South tend to work in more tariff-exposed industries (opens in a new tab)
Visualizations NOV 3, 2025
 View Chart
(opens in a new tab)
View Chart
(opens in a new tab)
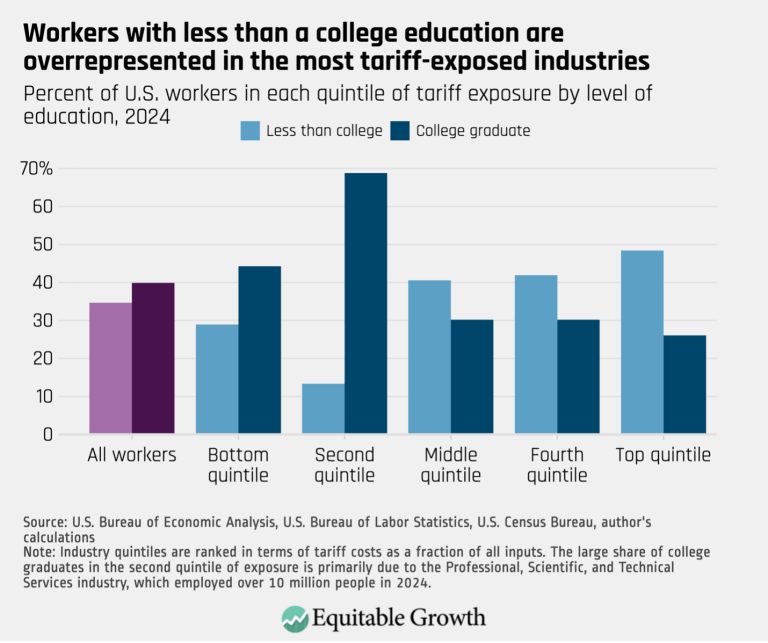
Workers with less than a college education are overrepresented in the most tariff-exposed industries (opens in a new tab)
Visualizations NOV 3, 2025
 View Chart
(opens in a new tab)
View Chart
(opens in a new tab)
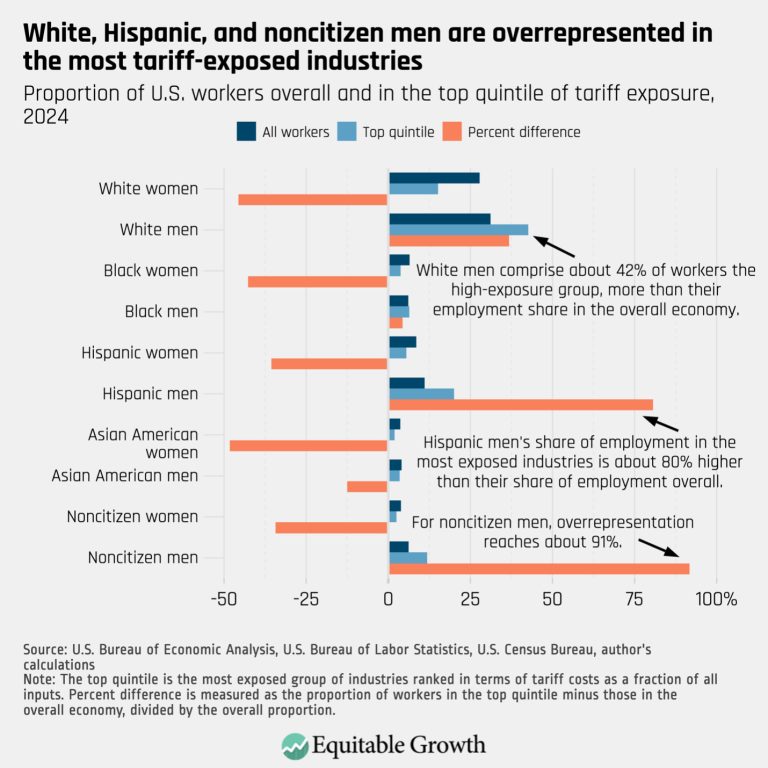
White, Hispanic, and noncitizen men are overrepresented in the most tariff-exposed industries (opens in a new tab)
Visualizations NOV 3, 2025
 View Chart
(opens in a new tab)
View Chart
(opens in a new tab)
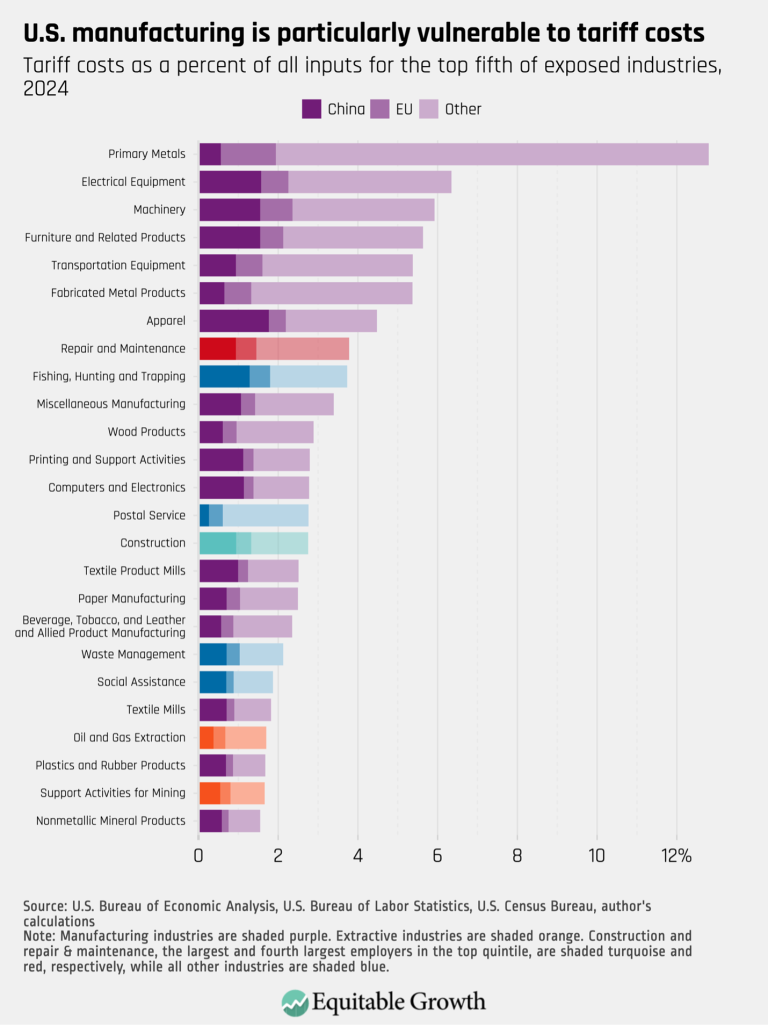
U.S. manufacturing is particularly vulnerable to tariff costs (opens in a new tab)
Visualizations NOV 3, 2025
 View Chart
(opens in a new tab)
View Chart
(opens in a new tab)
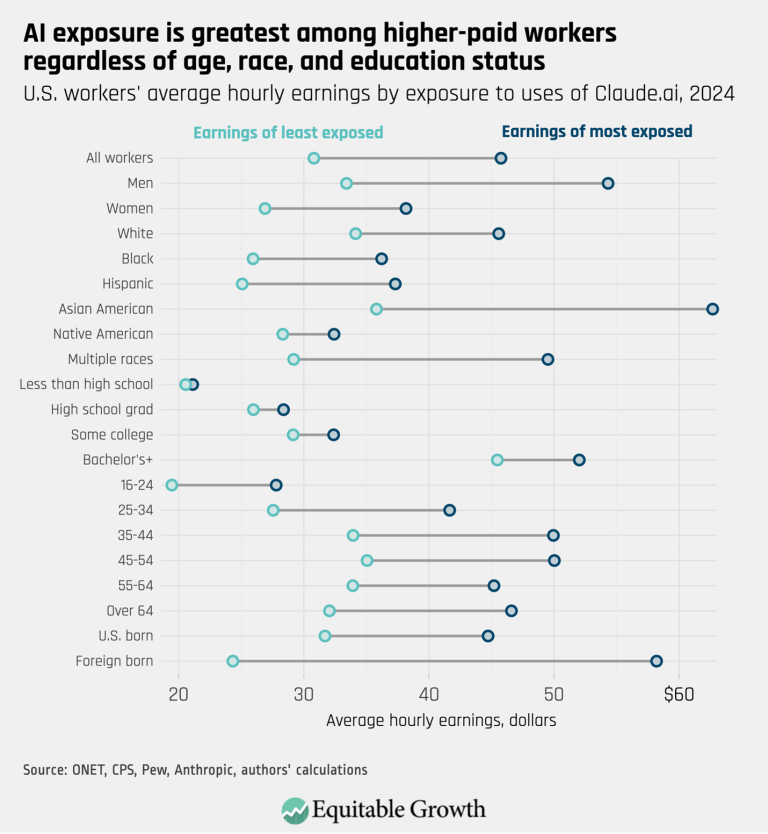
AI exposure is greatest among higher-paid workers regardless of age, race and education status (opens in a new tab)
Visualizations OCT 22, 2025
 View Chart
(opens in a new tab)
View Chart
(opens in a new tab)
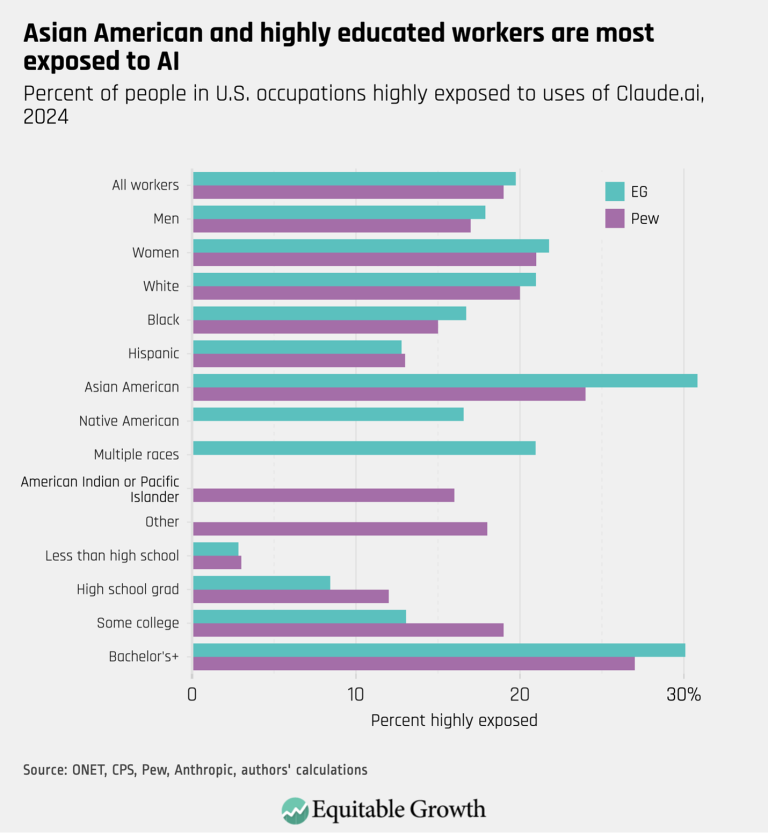
Asian American and highly educated workers are most exposed to AI (opens in a new tab)
Visualizations OCT 22, 2025
 View Chart
(opens in a new tab)
View Chart
(opens in a new tab)
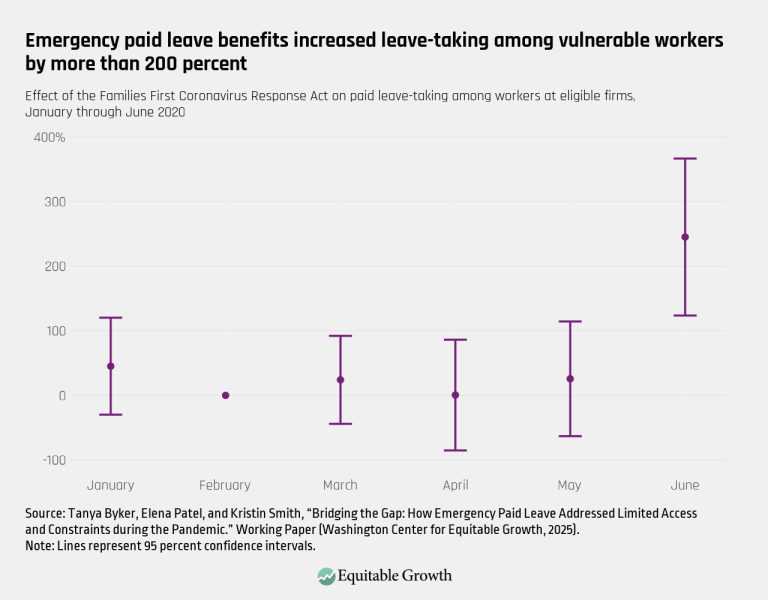
Emergency paid leave benefits increased leave-taking among vulnerable workers by more than 200 percent – Final (opens in a new tab)
Visualizations SEP 23, 2025
 View Chart
(opens in a new tab)
View Chart
(opens in a new tab)
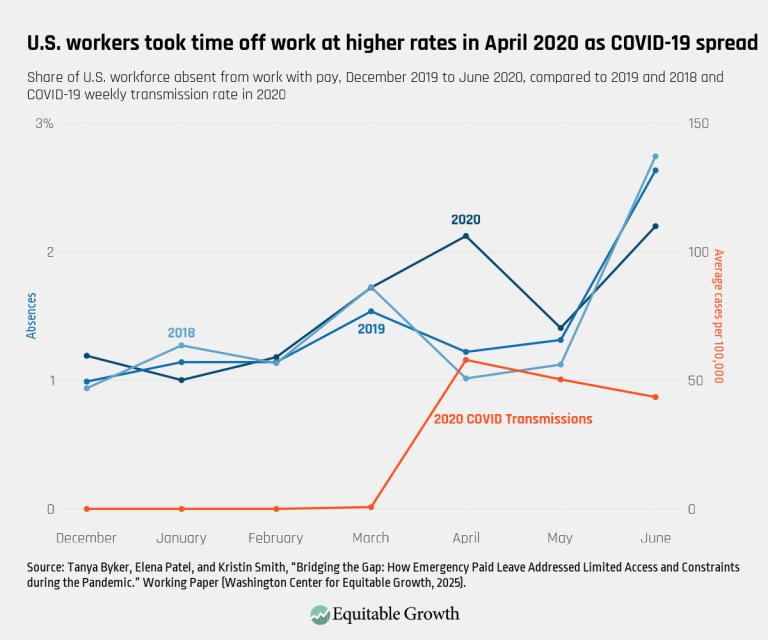
U.S. workers took time off work at higher rates in April 2020 as COVID-19 spread (opens in a new tab)
Visualizations SEP 23, 2025
 View Chart
(opens in a new tab)
View Chart
(opens in a new tab)
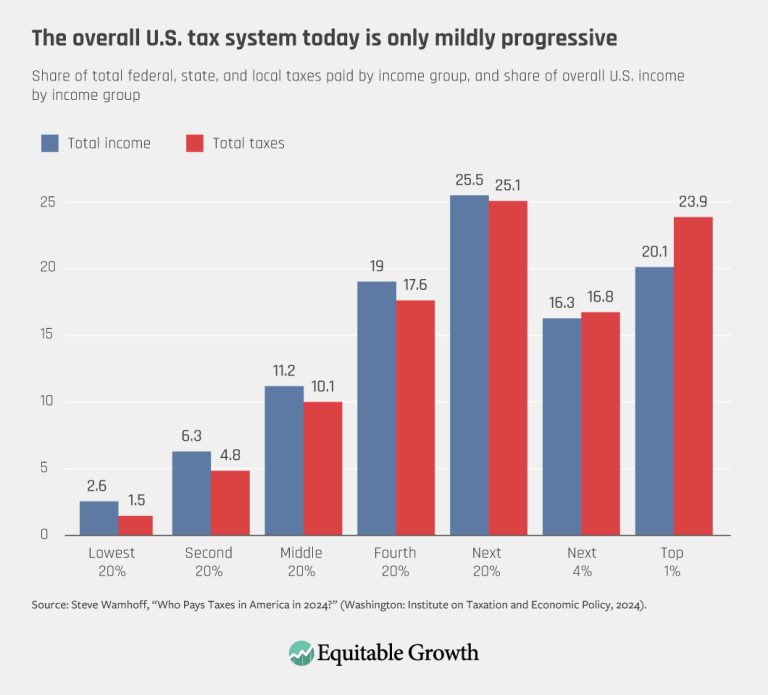
The overall U.S. tax system today is only mildly progressive (opens in a new tab)
Visualizations SEP 10, 2025
 View Chart
(opens in a new tab)
View Chart
(opens in a new tab)
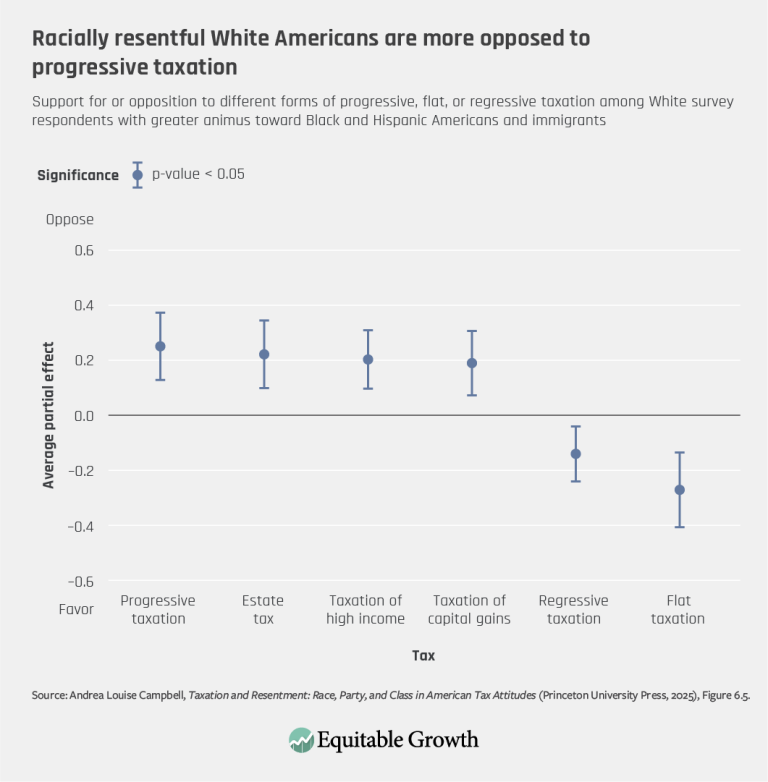
Racially resentful White Americans are more opposed to progressive taxation (opens in a new tab)
Visualizations SEP 9, 2025
 View Chart
(opens in a new tab)
View Chart
(opens in a new tab)
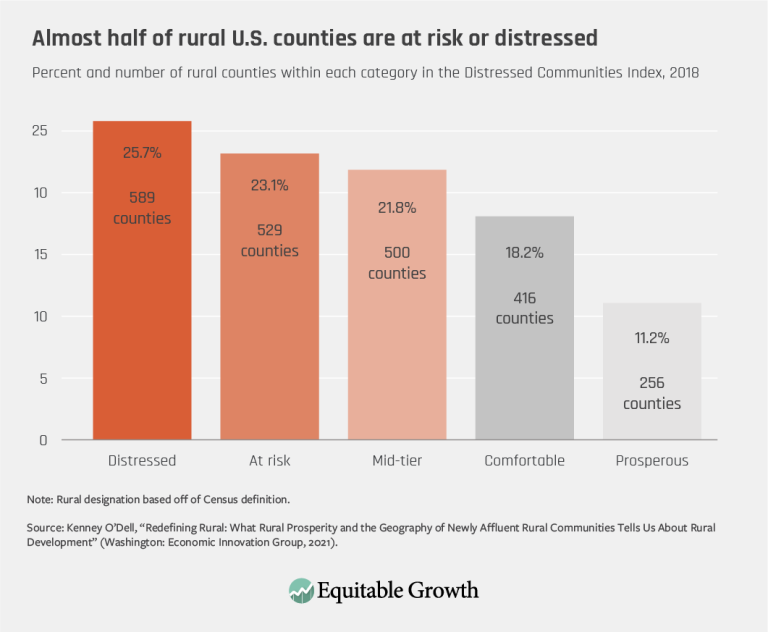
Almost half of rural U.S. counties are at risk or distressed (opens in a new tab)
Visualizations SEP 8, 2025
 View Chart
(opens in a new tab)
View Chart
(opens in a new tab)
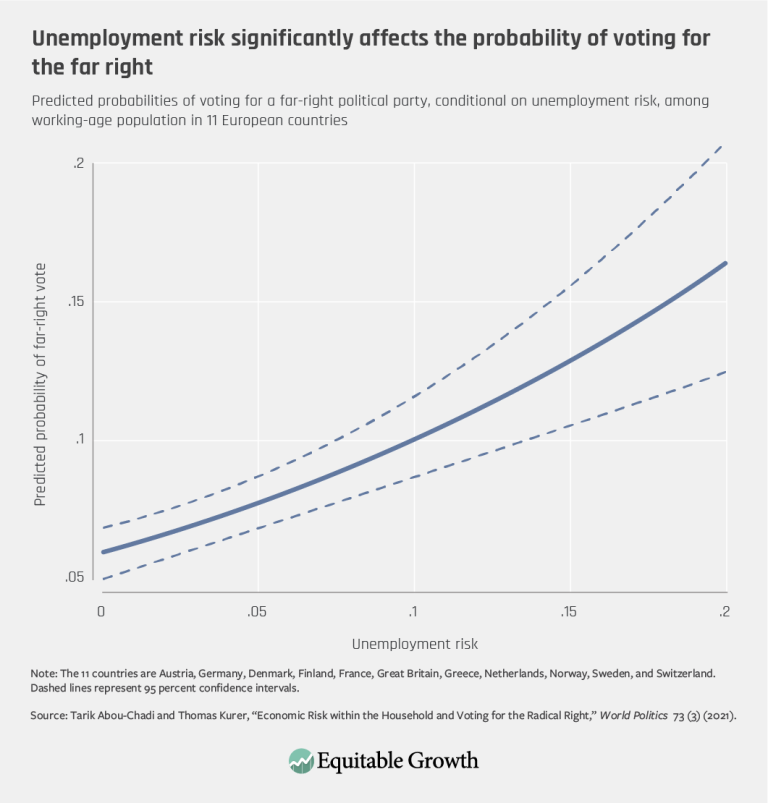
Unemployment risk significantly affects the probability of voting for the far right (opens in a new tab)
Visualizations SEP 5, 2025
 View Chart
(opens in a new tab)
View Chart
(opens in a new tab)
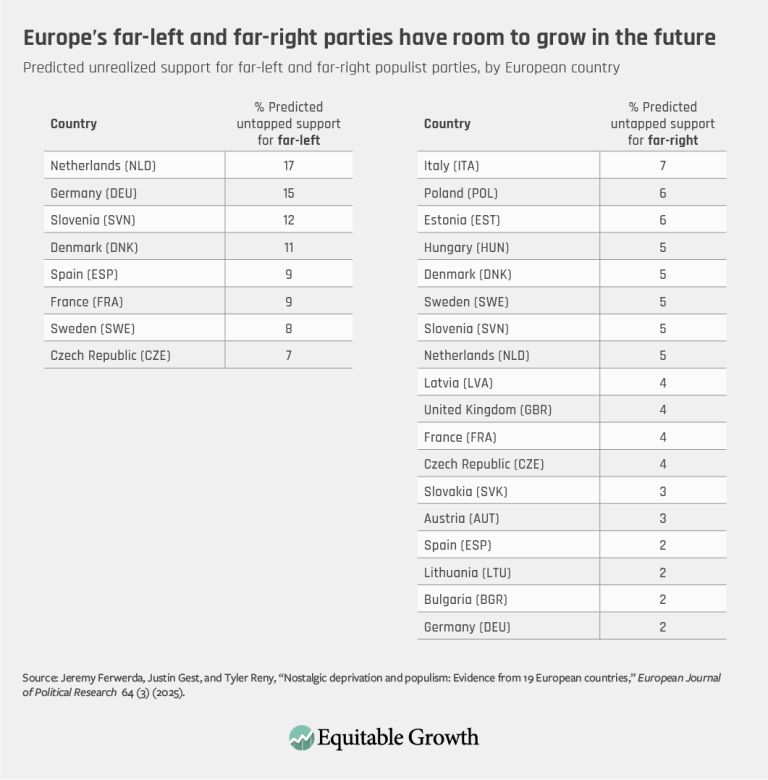
Europe’s far-left and far-right parties have room to grow in the future (opens in a new tab)
Visualizations SEP 4, 2025
 View Chart
(opens in a new tab)
View Chart
(opens in a new tab)
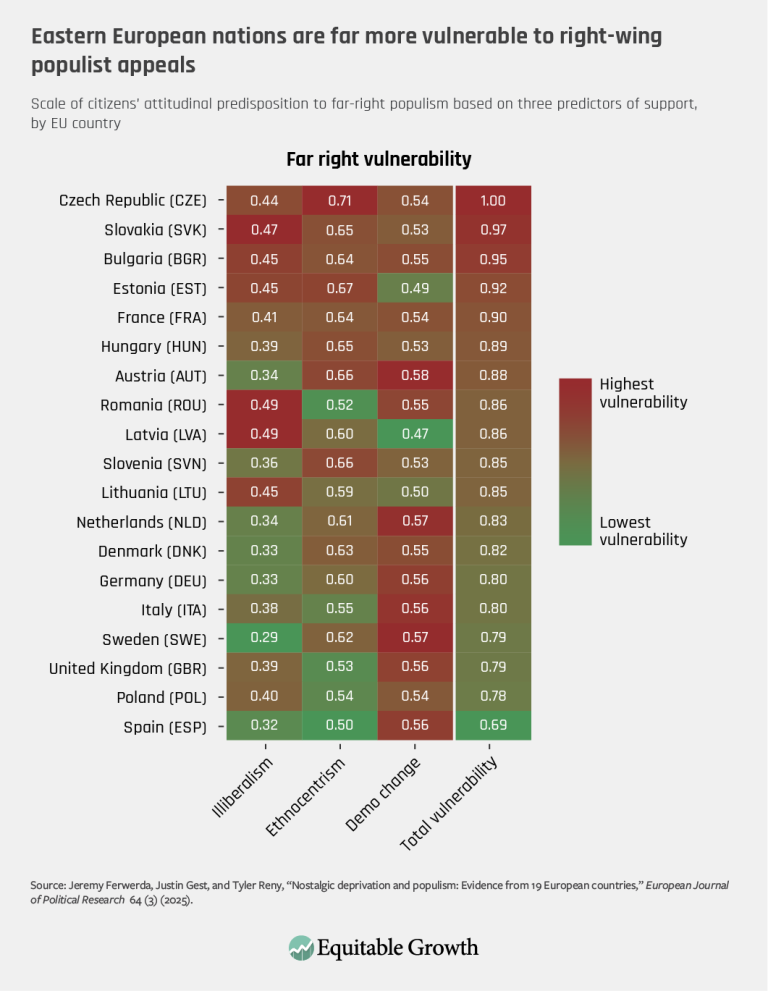
Eastern European nations are far more vulnerable to right-wing populist appeals (opens in a new tab)
Visualizations SEP 4, 2025
 View Chart
(opens in a new tab)
View Chart
(opens in a new tab)
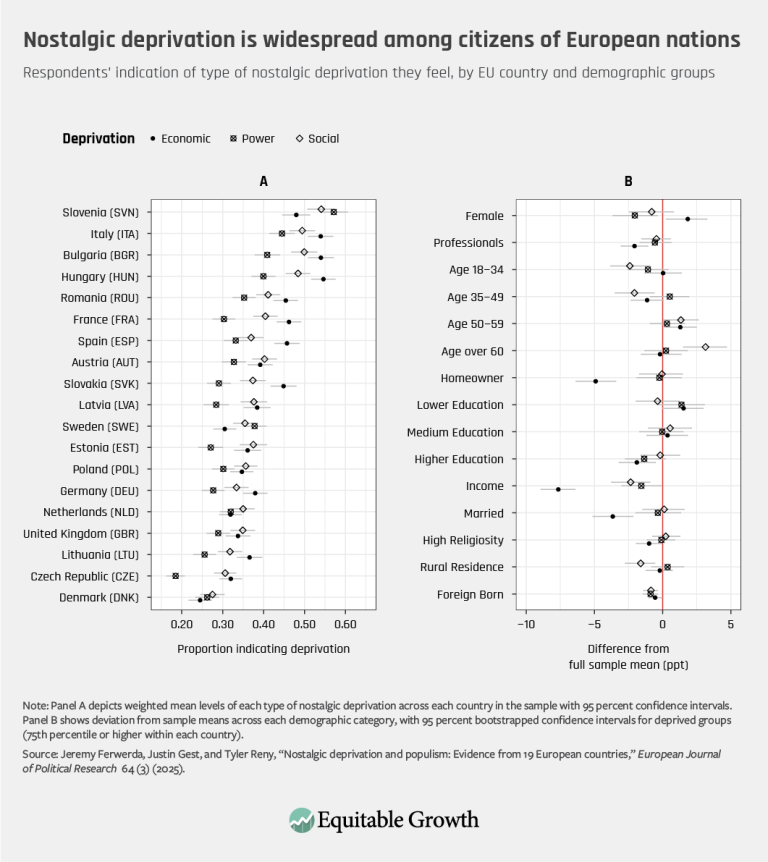
Nostalgic deprivation is widespread among citizens of European nations (opens in a new tab)
Visualizations SEP 4, 2025
 View Chart
(opens in a new tab)
View Chart
(opens in a new tab)
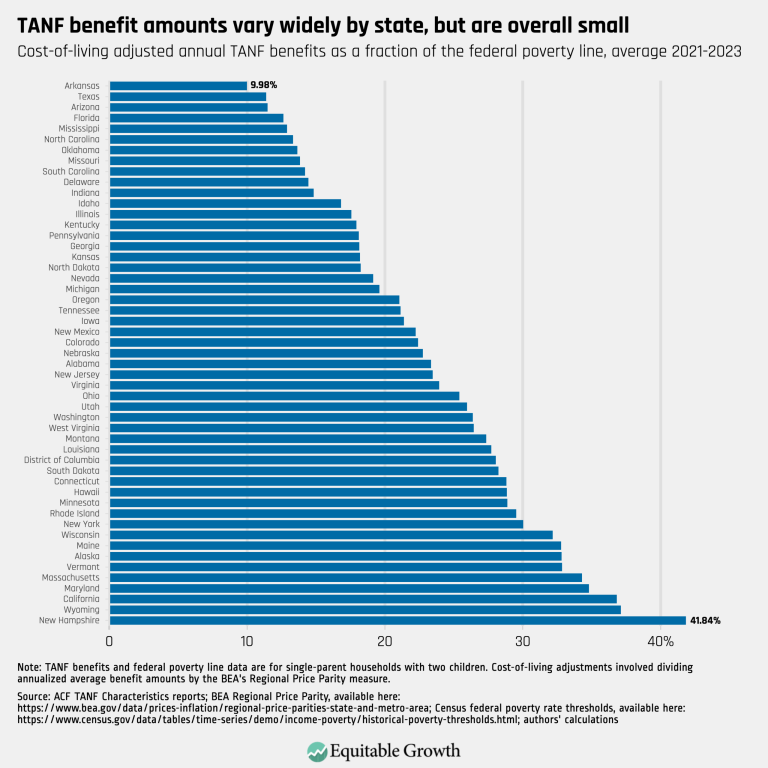
TANF benefit amounts vary widely by state, but are overall small – updated (opens in a new tab)
Visualizations AUG 26, 2025
 View Chart
(opens in a new tab)
View Chart
(opens in a new tab)
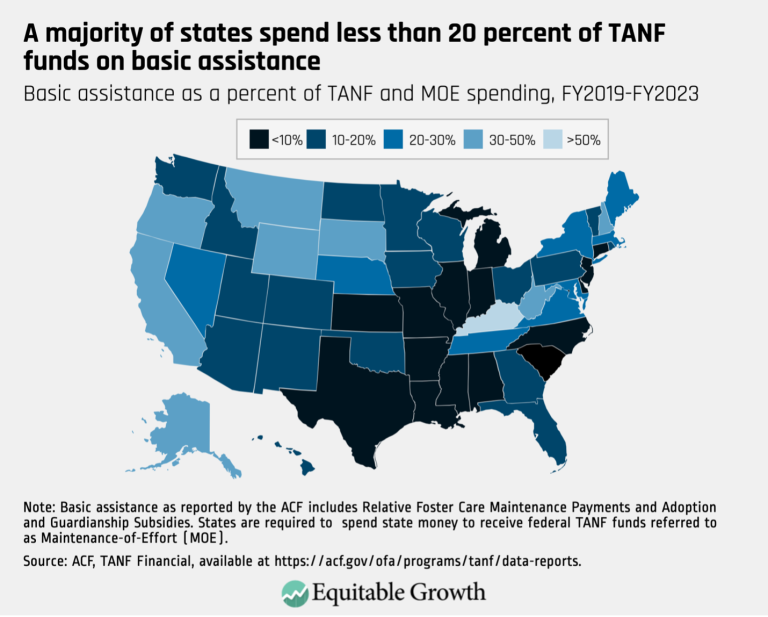
A majority of states spend less than 20 percent of TANF funds on basic assistance (opens in a new tab)
Visualizations AUG 26, 2025
 View Chart
(opens in a new tab)
View Chart
(opens in a new tab)
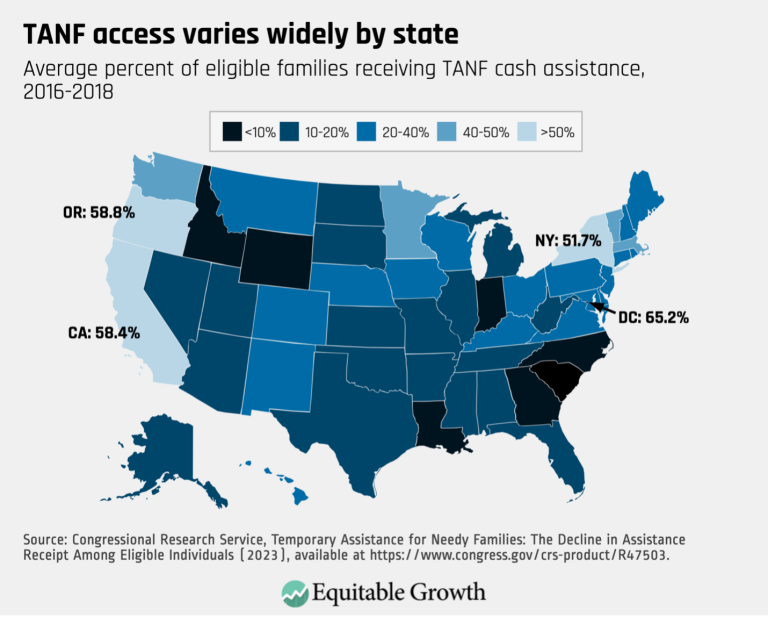
TANF access varies widely by state (opens in a new tab)
Visualizations AUG 26, 2025
 View Chart
(opens in a new tab)
View Chart
(opens in a new tab)
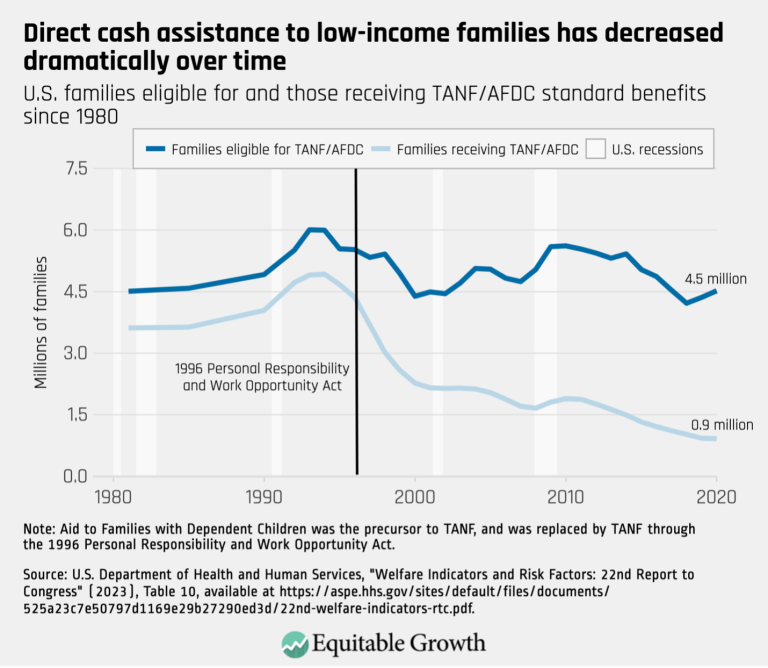
Direct cash assistance to low-income families has decreased dramatically over time (opens in a new tab)
Visualizations AUG 26, 2025
 View Chart
(opens in a new tab)
View Chart
(opens in a new tab)
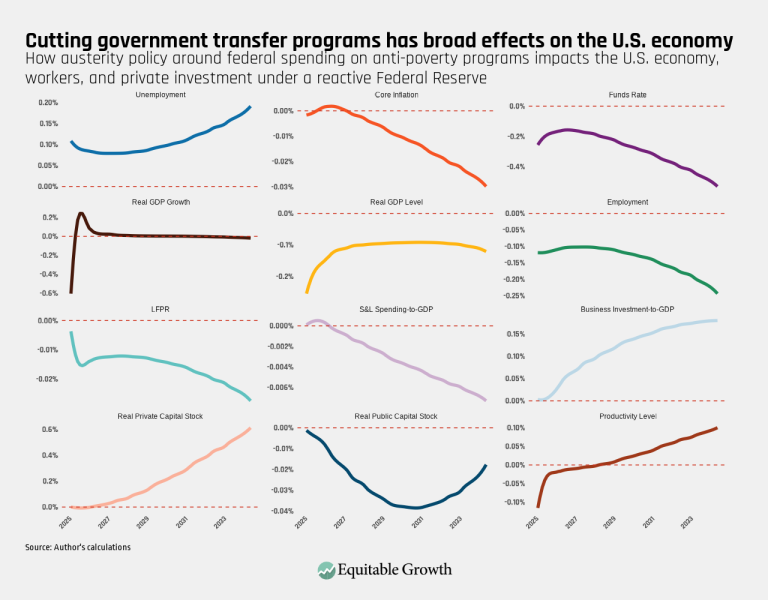
Cutting government transfer programs has broad effects on the U.S. economy (opens in a new tab)
Visualizations AUG 12, 2025
 View Chart
(opens in a new tab)
View Chart
(opens in a new tab)
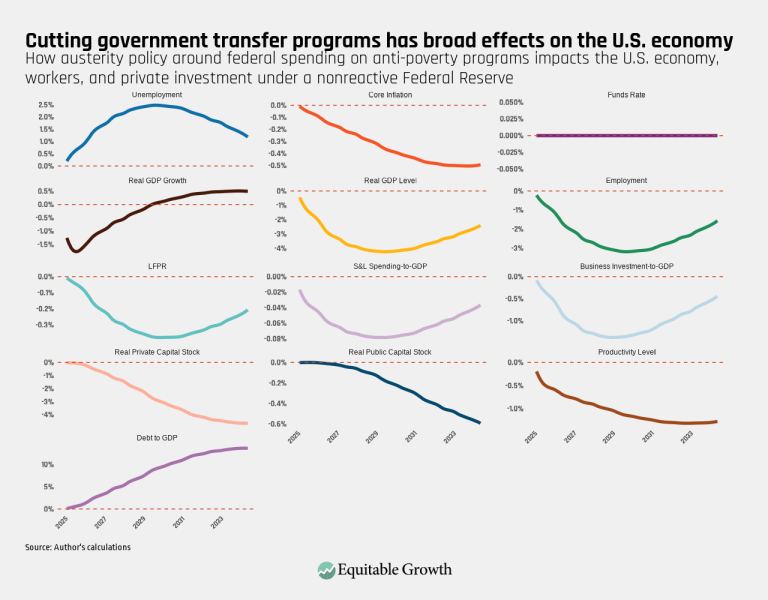
Cutting government transfer programs has broad effects on the U.S. economy (opens in a new tab)
Visualizations AUG 12, 2025
 View Chart
(opens in a new tab)
View Chart
(opens in a new tab)
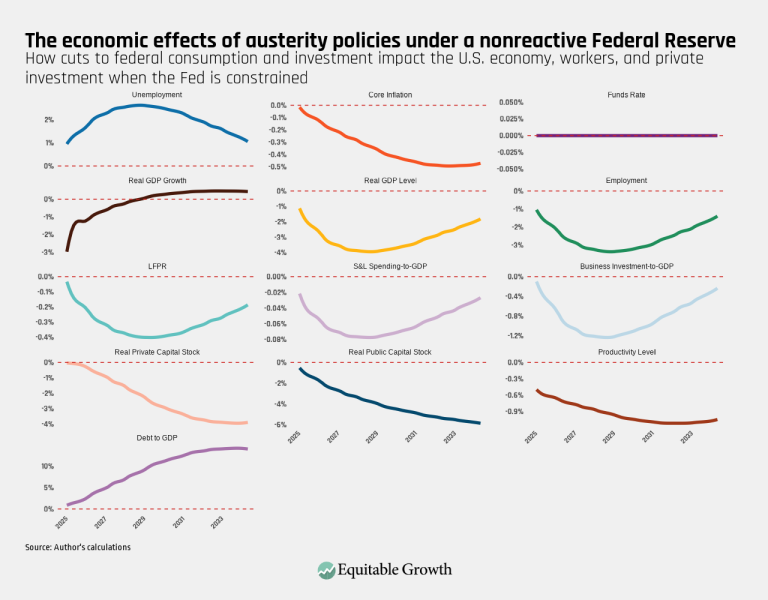
The economic effects of austerity policies under a nonreactive Federal Reserve – Final (opens in a new tab)
Visualizations AUG 12, 2025
 View Chart
(opens in a new tab)
View Chart
(opens in a new tab)
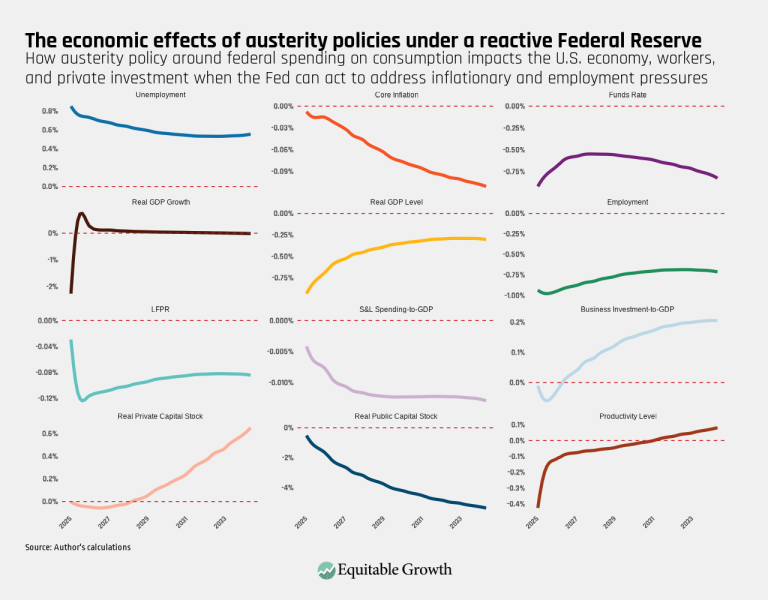
The economic effects of austerity policies under a reactive Federal Reserve (opens in a new tab)
Visualizations AUG 12, 2025
 View Chart
(opens in a new tab)
View Chart
(opens in a new tab)
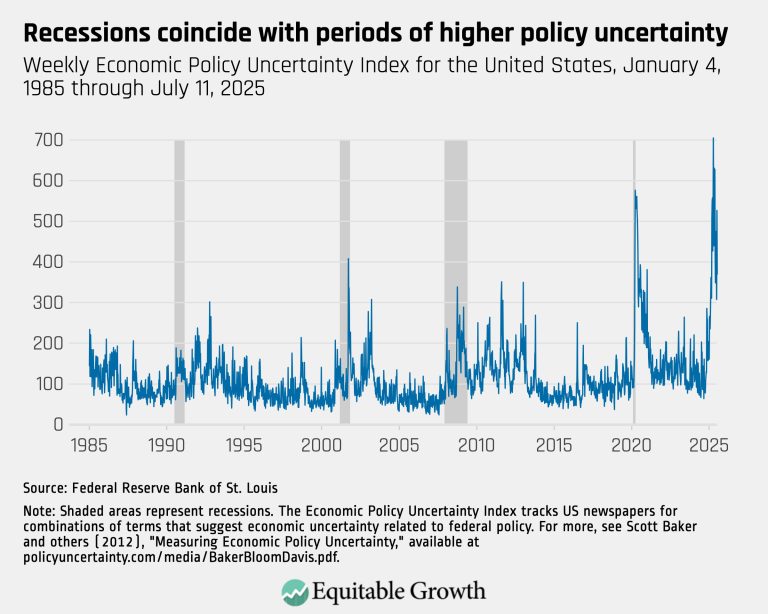
Recessions coincide with periods of higher policy uncertainty – updated (opens in a new tab)
Visualizations AUG 7, 2025
 View Chart
(opens in a new tab)
View Chart
(opens in a new tab)
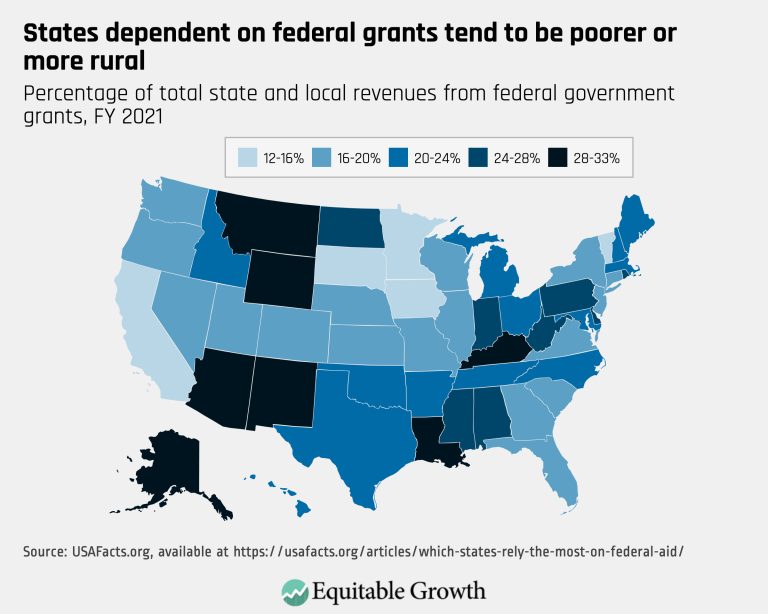
States dependent on federal grants tend to be poorer or more rural (opens in a new tab)
Visualizations AUG 7, 2025
 View Chart
(opens in a new tab)
View Chart
(opens in a new tab)
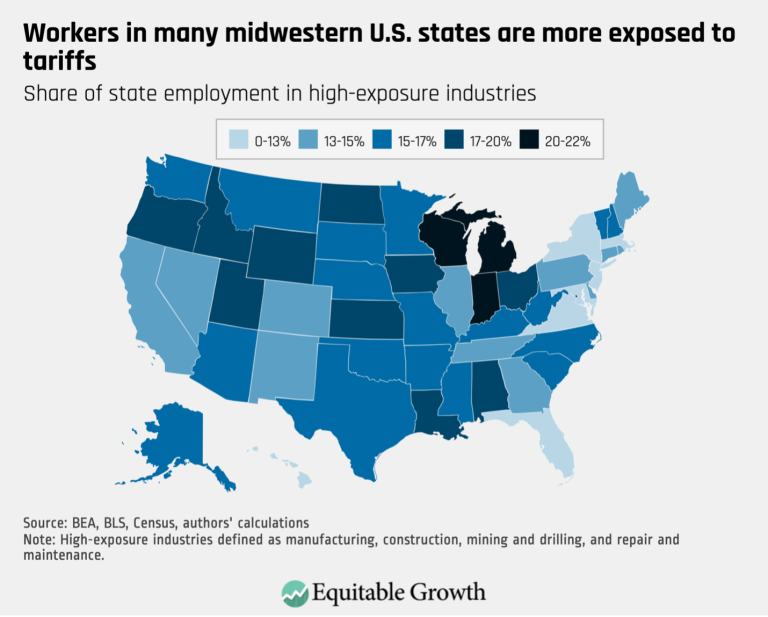
Workers in many midwestern U.S. states are more exposed to tariffs (opens in a new tab)
Visualizations JUL 28, 2025


Your Direct Line to Cutting Edge Research
Be the first to know about our latest events, research releases, and expert insights. Get exclusive updates delivered right to your inbox and never miss an opportunity to engage with our community.