
What happens to U.S. workers without access to Unemployment Insurance amid economic downturns or disruptions related to AI?
Essays SEP 2, 2026
By: Megan Rivera
OCT 27, 2021
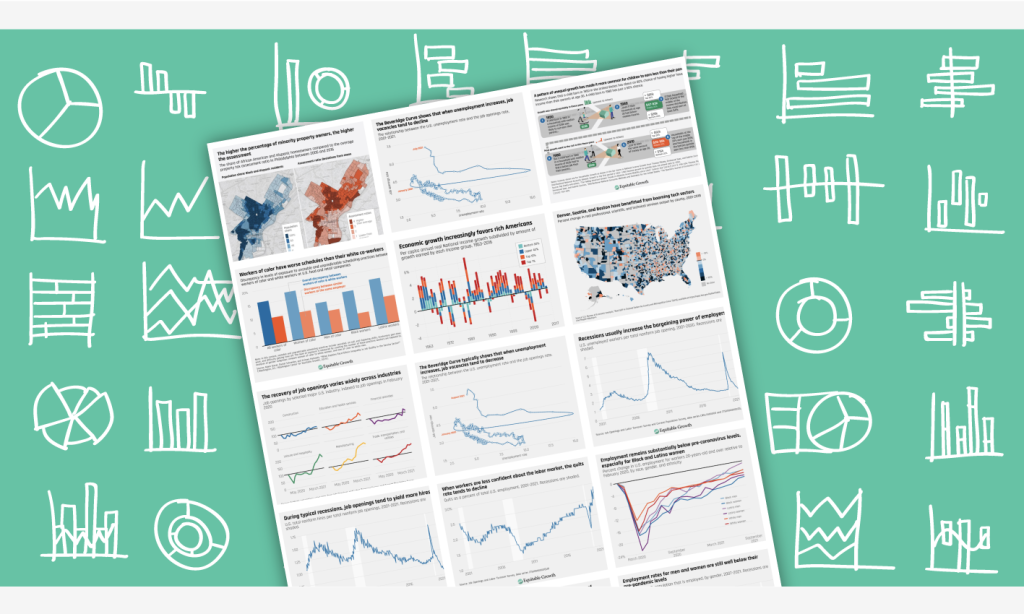
The Washington Center for Equitable Growth last week launched A Visual Economy (opens in a new tab), a new tool to explore thousands of graphics, charts, and figures created by our staff over the past 3 years. The visuals included in this new tool cover a range of topics related to economic inequality and equitable growth, from antitrust enforcement to job mobility, and from monetary policy to the economics of place.
Equitable Growth’s ever-expanding library of visuals has never been so easily accessible. A Visual Economy (opens in a new tab) offers a number of filtering options. One option is filtering by the 31 different subtopics from our website—such as anticompetitive conduct, GDP 2.0, business taxation, or monopsony. Another is by our signature Jobs Day and JOLTS Day features. And another is by a particular timeframe. (See video below.)
Video demo
This tool, years in the making, allows users to explore, sort through, and view nearly all of the graphics that Equitable Growth has produced since the start of 2019—all in one place. It also easily enables users to download the visuals or share them on Facebook and Twitter. All graphics included in A Visual Economy (opens in a new tab) are standalone, which allows them to be easily digestible and used independently.
The tool has a featured visualizations sections at the top of the page to highlight six of Equitable Growth’s favorite graphics. These six figures will be updated periodically to showcase both our most recent work and some of our more classic designs.
A Visual Economy (opens in a new tab) is meant to be a resource for those interested in economic inequality and growth to find graphics that visualize the various ways that evidence-backed policies create strong, stable, and broadly shared growth, as well as the many obstacles to equitable economic growth in the United States. It also is a bountiful resource for those who wish to learn visually about any of the subtopics on our website or the general state of the economy in the United States.
We hope you find it useful, and we can’t wait for you to start exploring it.
Essays SEP 2, 2026
By: Megan Rivera
Essays AUG 31, 2026
By: Christopher Bangert-Drowns
Essays AUG 14, 2026
By: Carlos Fernando Avenancio-Leon
Get updates on our latest research, event announcements, and policy insights delivered straight to your inbox. Stay connected with the leading voices on equitable growth.