


Issue Areas
The Washington Center for Equitable Growth is engaged in an array of issues to advance evidence-based ideas and policies that promote strong, stable, and broad-based economic growth.

152 Results

 View Chart
(opens in a new tab)
View Chart
(opens in a new tab)
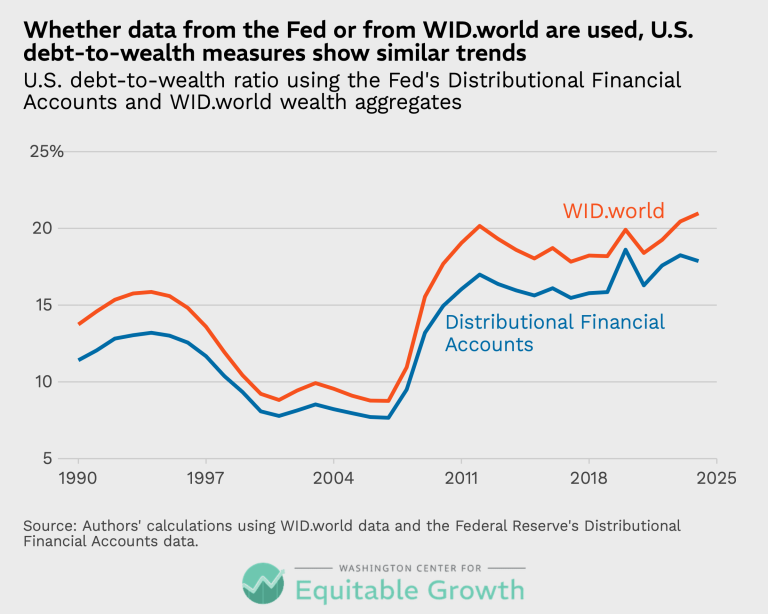
Whether data from the Fed or from WID.world are used, U.S. debt-to-wealth measures show similar trends (opens in a new tab)
Visualizations Jul 22, 2026
 View Chart
(opens in a new tab)
View Chart
(opens in a new tab)
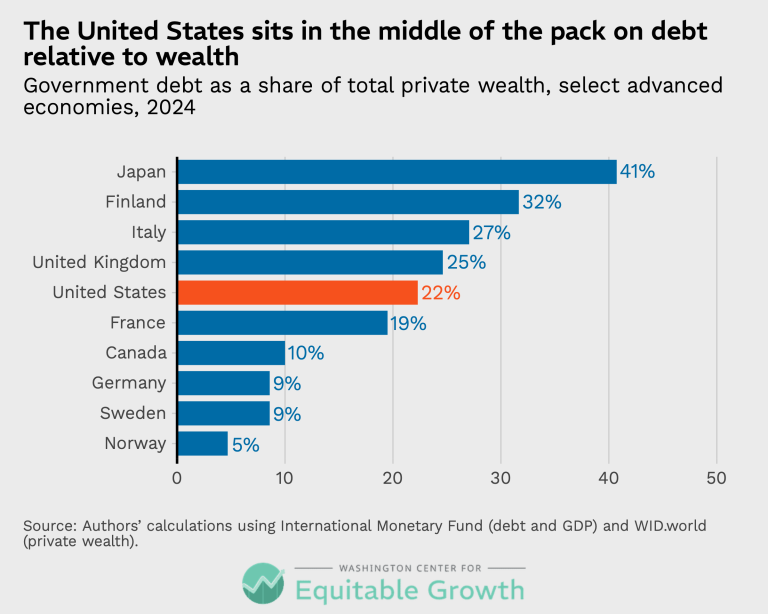
The United States sits in the middle of the pack on debt relative to wealth (opens in a new tab)
Visualizations Jul 22, 2026
 View Chart
(opens in a new tab)
View Chart
(opens in a new tab)
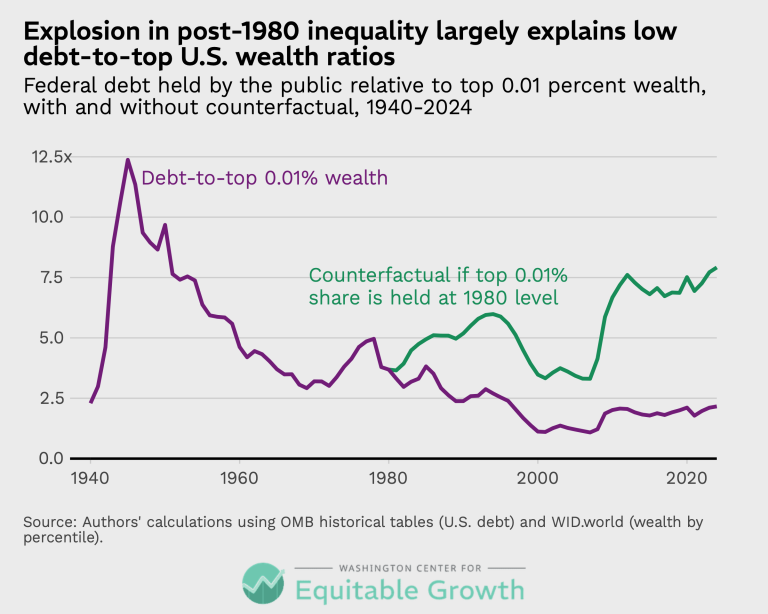
Explosion in post-1980 inequality largely explains low debt-to-top U.S. wealth ratios (opens in a new tab)
Visualizations Jul 22, 2026
 View Chart
(opens in a new tab)
View Chart
(opens in a new tab)
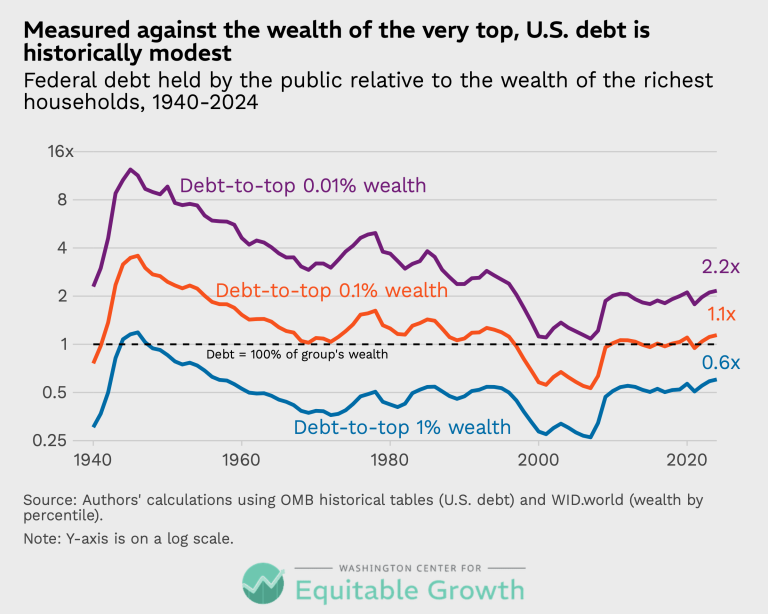
Measured against the wealth of the very top, U.S. debt is historically modest (opens in a new tab)
Visualizations Jul 22, 2026
 View Chart
(opens in a new tab)
View Chart
(opens in a new tab)
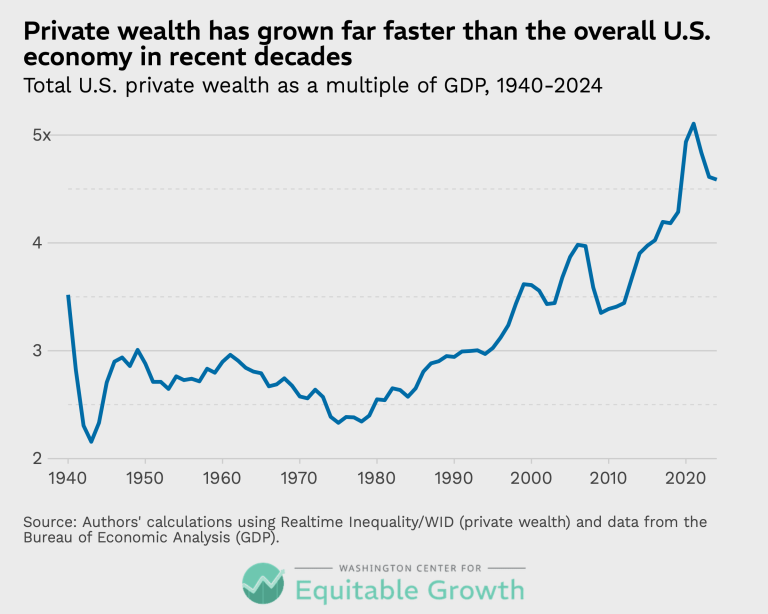
Private wealth has grown far faster than the overall U.S. economy in recent decades (opens in a new tab)
Visualizations Jul 22, 2026
 View Chart
(opens in a new tab)
View Chart
(opens in a new tab)
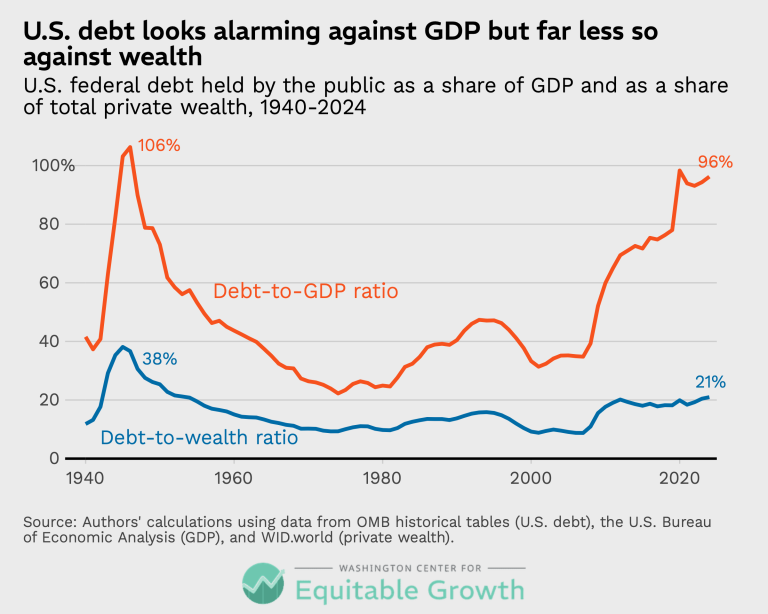
U.S. debt looks alarming against GDP but far less so against wealth (opens in a new tab)
Visualizations Jul 22, 2026
 View Chart
(opens in a new tab)
View Chart
(opens in a new tab)
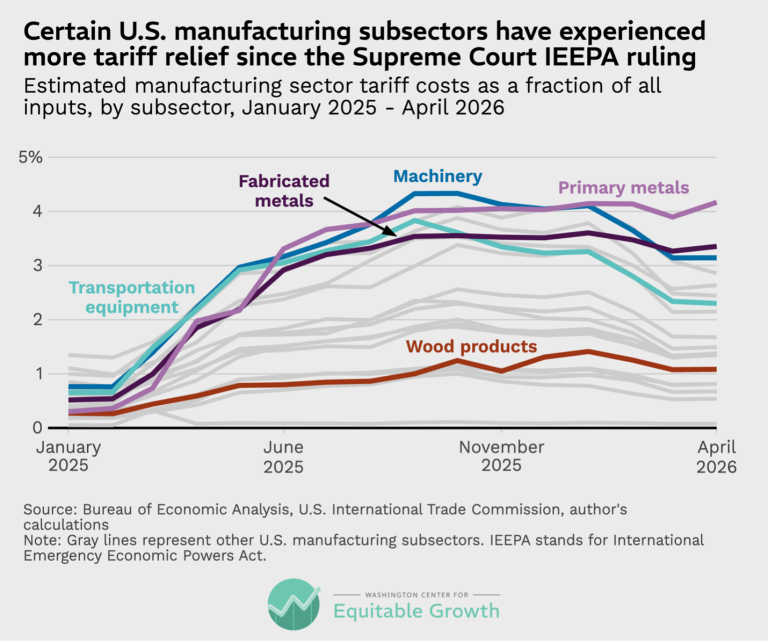
Certain U.S. manufacturing subsectors have experienced more tariff relief since the Supreme Court IEEPA ruling (opens in a new tab)
Visualizations Jul 13, 2026
 View Chart
(opens in a new tab)
View Chart
(opens in a new tab)
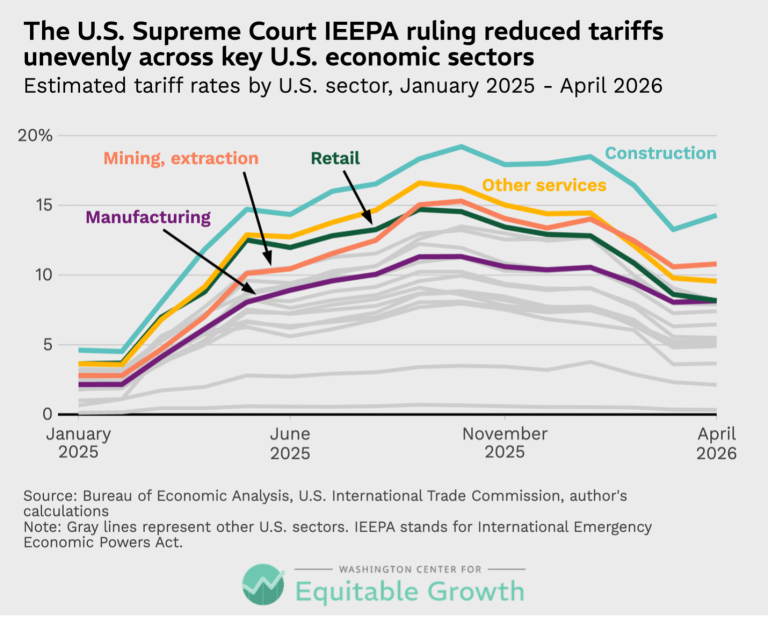
The U.S. Supreme Court IEEPA ruling reduced tariffs unevenly across key U.S. economic sectors (opens in a new tab)
Visualizations Jul 13, 2026
 View Chart
(opens in a new tab)
View Chart
(opens in a new tab)
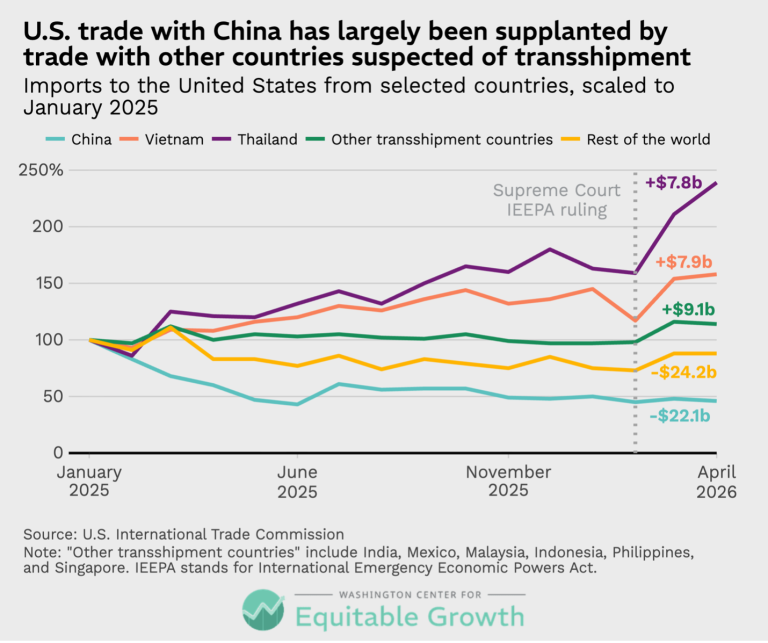
U.S. trade with China has largely been supplanted by trade with other countries suspected of transshipment (opens in a new tab)
Visualizations Jul 13, 2026
 View Chart
(opens in a new tab)
View Chart
(opens in a new tab)
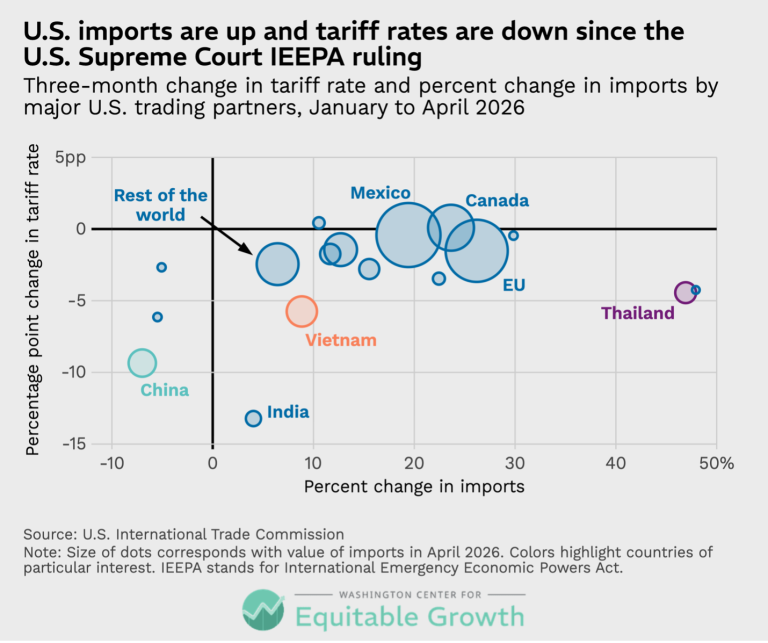
U.S. imports are up and tariff rates are down since the U.S. Supreme Court IEEPA ruling (opens in a new tab)
Visualizations Jul 13, 2026
 View Chart
(opens in a new tab)
View Chart
(opens in a new tab)
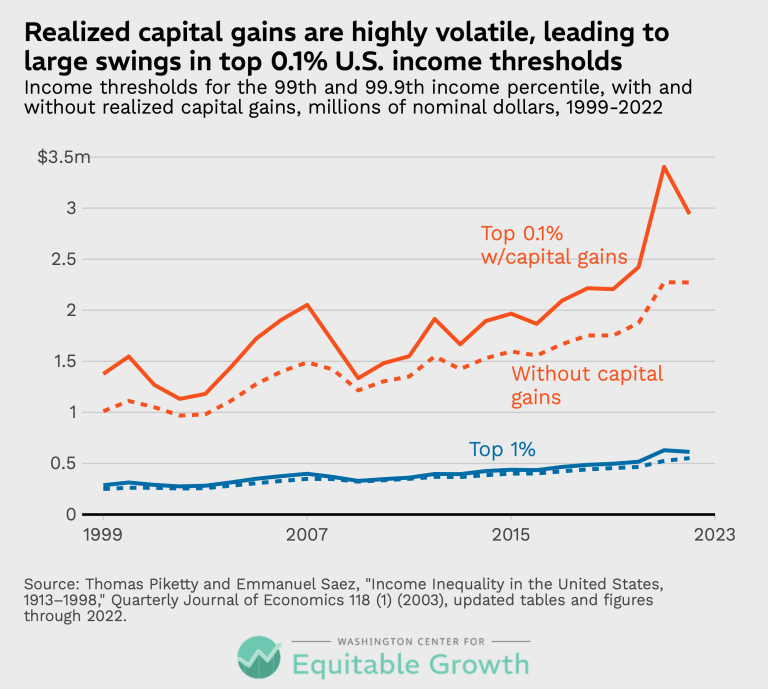
Realized capital gains are highly volatile, leading to large swings in the top 0.1% U.S. income thresholds (opens in a new tab)
Visualizations May 26, 2026
 View Chart
(opens in a new tab)
View Chart
(opens in a new tab)
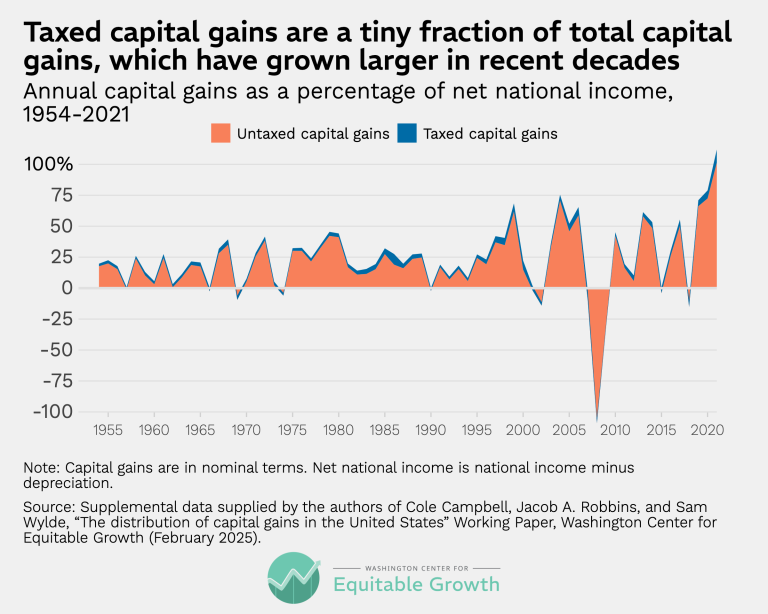
Taxed capital gains are a tiny fraction of total capital gains, which have grown larger in recent decades (opens in a new tab)
Visualizations May 6, 2026
 View Chart
(opens in a new tab)
View Chart
(opens in a new tab)
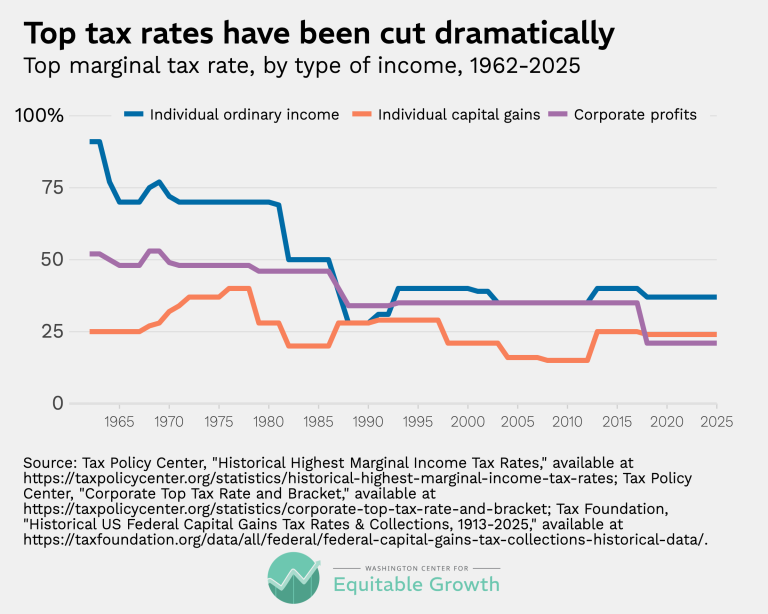
Top tax rates have been cut dramatically (opens in a new tab)
Visualizations May 6, 2026
 View Chart
(opens in a new tab)
View Chart
(opens in a new tab)
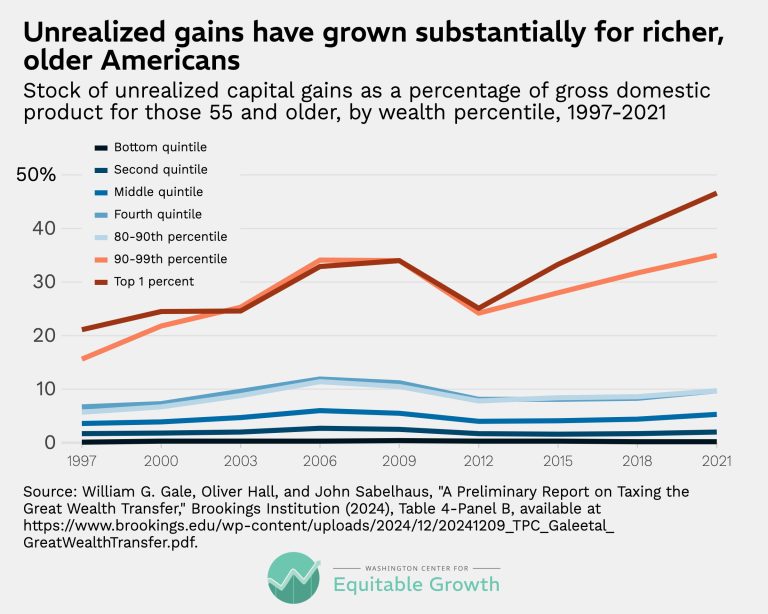
Unrealized gains have grown substantially for richer, older Americans (opens in a new tab)
Visualizations May 6, 2026
 View Chart
(opens in a new tab)
View Chart
(opens in a new tab)
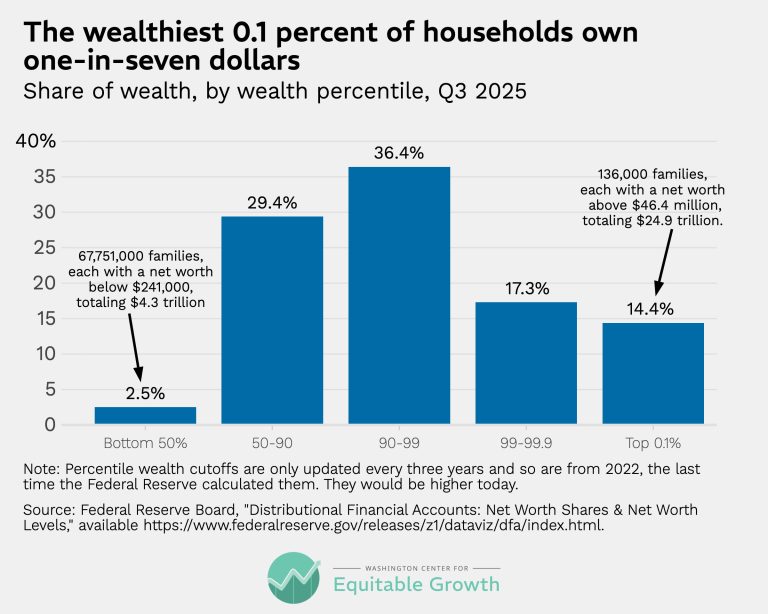
The wealthiest 0.1 percent of households own one-in-seven dollars (opens in a new tab)
Visualizations May 6, 2026
 View Chart
(opens in a new tab)
View Chart
(opens in a new tab)
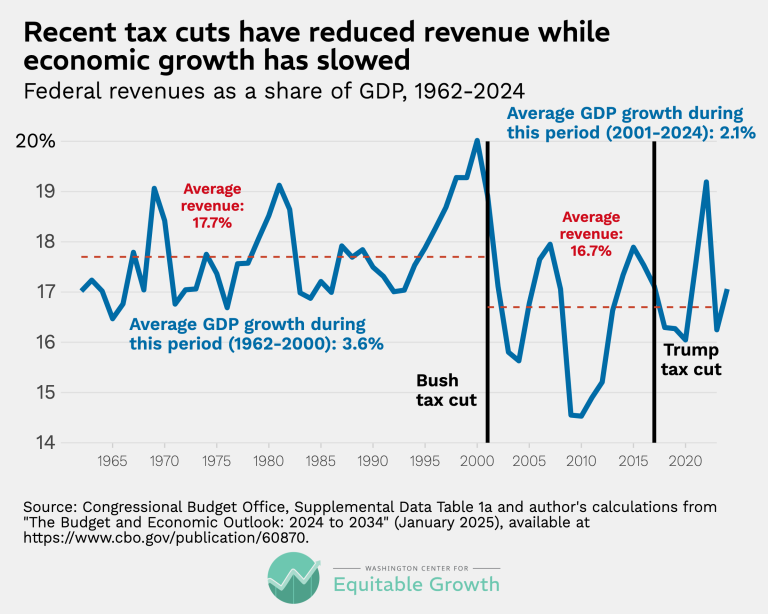
Recent tax cuts have reduced revenue while economic growth has slowed (opens in a new tab)
Visualizations May 6, 2026
 View Chart
(opens in a new tab)
View Chart
(opens in a new tab)
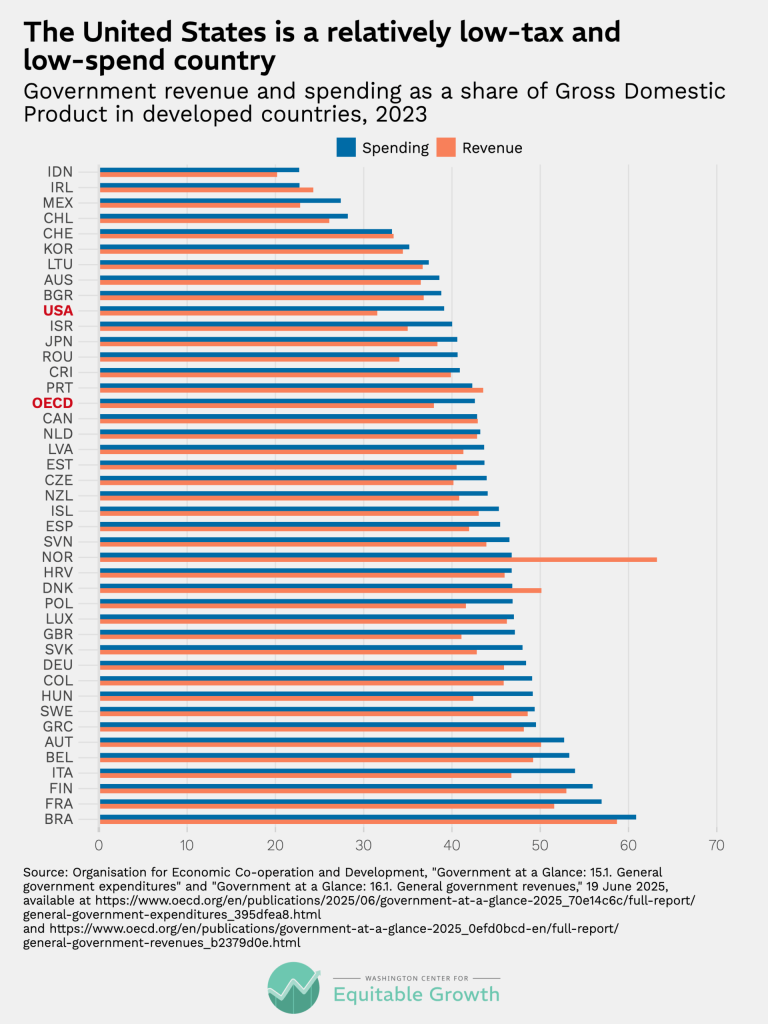
The United States is a relatively low-tax and low-spend country (opens in a new tab)
Visualizations May 6, 2026
 View Chart
(opens in a new tab)
View Chart
(opens in a new tab)
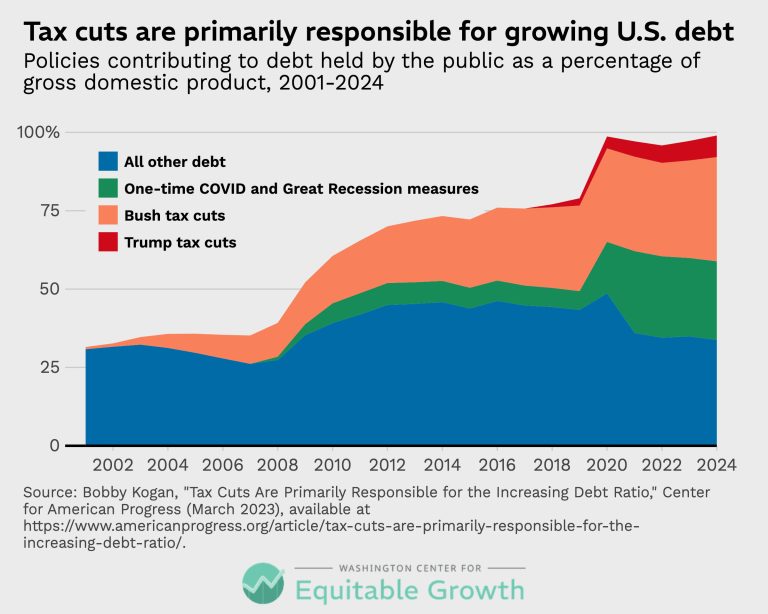
Tax cuts are primarily responsible for the growing U.S. debt (opens in a new tab)
Visualizations May 6, 2026
 View Chart
(opens in a new tab)
View Chart
(opens in a new tab)
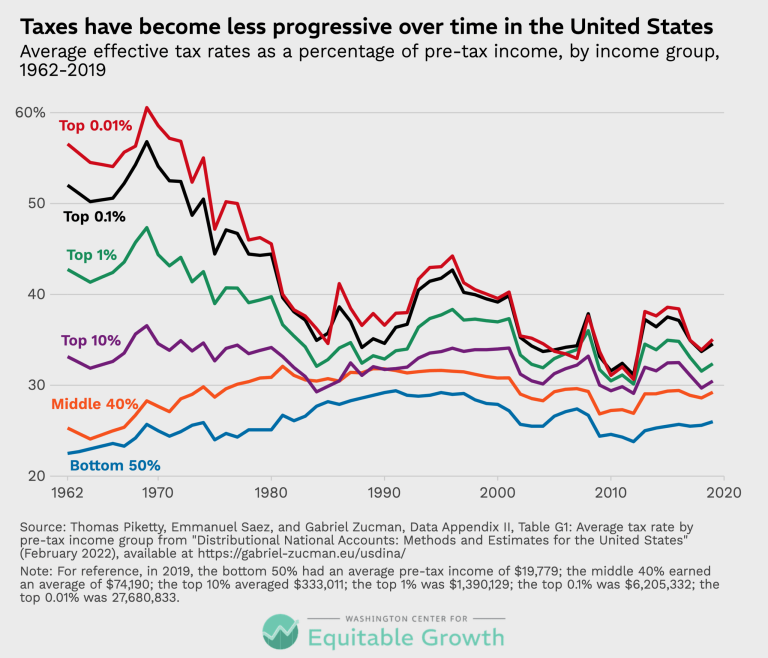
Taxes have become less progressive over time in the United States (opens in a new tab)
Visualizations May 6, 2026
 View Chart
(opens in a new tab)
View Chart
(opens in a new tab)
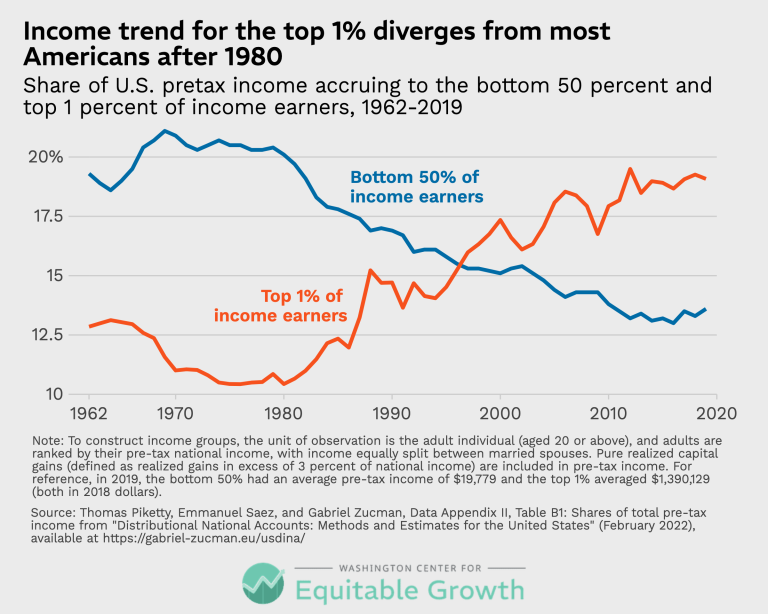
Income trend for the top 1% diverges from most Americans after 1980 (opens in a new tab)
Visualizations May 6, 2026
 View Chart
(opens in a new tab)
View Chart
(opens in a new tab)
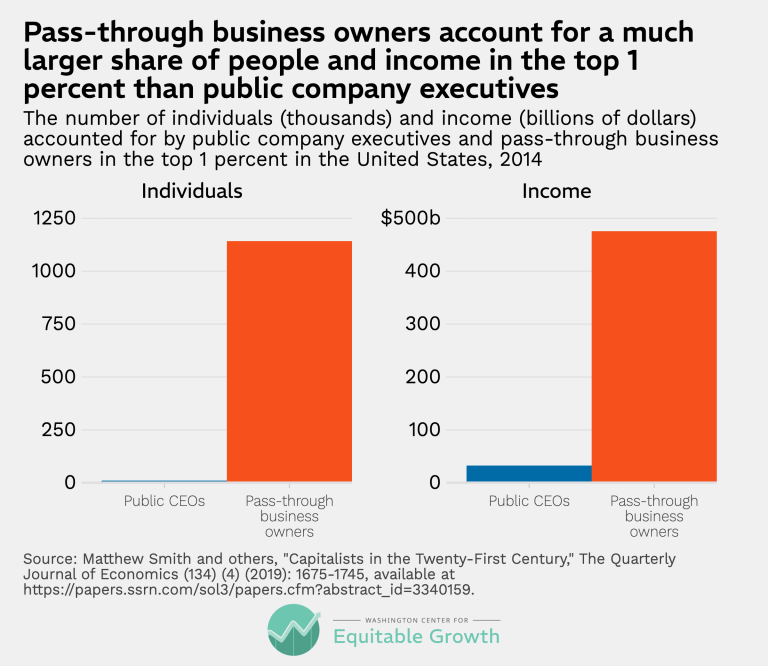
Pass-through business owners account for a much larger share of people and income in the top 1 percent than public company executives (opens in a new tab)
Visualizations Apr 14, 2026
 View Chart
(opens in a new tab)
View Chart
(opens in a new tab)
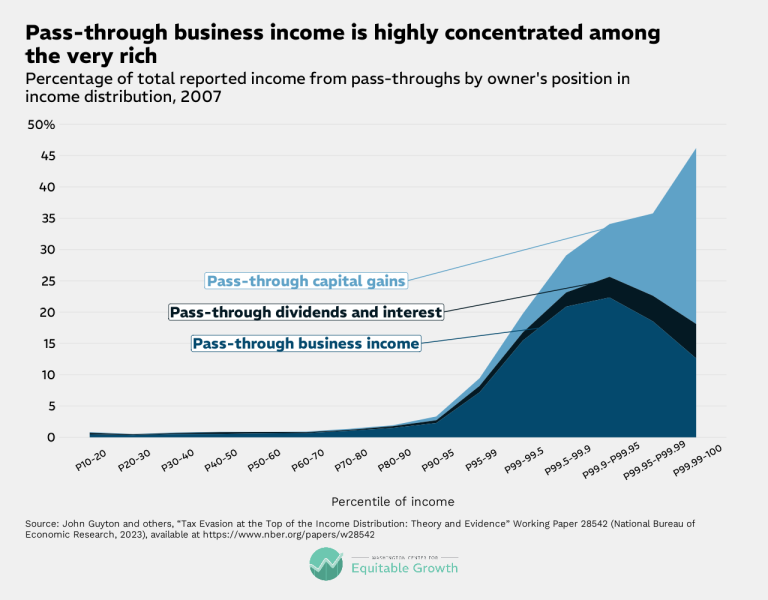
Pass-through business income is highly concentrated among the very rich (opens in a new tab)
Visualizations Apr 14, 2026
 View Chart
(opens in a new tab)
View Chart
(opens in a new tab)
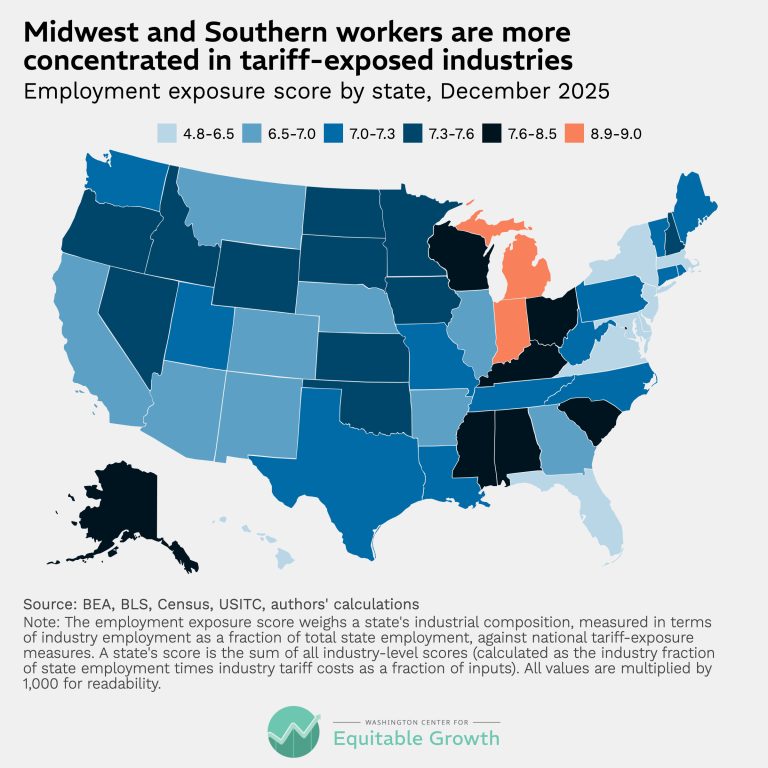
Midwest and Southern workers are more concentrated in tariff-exposed industries (opens in a new tab)
Visualizations Mar 17, 2026
 View Chart
(opens in a new tab)
View Chart
(opens in a new tab)
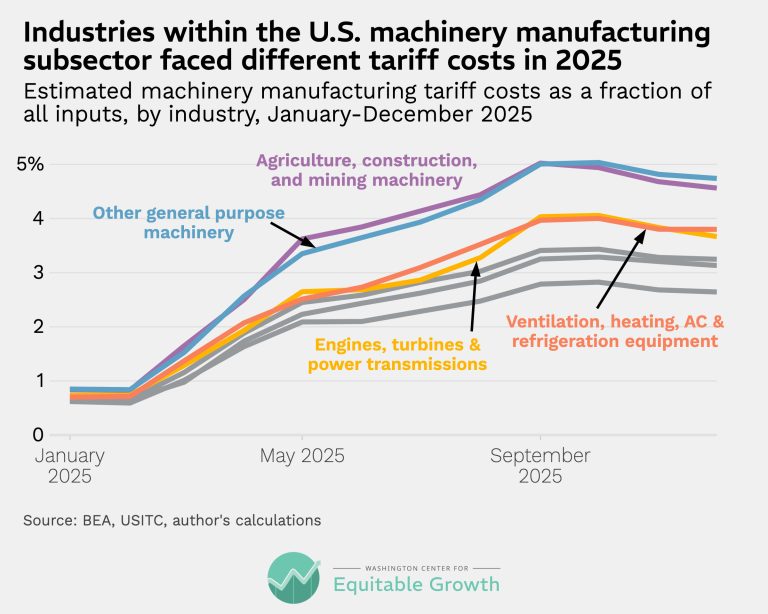
Industries within the U.S. machinery manufacturing subsector faced different tariff costs in 2025 (opens in a new tab)
Visualizations Mar 17, 2026
 View Chart
(opens in a new tab)
View Chart
(opens in a new tab)
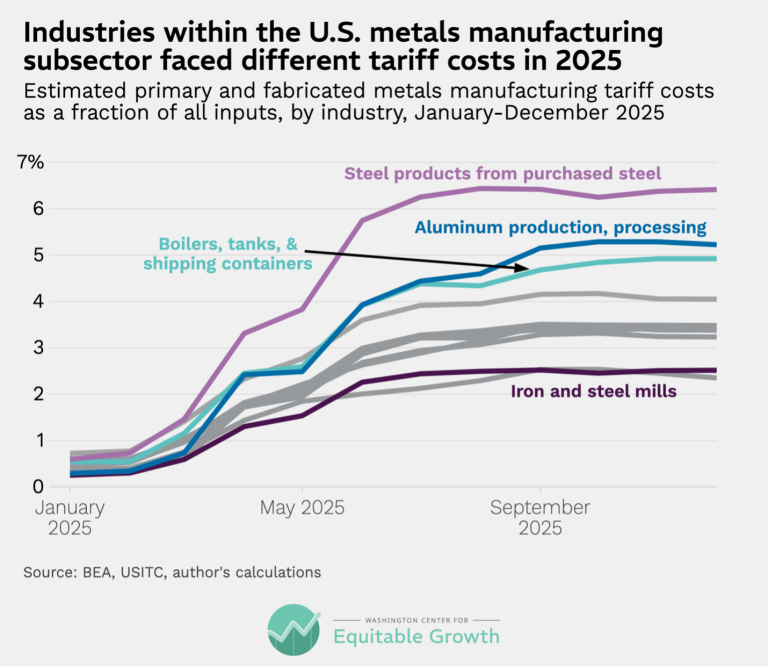
Industries within the U.S. metals manufacturing subsector faced different tariff costs in 2025 (opens in a new tab)
Visualizations Mar 17, 2026
 View Chart
(opens in a new tab)
View Chart
(opens in a new tab)
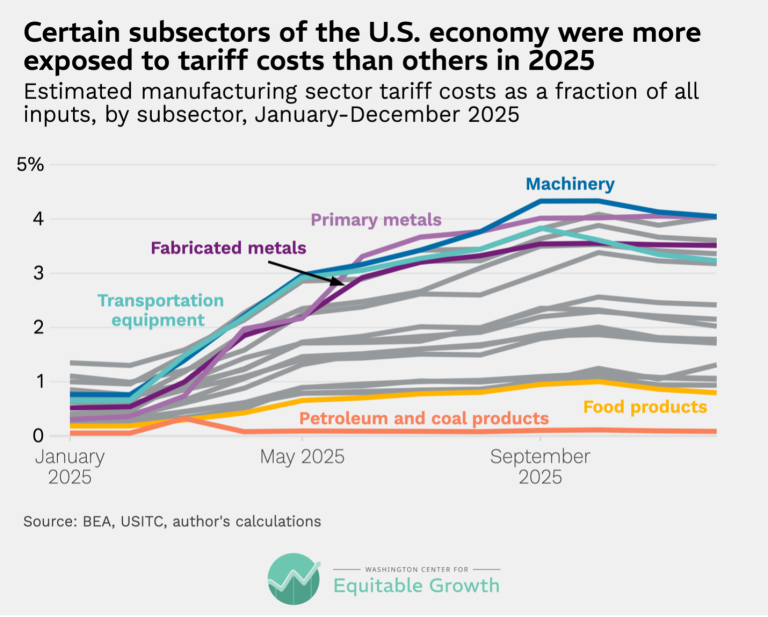
Certain subsectors of the U.S. economy were more exposed to tariff costs than others in 2025 (opens in a new tab)
Visualizations Mar 17, 2026
 View Chart
(opens in a new tab)
View Chart
(opens in a new tab)
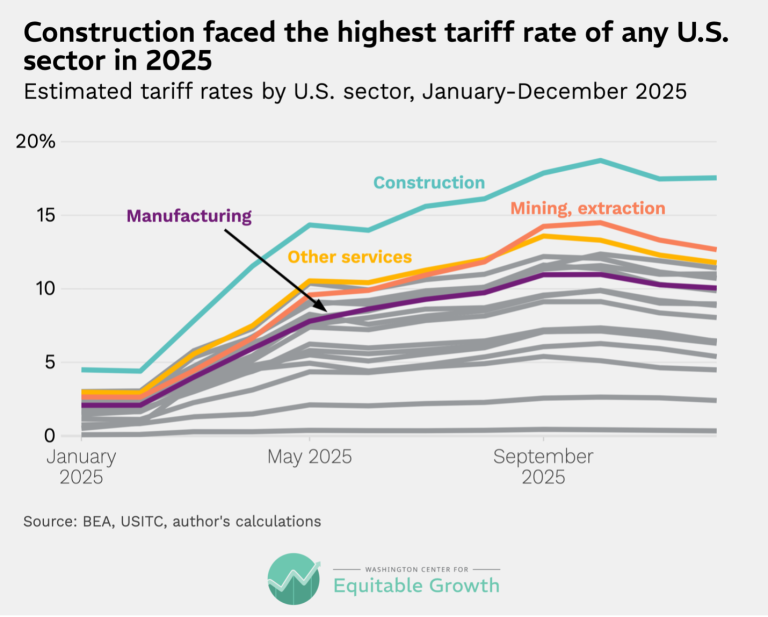
Construction faced the highest tariff rate of any U.S. sector in 2025 (opens in a new tab)
Visualizations Mar 17, 2026
 View Chart
(opens in a new tab)
View Chart
(opens in a new tab)
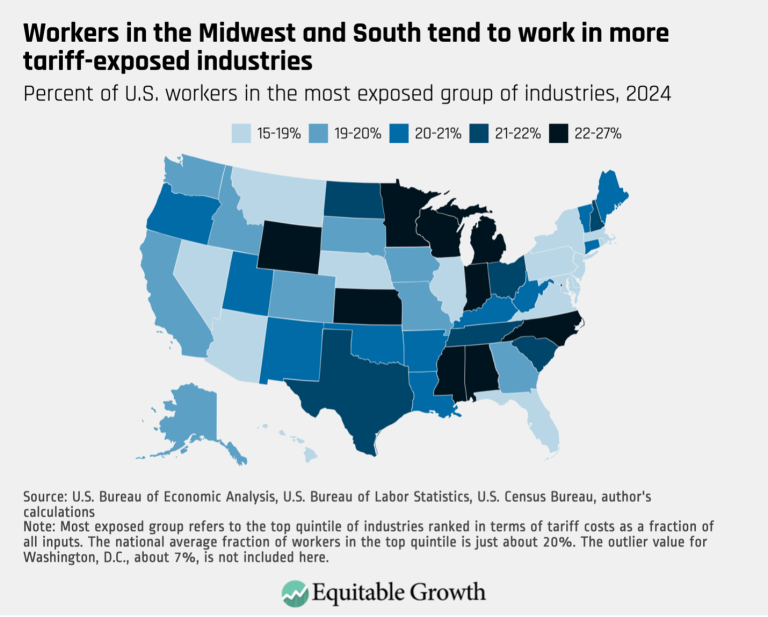
Workers in the Midwest and South tend to work in more tariff-exposed industries (opens in a new tab)
Visualizations Nov 3, 2025
 View Chart
(opens in a new tab)
View Chart
(opens in a new tab)
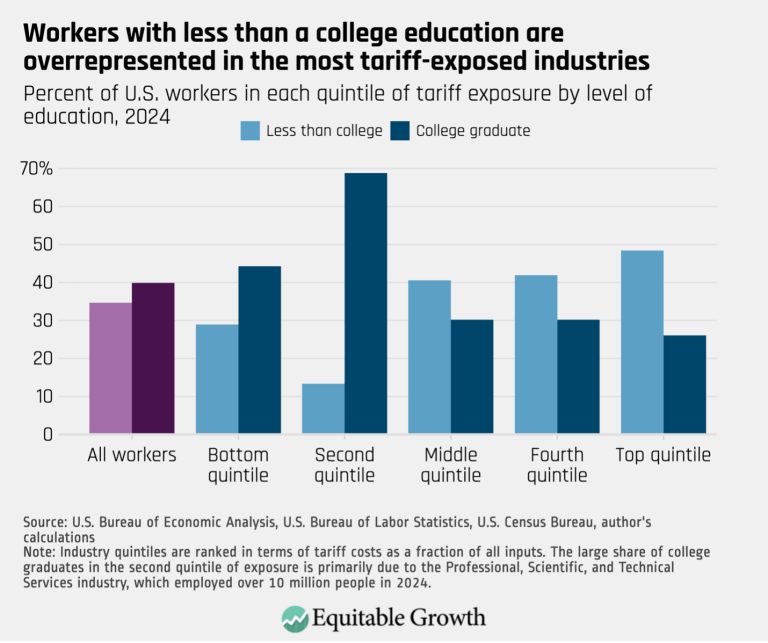
Workers with less than a college education are overrepresented in the most tariff-exposed industries (opens in a new tab)
Visualizations Nov 3, 2025
 View Chart
(opens in a new tab)
View Chart
(opens in a new tab)
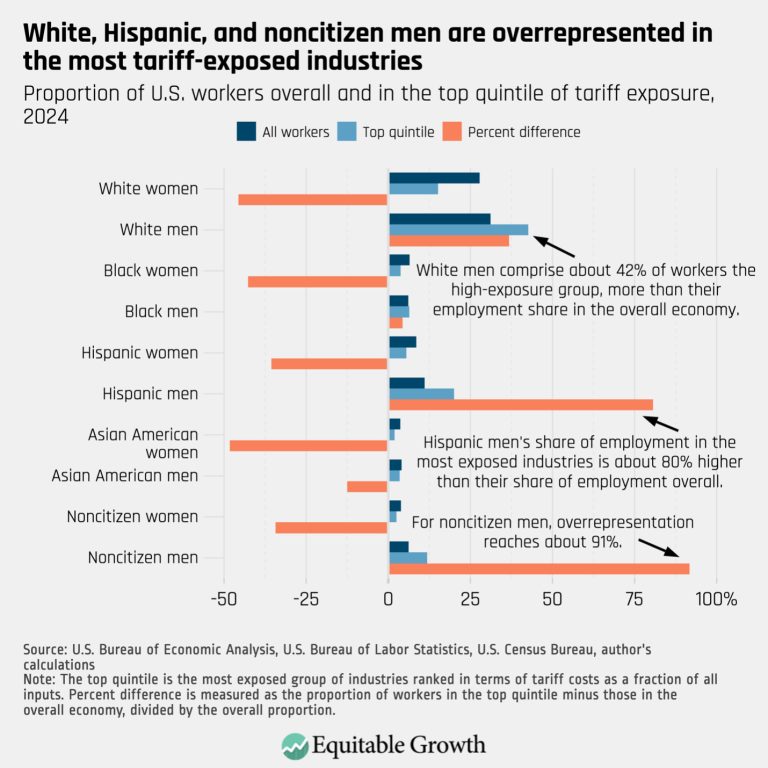
White, Hispanic, and noncitizen men are overrepresented in the most tariff-exposed industries (opens in a new tab)
Visualizations Nov 3, 2025
 View Chart
(opens in a new tab)
View Chart
(opens in a new tab)
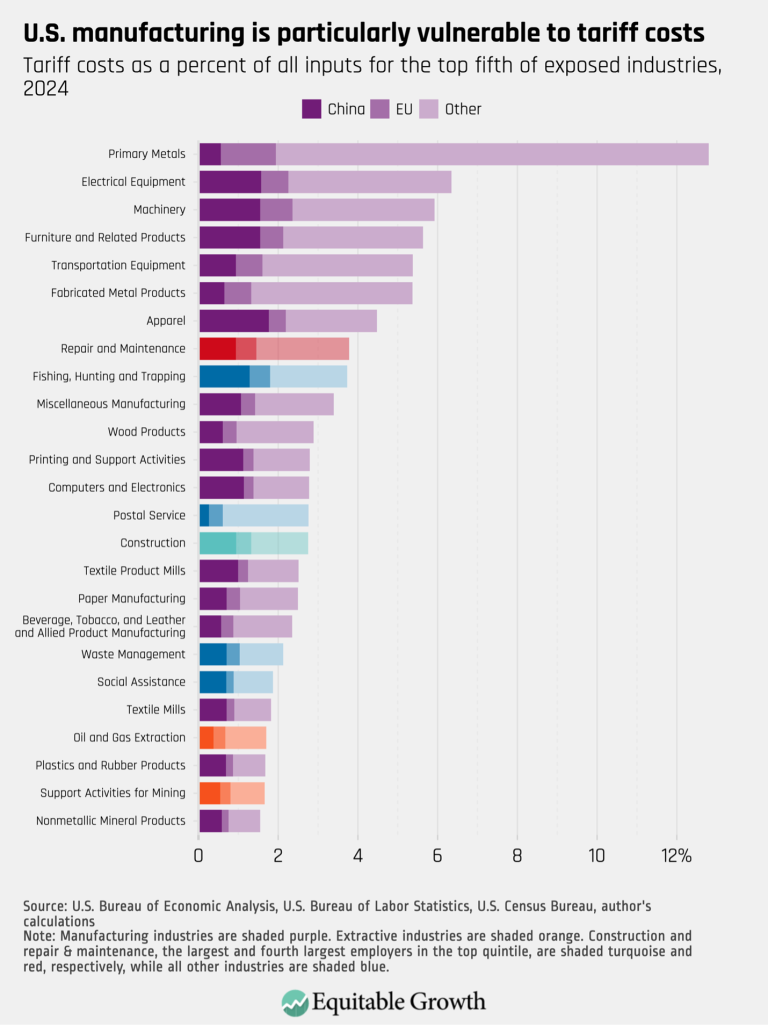
U.S. manufacturing is particularly vulnerable to tariff costs (opens in a new tab)
Visualizations Nov 3, 2025
 View Chart
(opens in a new tab)
View Chart
(opens in a new tab)
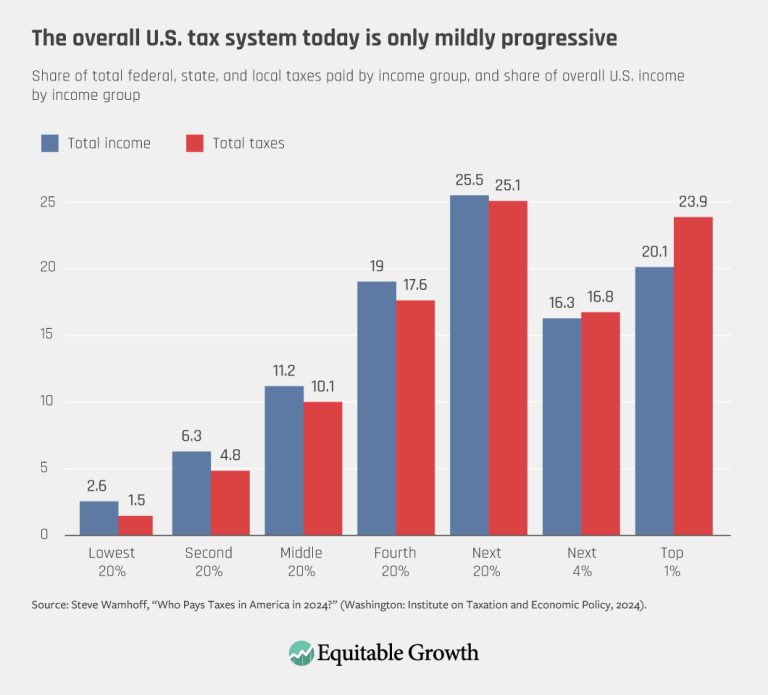
The overall U.S. tax system today is only mildly progressive (opens in a new tab)
Visualizations Sep 10, 2025
 View Chart
(opens in a new tab)
View Chart
(opens in a new tab)
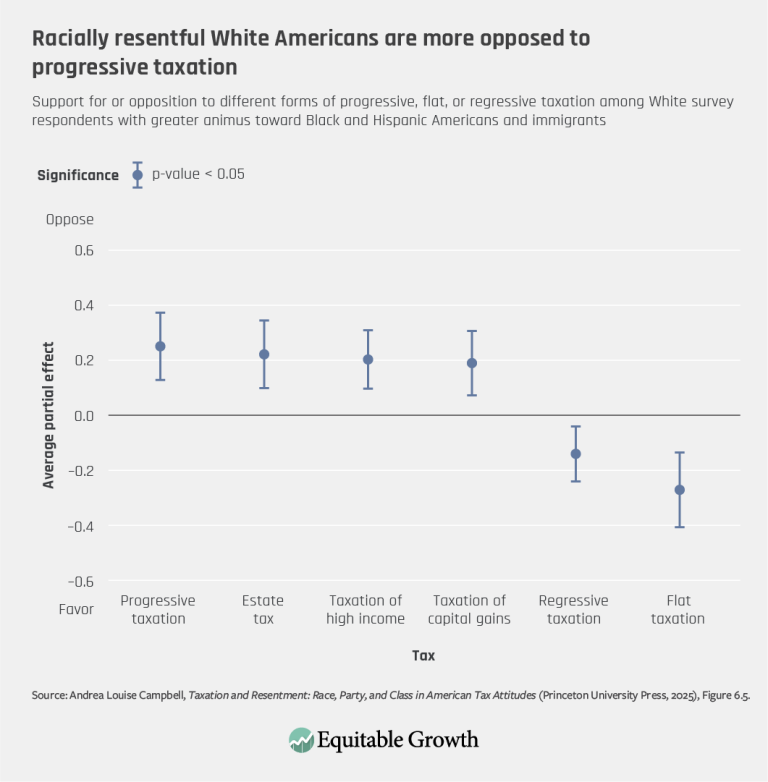
Racially resentful White Americans are more opposed to progressive taxation (opens in a new tab)
Visualizations Sep 9, 2025
 View Chart
(opens in a new tab)
View Chart
(opens in a new tab)
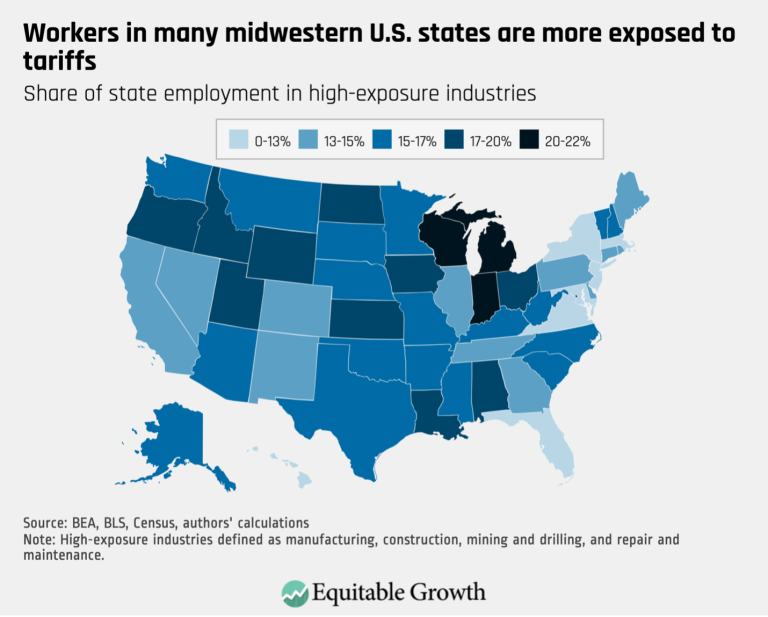
Workers in many midwestern U.S. states are more exposed to tariffs (opens in a new tab)
Visualizations Jul 28, 2025
 View Chart
(opens in a new tab)
View Chart
(opens in a new tab)
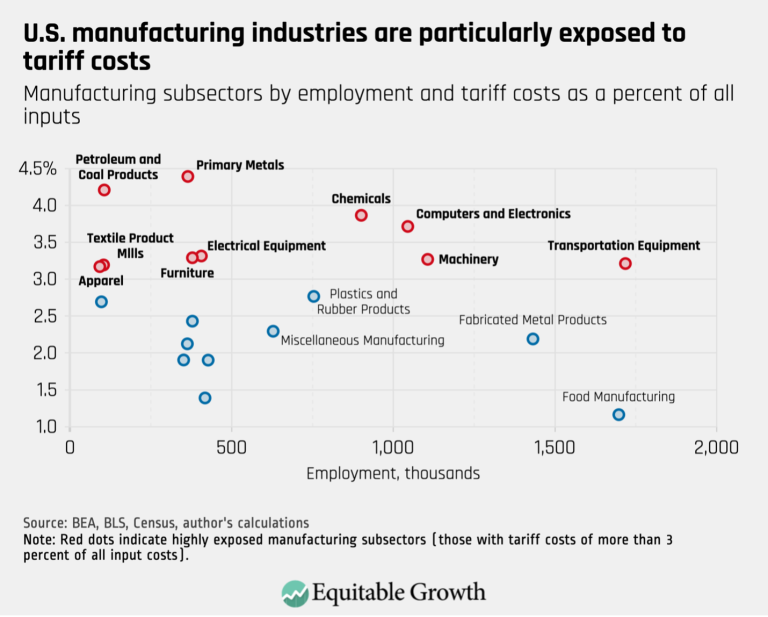
U.S. manufacturing industries are particularly exposed to tariff costs (opens in a new tab)
Visualizations Jul 28, 2025
 View Chart
(opens in a new tab)
View Chart
(opens in a new tab)
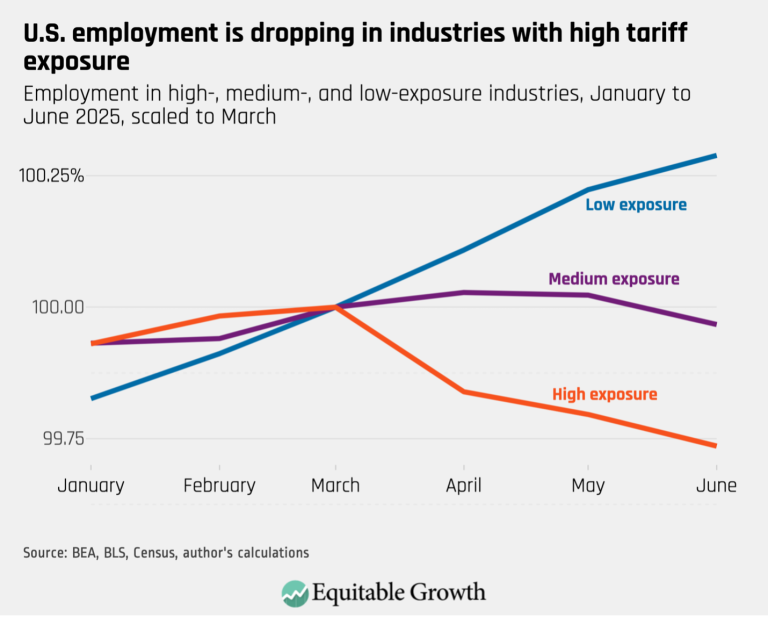
U.S. employment is dropping in industries with high tariff exposure (opens in a new tab)
Visualizations Jul 28, 2025
 View Chart
(opens in a new tab)
View Chart
(opens in a new tab)
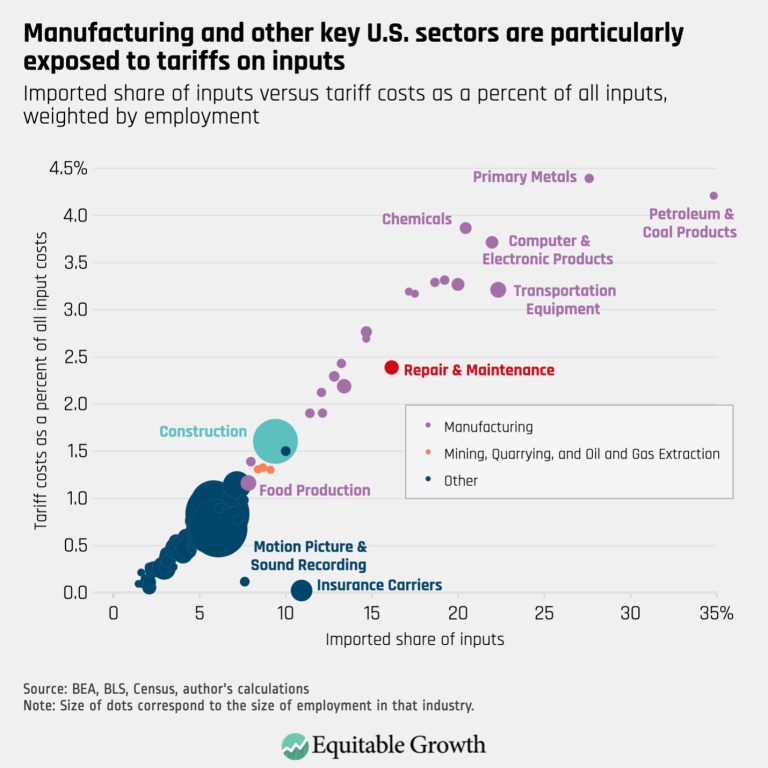
Manufacturing and other key U.S. sectors are particularly exposed to tariffs on inputs (opens in a new tab)
Visualizations Jul 28, 2025
 View Chart
(opens in a new tab)
View Chart
(opens in a new tab)
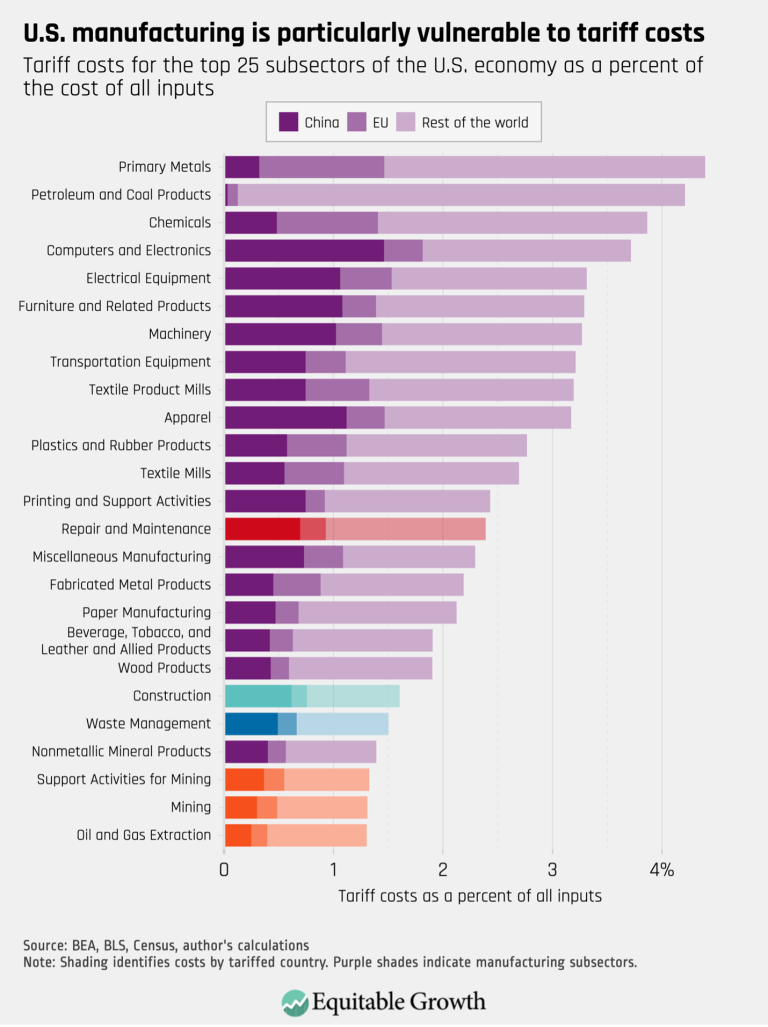
U.S. manufacturing is particularly vulnerable to tariff costs (opens in a new tab)
Visualizations Jul 28, 2025
 View Chart
(opens in a new tab)
View Chart
(opens in a new tab)
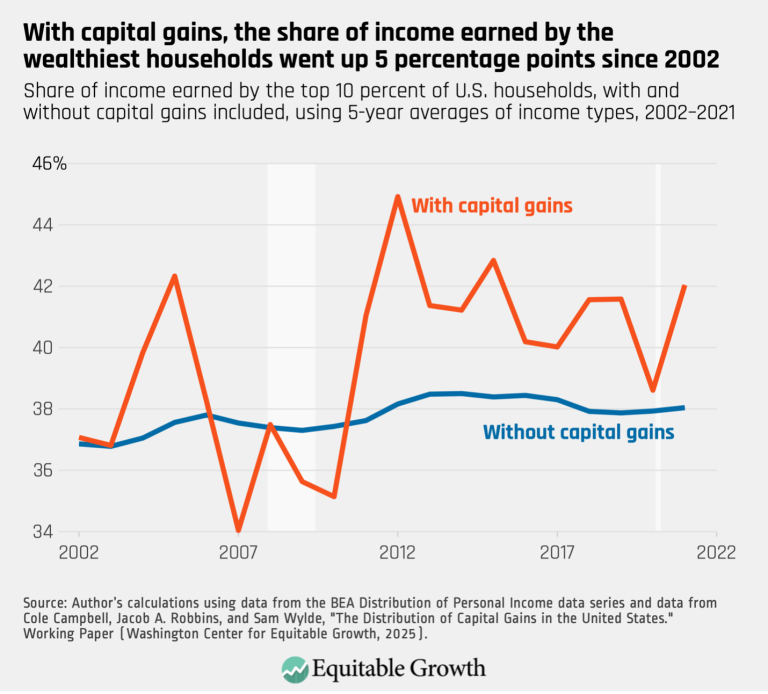
With capital gains, the share of income earned by the wealthiest households went up 5 percentage points since 2002 (opens in a new tab)
Visualizations Jul 14, 2025
 View Chart
(opens in a new tab)
View Chart
(opens in a new tab)
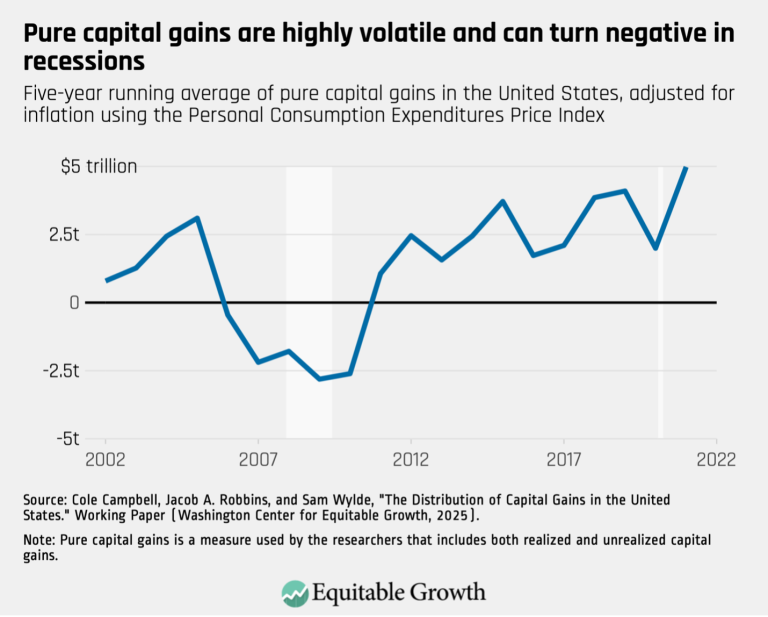
Pure capital gains are highly volatile and can turn negative in recessions (opens in a new tab)
Visualizations Jul 14, 2025
 View Chart
(opens in a new tab)
View Chart
(opens in a new tab)
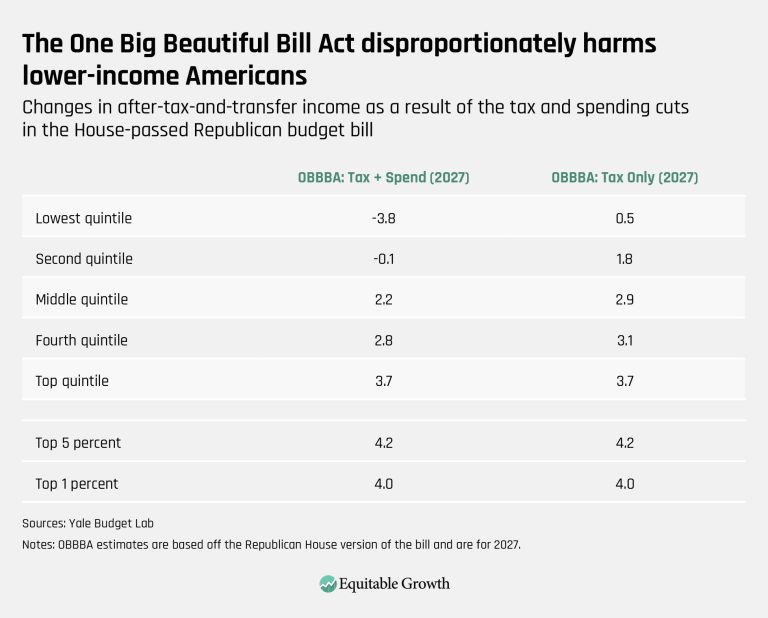
The One Big Beautiful Bill Act disproportionately harms lower-income Americans (opens in a new tab)
Visualizations Jul 3, 2025
 View Chart
(opens in a new tab)
View Chart
(opens in a new tab)
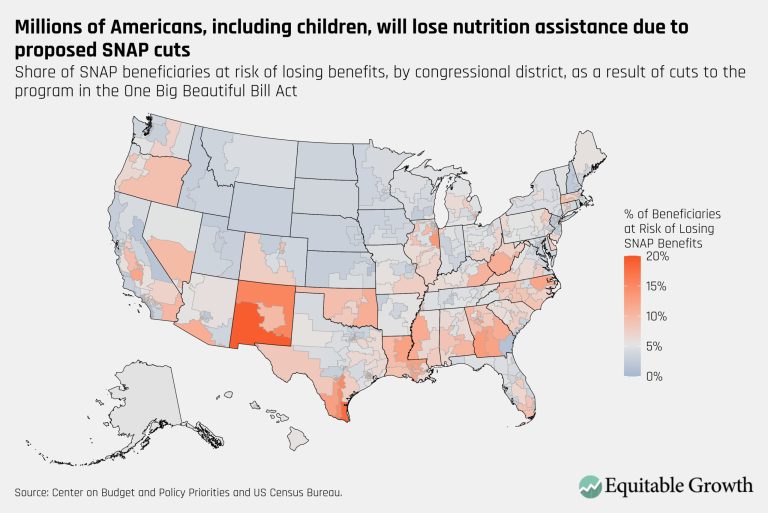
Millions of Americans, including children, will lose nutrition assistance due to proposed SNAP cuts – updated (opens in a new tab)
Visualizations Jun 24, 2025
 View Chart
(opens in a new tab)
View Chart
(opens in a new tab)
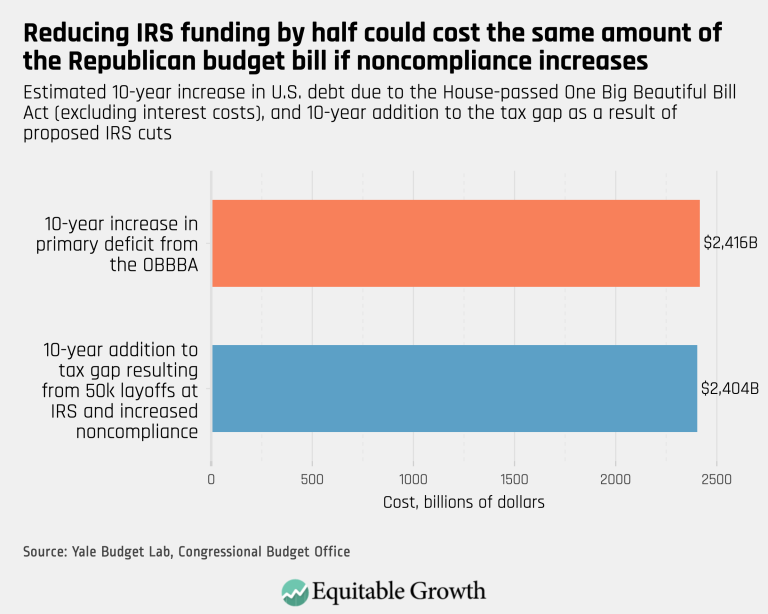
Reducing IRS funding by half could cost the same amount of the Republican budget bill in noncompliance increases (opens in a new tab)
Visualizations Jun 23, 2025
 View Chart
(opens in a new tab)
View Chart
(opens in a new tab)
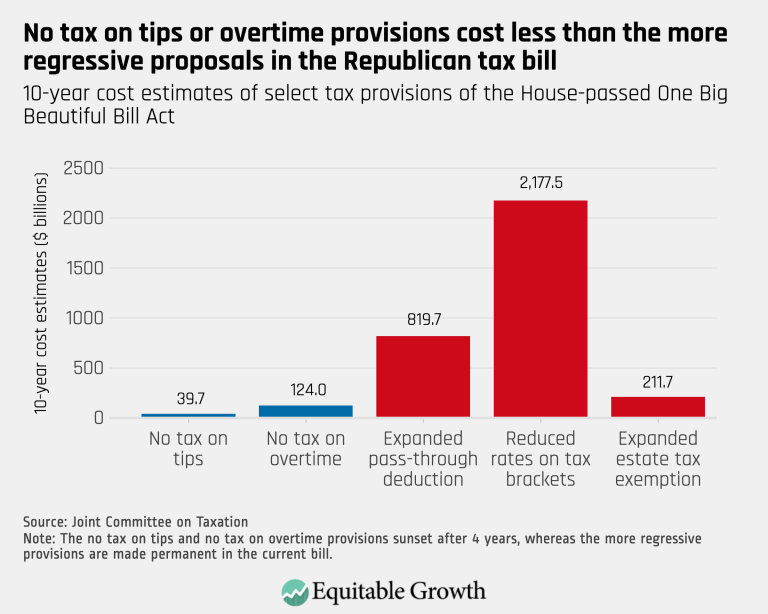
No tax on tips or overtime provisions cost less than the more regressive proposals in the Republican tax bill (opens in a new tab)
Visualizations Jun 23, 2025
 View Chart
(opens in a new tab)
View Chart
(opens in a new tab)
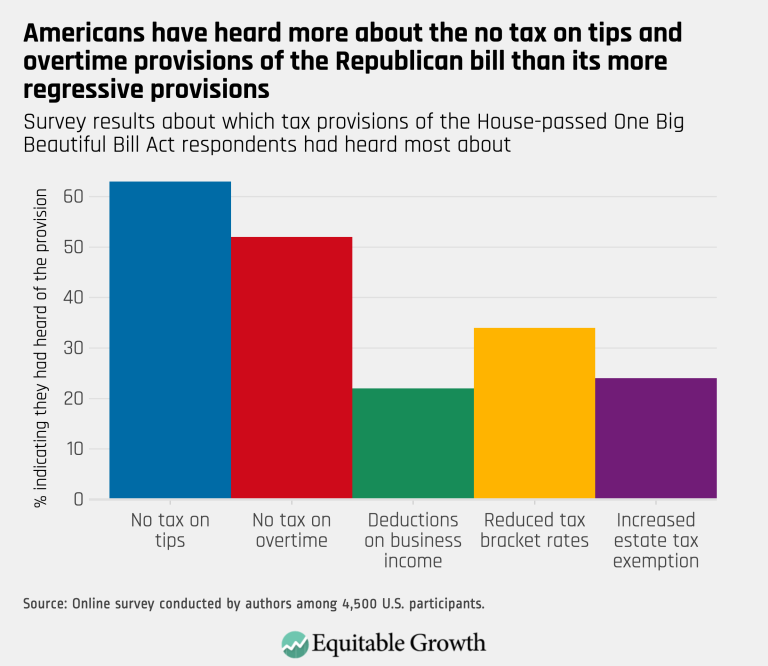
Americans have heard more about the no tax on tips and overtime provisions of the Republican bill than its more regressive provisions (opens in a new tab)
Visualizations Jun 23, 2025
 View Chart
(opens in a new tab)
View Chart
(opens in a new tab)
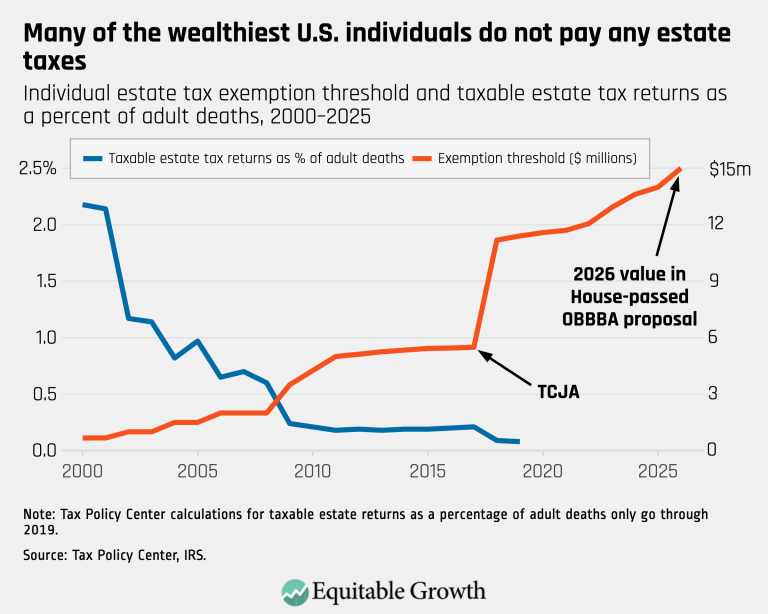
Many of the wealthiest U.S. individuals do not pay any estate taxes (opens in a new tab)
Visualizations Jun 23, 2025
 View Chart
(opens in a new tab)
View Chart
(opens in a new tab)
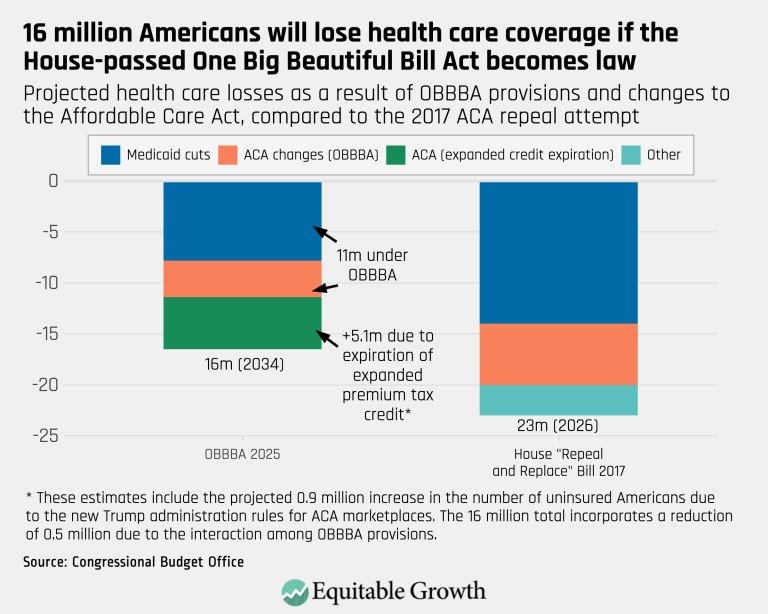
16 million Americans will lose health care coverage if the House-passed One Big Beautiful Bill Act becomes law (opens in a new tab)
Visualizations Jun 23, 2025
 View Chart
(opens in a new tab)
View Chart
(opens in a new tab)
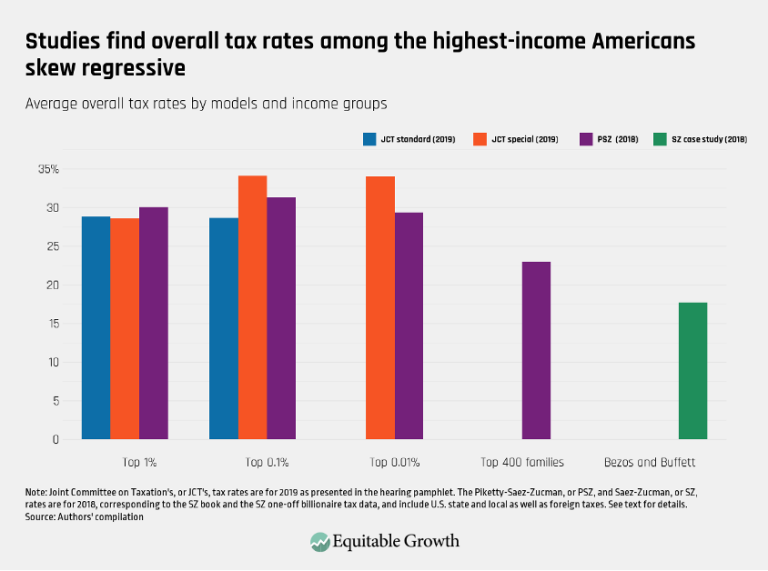
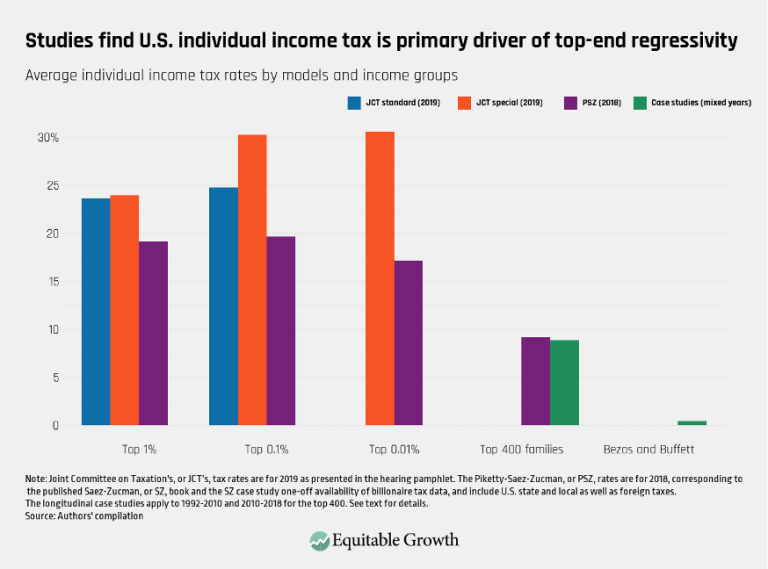
Studies find overall tax rates among the highest-income Americans skew regressive (opens in a new tab)
Visualizations Jun 10, 2025
 View Chart
(opens in a new tab)
View Chart
(opens in a new tab)
Studies find U.S. individual income tax is primary driver of top-end regressivity (opens in a new tab)
Visualizations Jun 10, 2025
 View Chart
(opens in a new tab)
View Chart
(opens in a new tab)
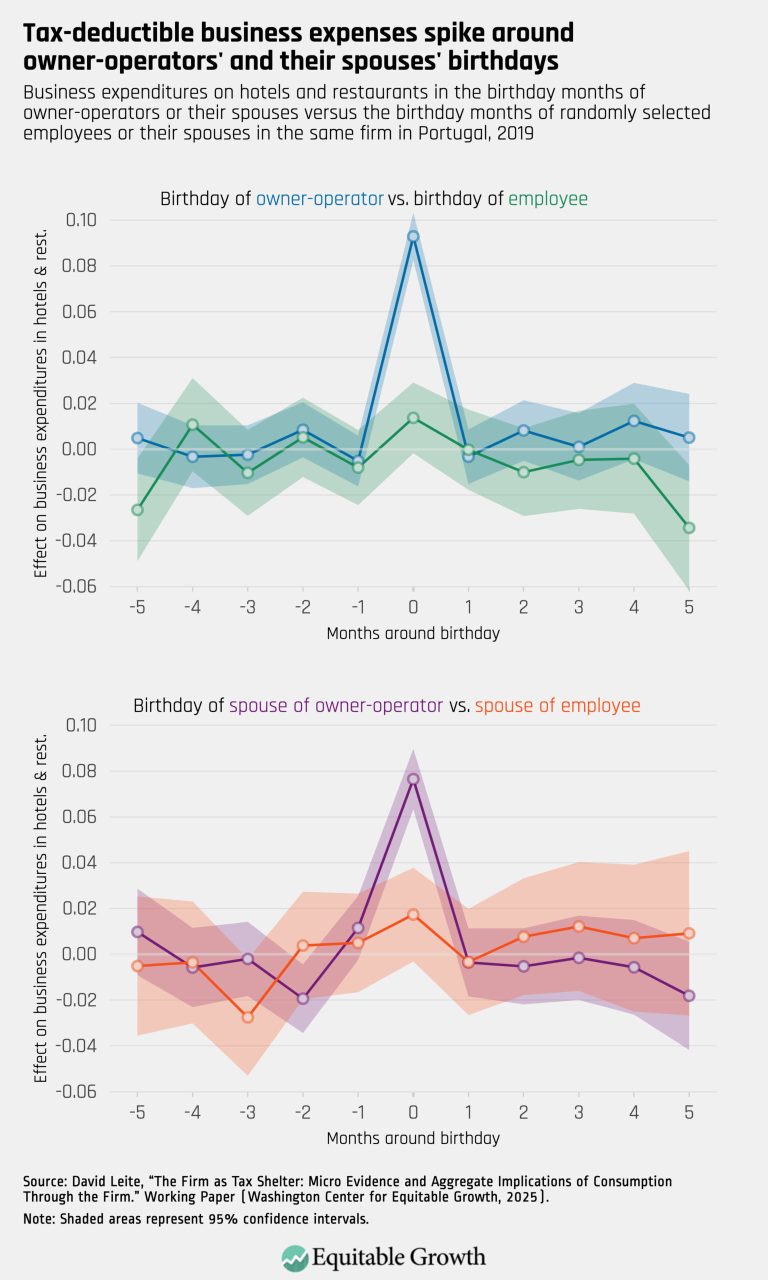
Tax-deductible business expenses spike around owner-operators’ and their spouses’ birthdays – updated (opens in a new tab)
Visualizations Jun 5, 2025
 View Chart
(opens in a new tab)
View Chart
(opens in a new tab)
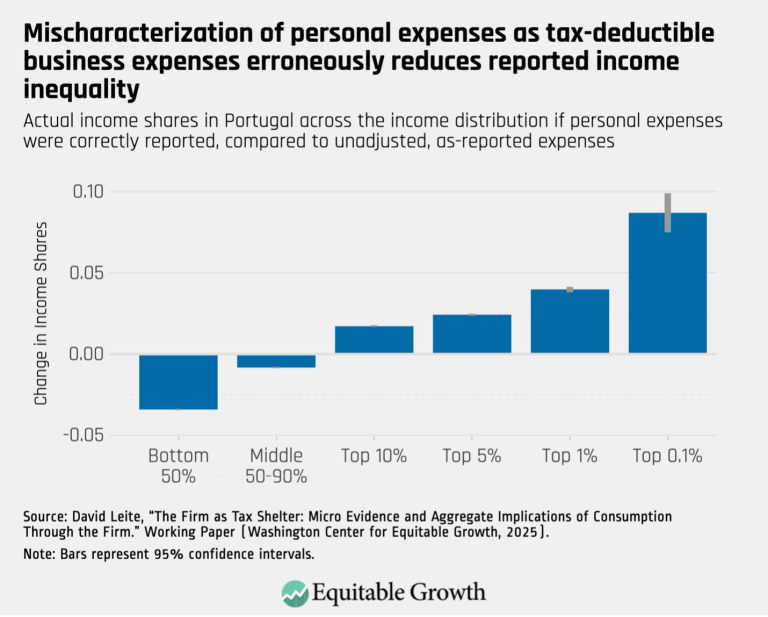
Mischaracterization of personal expenses as tax-deductible business expenses erroneously reduces reported income inequality (opens in a new tab)
Visualizations May 22, 2025
 View Chart
(opens in a new tab)
View Chart
(opens in a new tab)
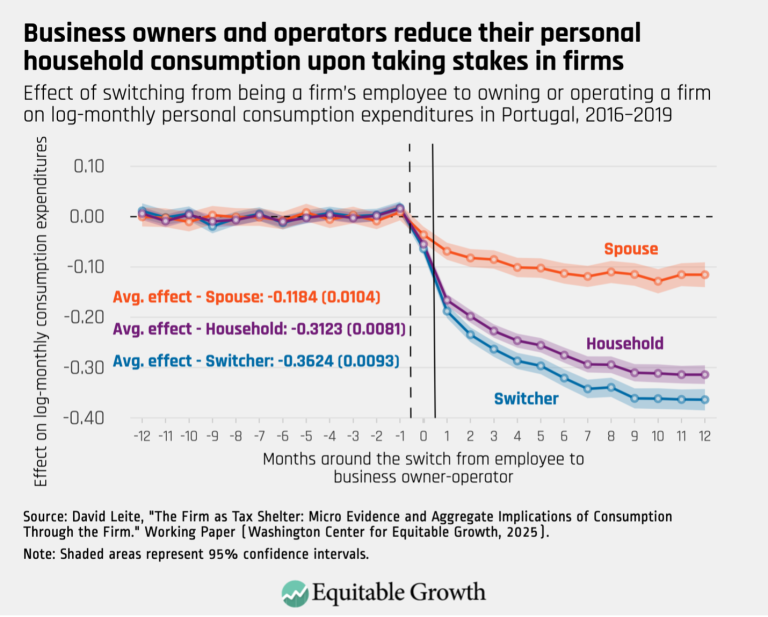
Business owners and operators reduce their personal household consumption upon taking stakes in firms (opens in a new tab)
Visualizations May 21, 2025
 View Chart
(opens in a new tab)
View Chart
(opens in a new tab)
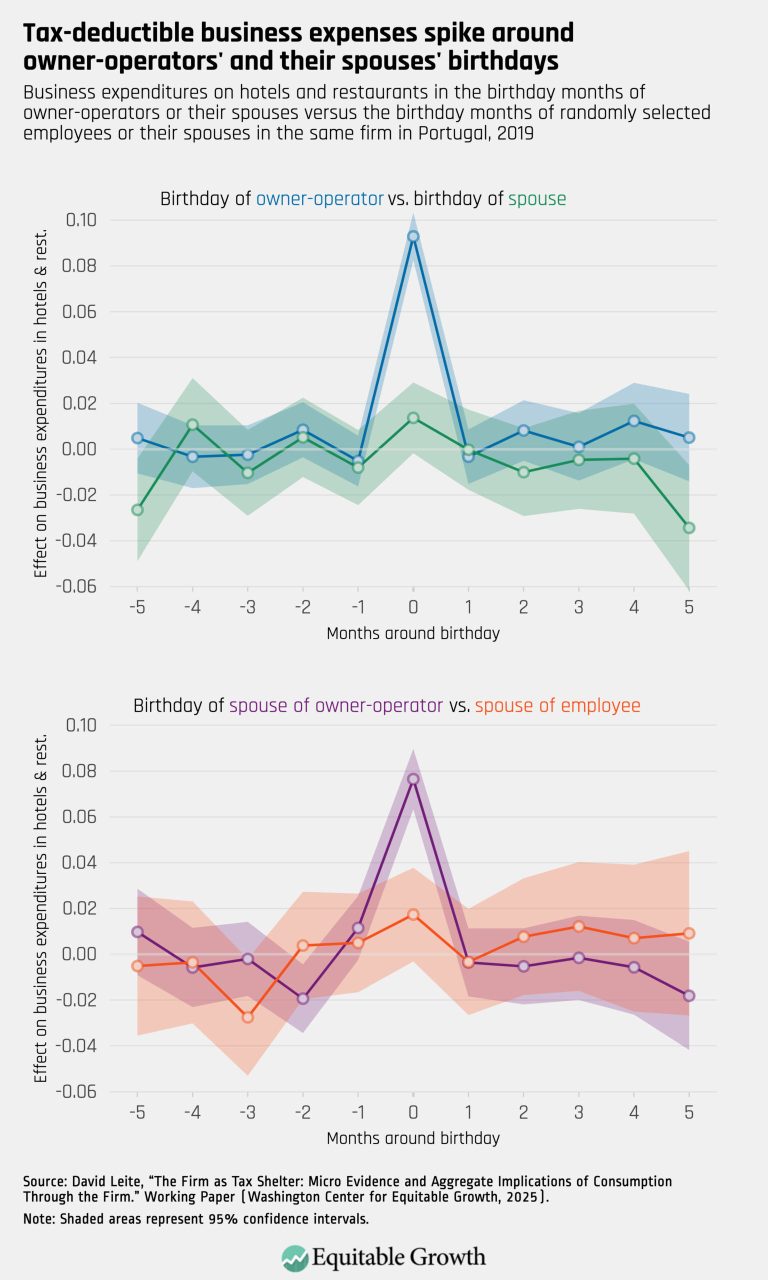
Tax-deductible business expenses spike around owner-operators’ and their spouses’ birthdays (opens in a new tab)
Visualizations May 21, 2025
 View Chart
(opens in a new tab)
View Chart
(opens in a new tab)
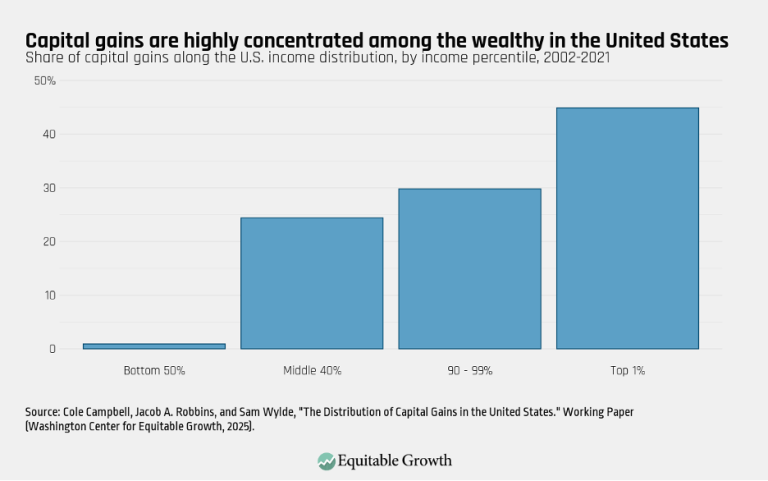
Capital gains are highly concentrated among the wealthy in the United States (opens in a new tab)
Visualizations Feb 26, 2025
 View Chart
(opens in a new tab)
View Chart
(opens in a new tab)
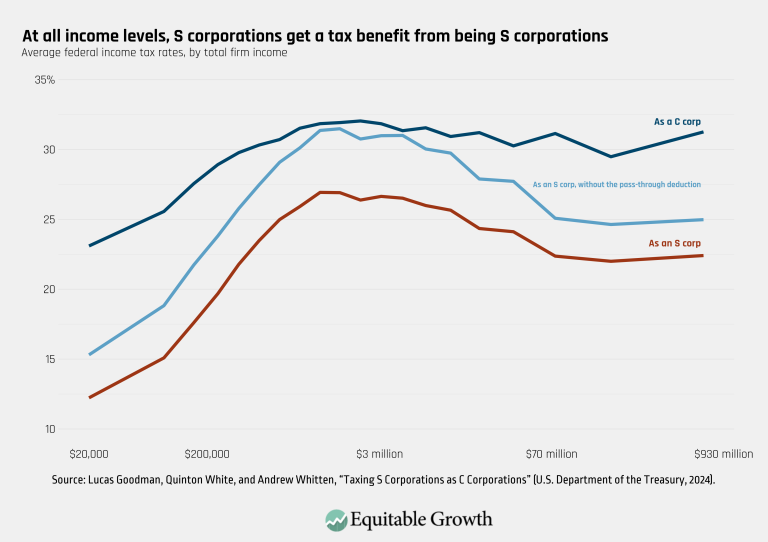
At all income levels, S corporations get a tax benefit from being S corporations (opens in a new tab)
Visualizations Dec 16, 2024
 View Chart
(opens in a new tab)
View Chart
(opens in a new tab)
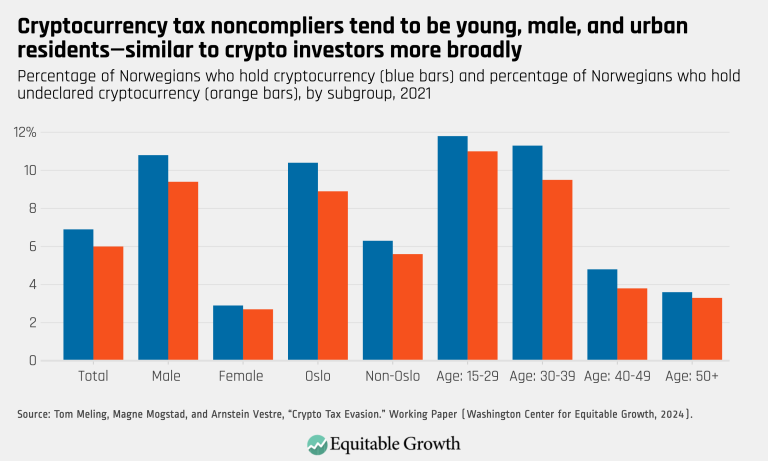
Cryptocurrency tax noncompliers tend to be young, male, and urban residents-similar to crypto investors more broadly (opens in a new tab)
Visualizations Nov 20, 2024
 View Chart
(opens in a new tab)
View Chart
(opens in a new tab)
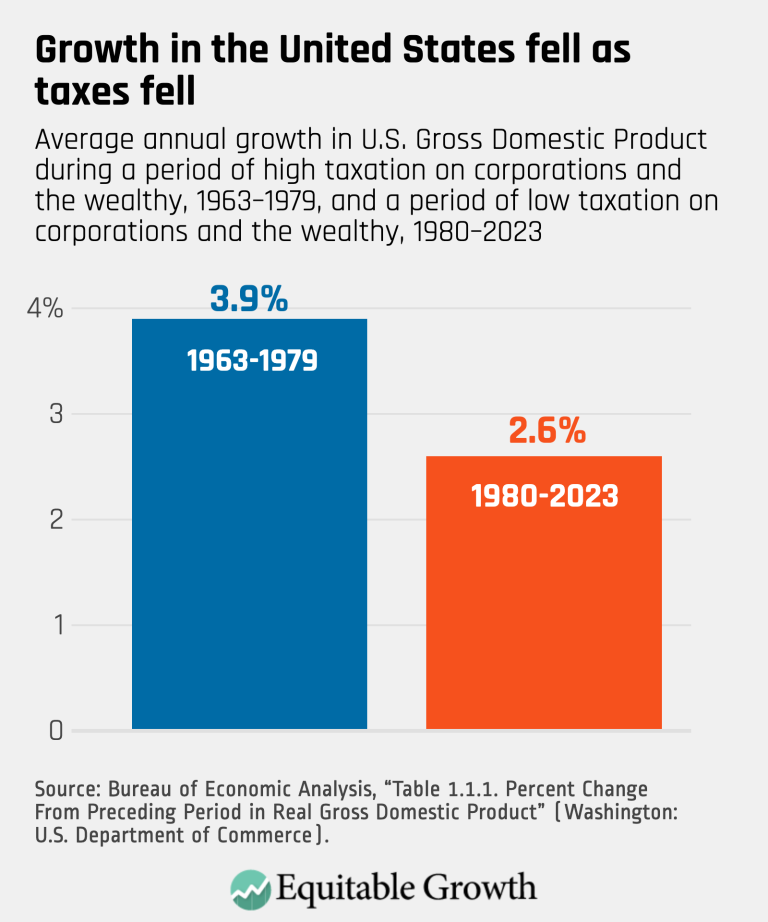
Growth in the United States fell as taxes fell – updated (opens in a new tab)
Visualizations Oct 15, 2024
 View Chart
(opens in a new tab)
View Chart
(opens in a new tab)
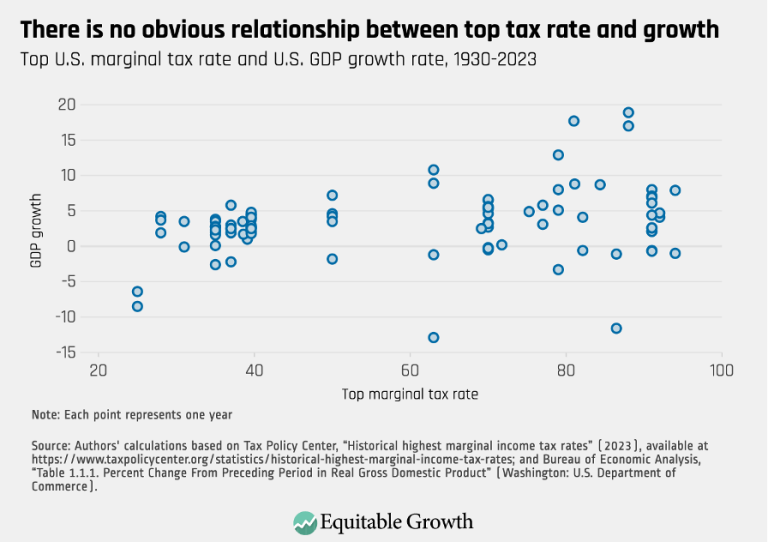
There is no obvious relationship between top tax rate and growth rate (opens in a new tab)
Visualizations Oct 15, 2024
 View Chart
(opens in a new tab)
View Chart
(opens in a new tab)
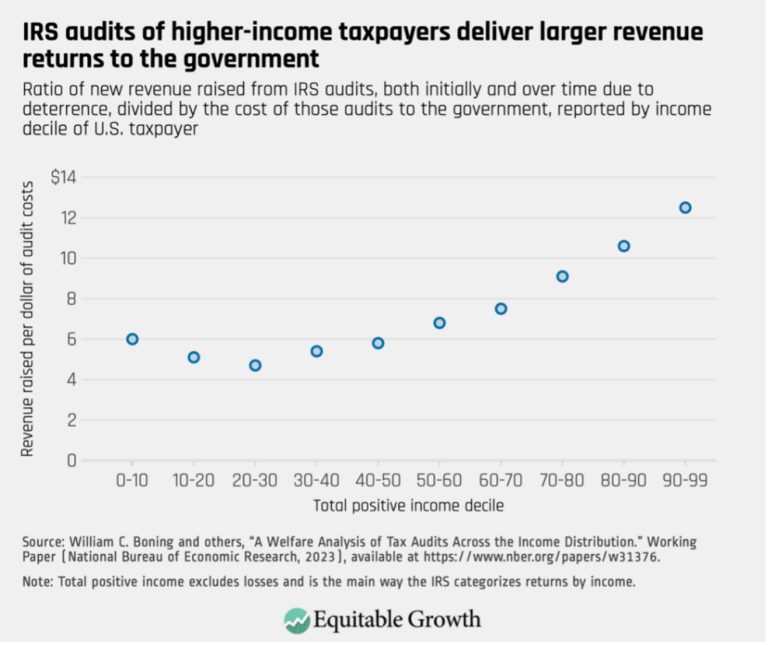
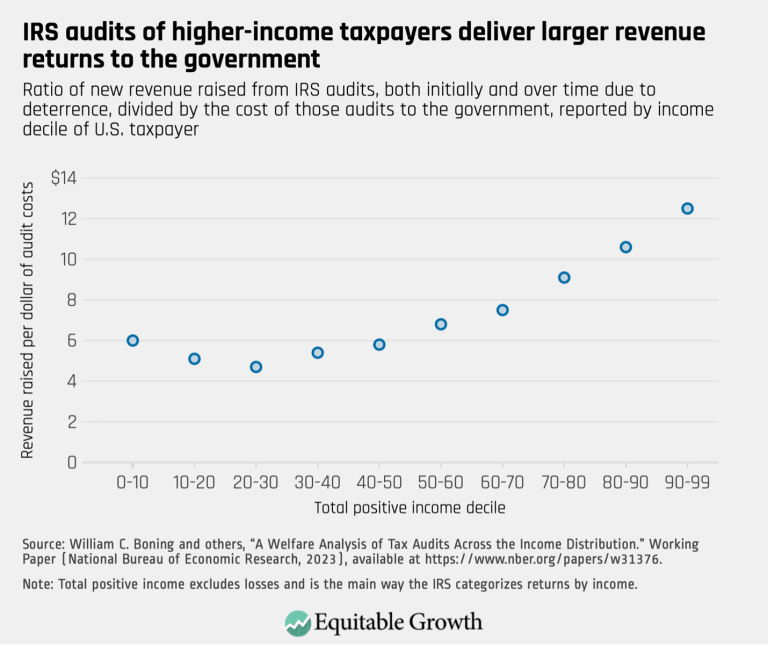
IRS audits of higher-income taxpayers deliver larger revenue returns to the government (opens in a new tab)
Visualizations Oct 15, 2024
 View Chart
(opens in a new tab)
View Chart
(opens in a new tab)
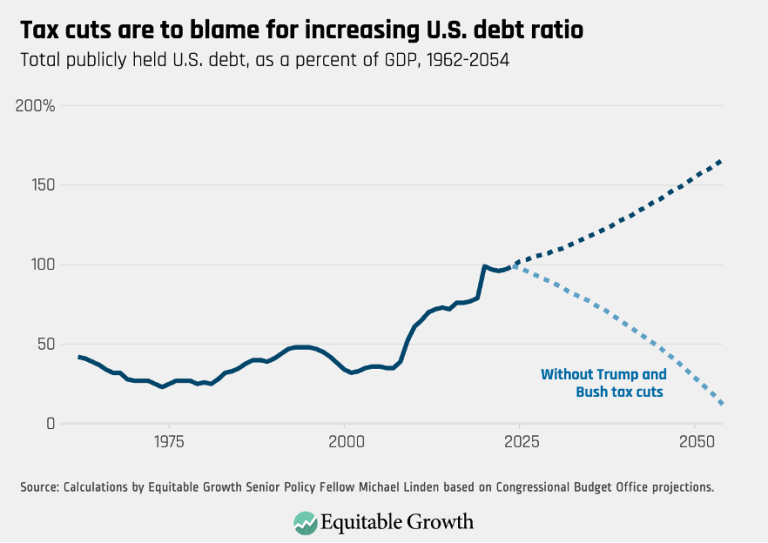
Tax cuts are to blame for increasing U.S. debt ratio (opens in a new tab)
Visualizations Oct 15, 2024
 View Chart
(opens in a new tab)
View Chart
(opens in a new tab)
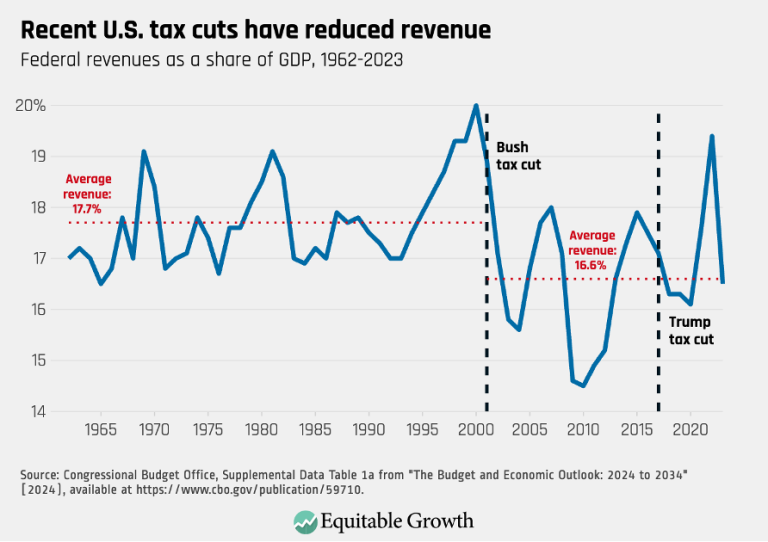
Recent U.S. tax cuts have reduced revenue (opens in a new tab)
Visualizations Oct 15, 2024
 View Chart
(opens in a new tab)
View Chart
(opens in a new tab)
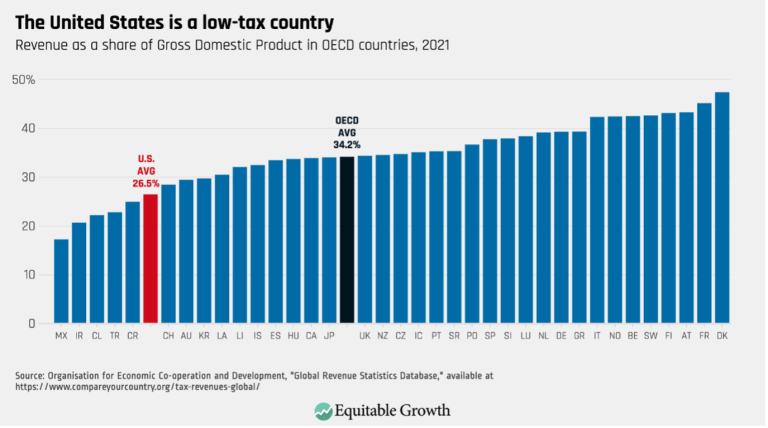
The United States is a low-tax country (opens in a new tab)
Visualizations Oct 15, 2024
 View Chart
(opens in a new tab)
View Chart
(opens in a new tab)
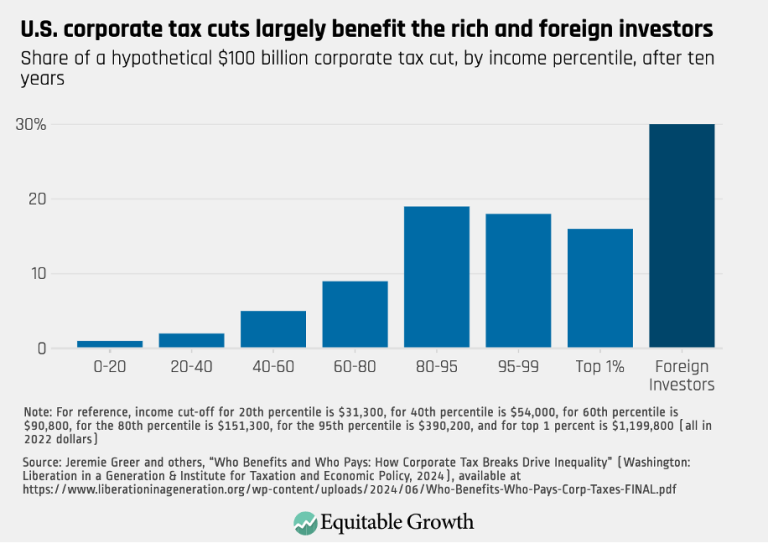
U.S. corporate tax cuts largely benefit the rich and foreign investors (opens in a new tab)
Visualizations Oct 15, 2024
 View Chart
(opens in a new tab)
View Chart
(opens in a new tab)
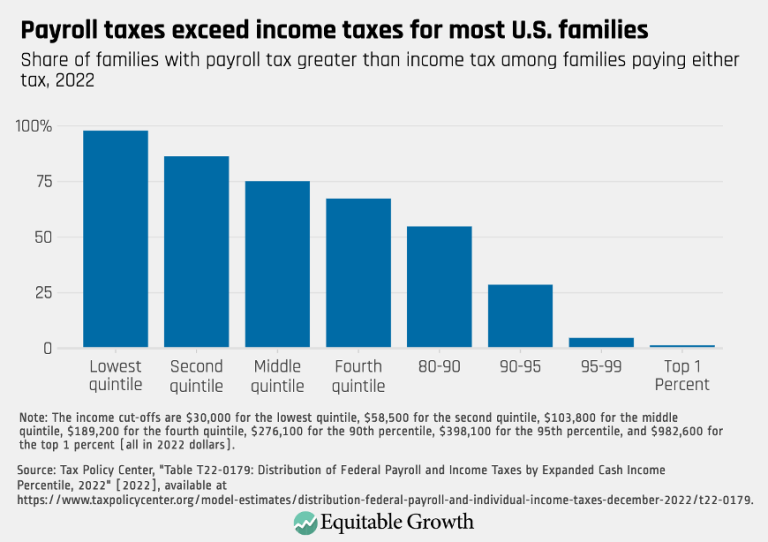
Payroll taxes exceed income taxes for most U.S. families (opens in a new tab)
Visualizations Oct 15, 2024
 View Chart
(opens in a new tab)
View Chart
(opens in a new tab)
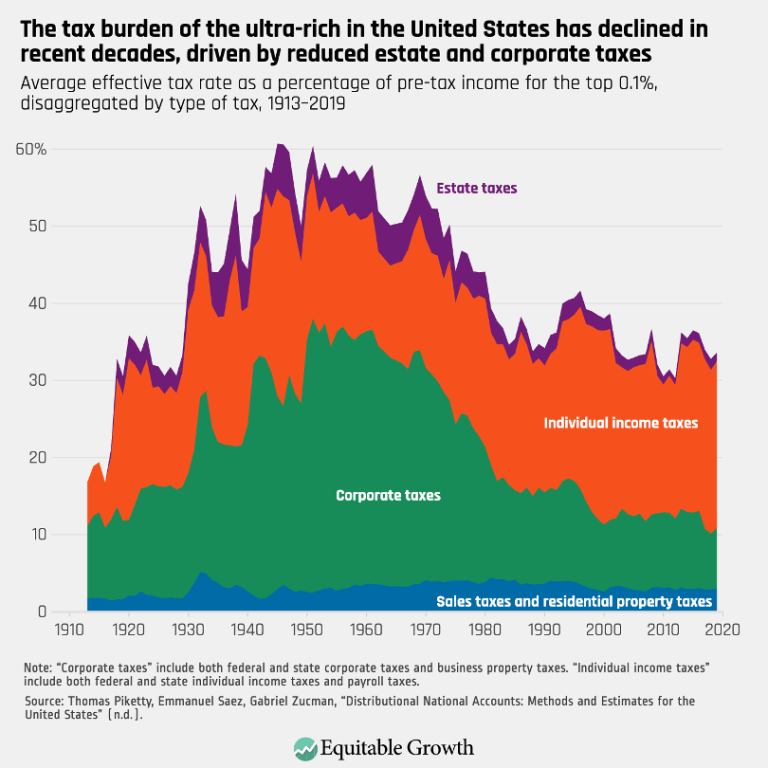
The Tax burden of the ultra-rich in the United States has declined in recent decades, driven by reduced estate and corporate taxes (opens in a new tab)
Visualizations Oct 15, 2024
 View Chart
(opens in a new tab)
View Chart
(opens in a new tab)
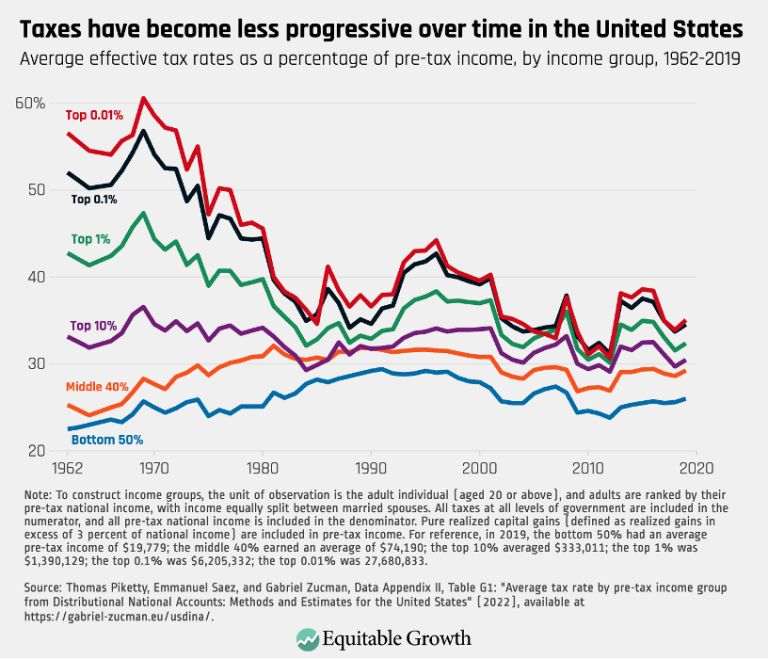
Taxes have become less progressive over time in the United States (opens in a new tab)
Visualizations Oct 15, 2024
 View Chart
(opens in a new tab)
View Chart
(opens in a new tab)
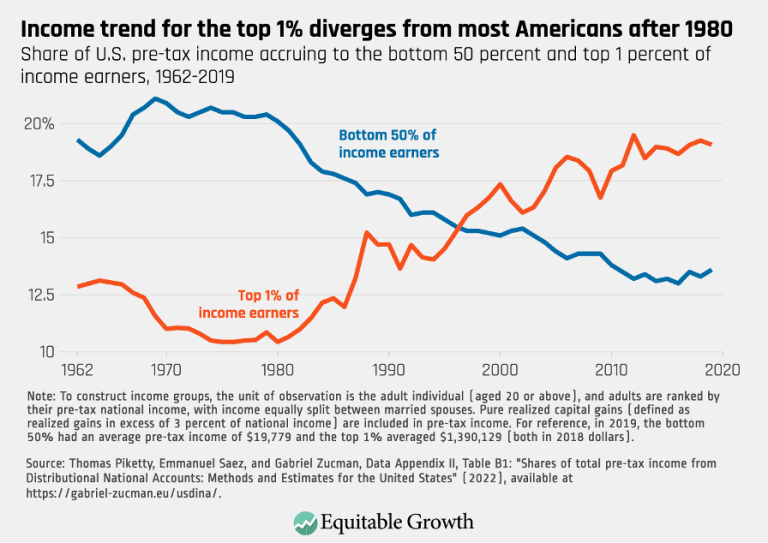
Income trend for the top 1% diverges from most Americans after 1980 (opens in a new tab)
Visualizations Oct 15, 2024
 View Chart
(opens in a new tab)
View Chart
(opens in a new tab)
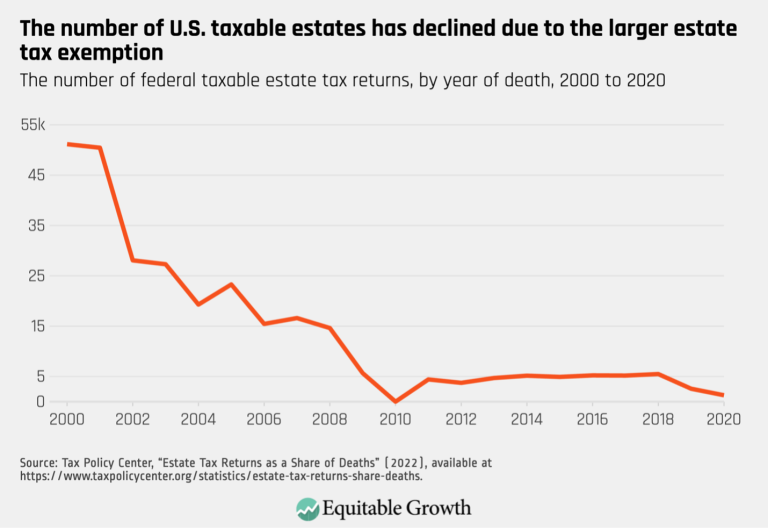
The number of U.S. taxable estates has declined due to the larger estate tax exemption (opens in a new tab)
Visualizations Oct 8, 2024
 View Chart
(opens in a new tab)
View Chart
(opens in a new tab)
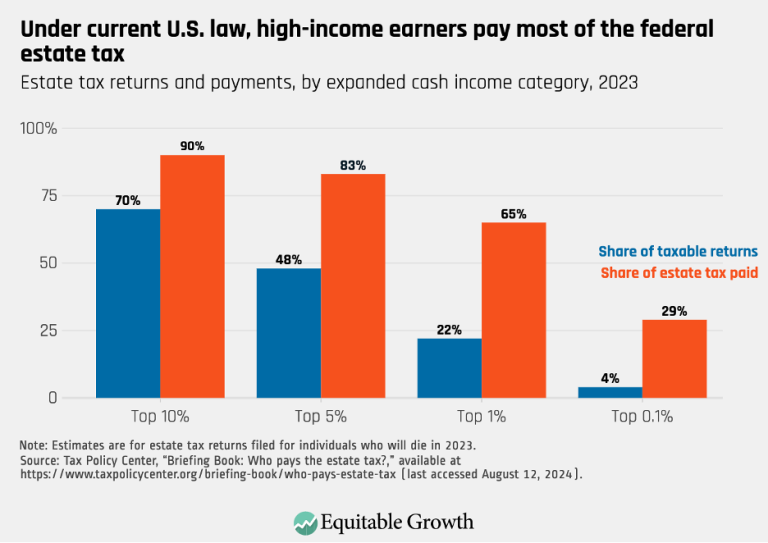
Under current U.S. law, high-income earners pay most of the federal estate tax (opens in a new tab)
Visualizations Oct 8, 2024
 View Chart
(opens in a new tab)
View Chart
(opens in a new tab)
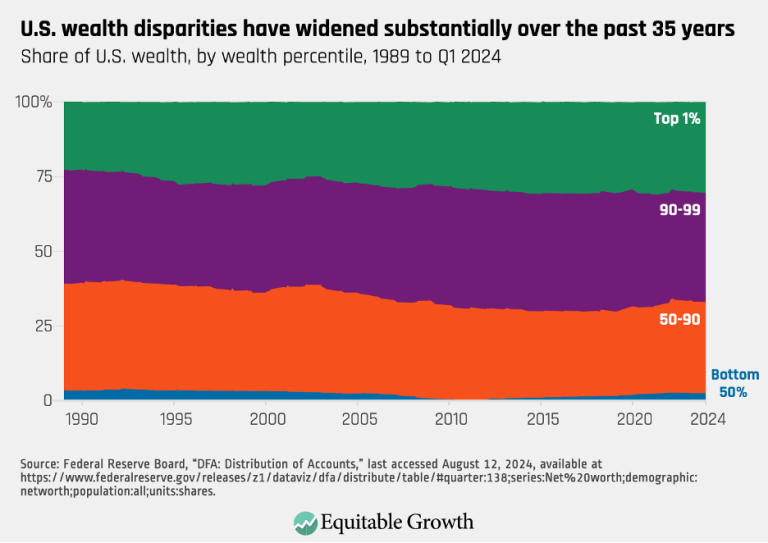
U.S. wealth disparities have widened substantially over the past 35 years (opens in a new tab)
Visualizations Oct 8, 2024
 View Chart
(opens in a new tab)
View Chart
(opens in a new tab)
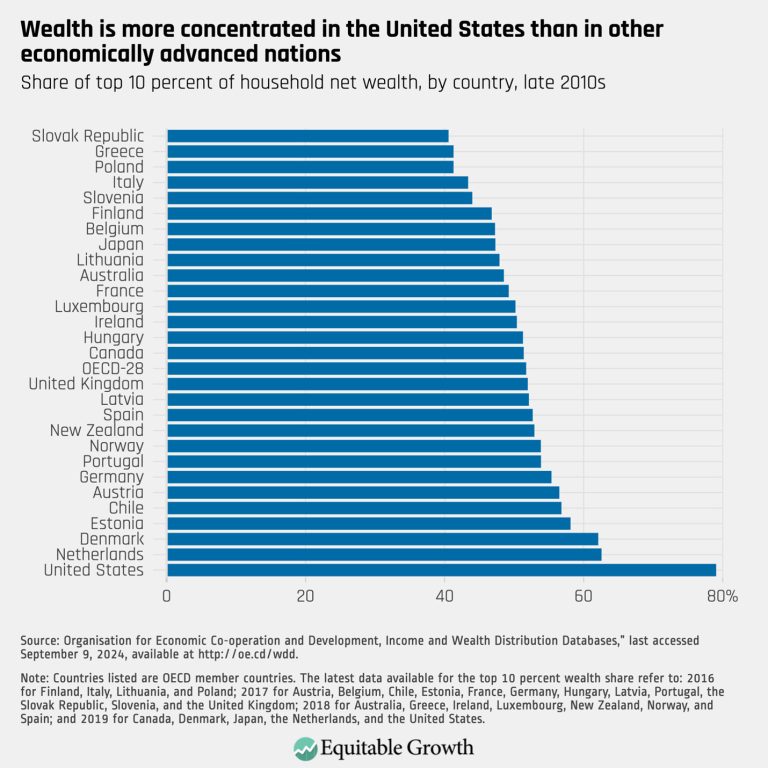
Wealth is more concentrated in the United States than in other economically advanced nations (opens in a new tab)
Visualizations Oct 8, 2024
 View Chart
(opens in a new tab)
View Chart
(opens in a new tab)
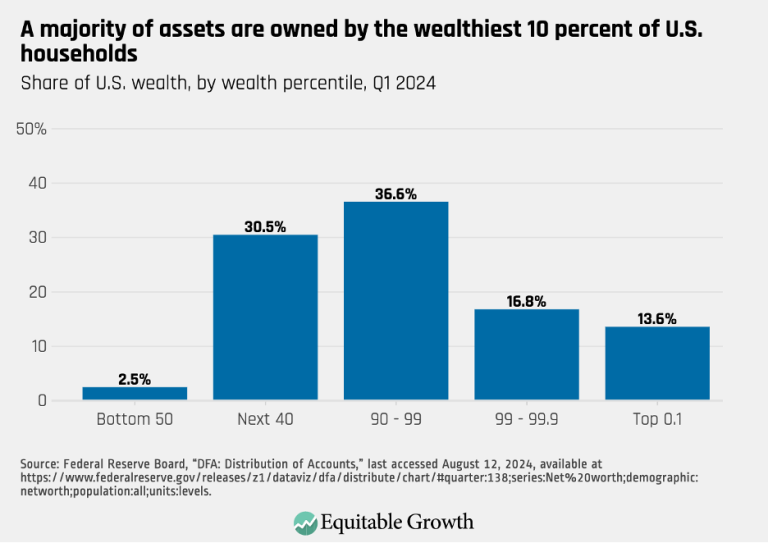
A majority of assets are owned by the wealthiest 10 percent of U.S. households (opens in a new tab)
Visualizations Oct 8, 2024
 View Chart
(opens in a new tab)
View Chart
(opens in a new tab)
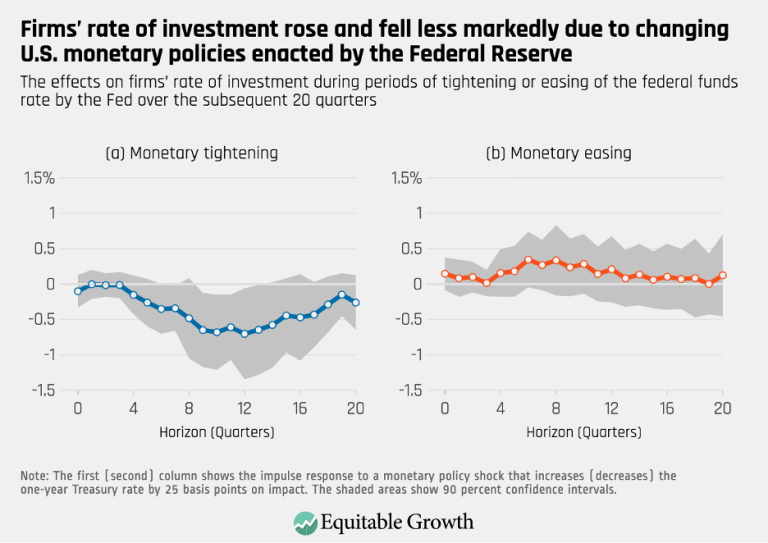
Firms’ rate of investment rose and fell less markedly due to changing U.S. monetary policies enacted by the Federal Reserve (opens in a new tab)
Visualizations Sep 15, 2024
 View Chart
(opens in a new tab)
View Chart
(opens in a new tab)
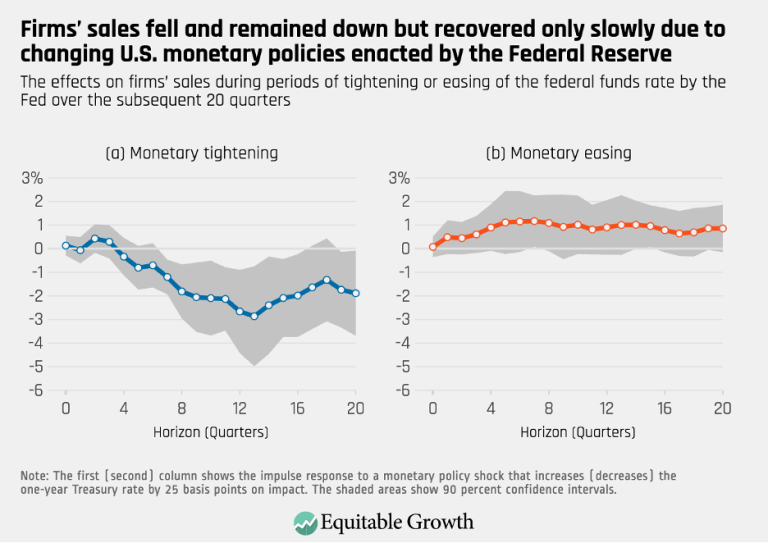
Firms’ sales fell and remained down but recovered only slowly due to changing U.S. monetary policies enacted by the Federal Reserve (opens in a new tab)
Visualizations Sep 15, 2024
 View Chart
(opens in a new tab)
View Chart
(opens in a new tab)
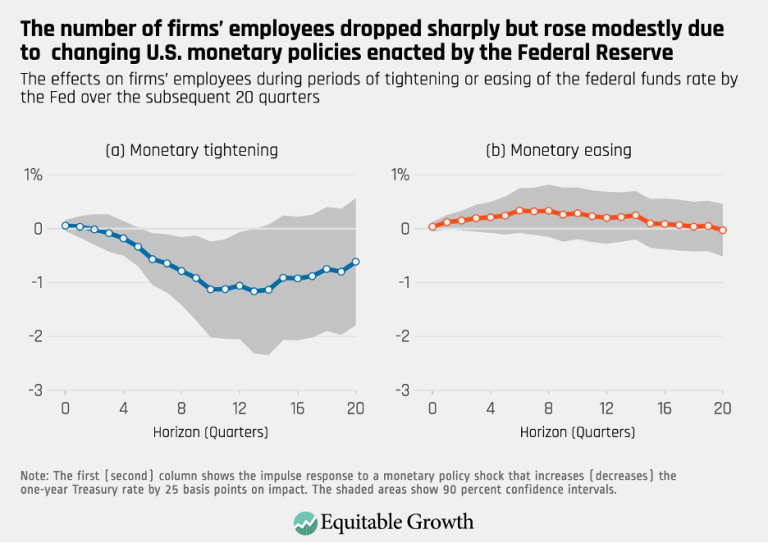
The number of firms’ employees dropped sharply but rose modestly due to changing U.S. monetary policies enacted by the Federal Reserve (opens in a new tab)
Visualizations Sep 15, 2024
 View Chart
(opens in a new tab)
View Chart
(opens in a new tab)
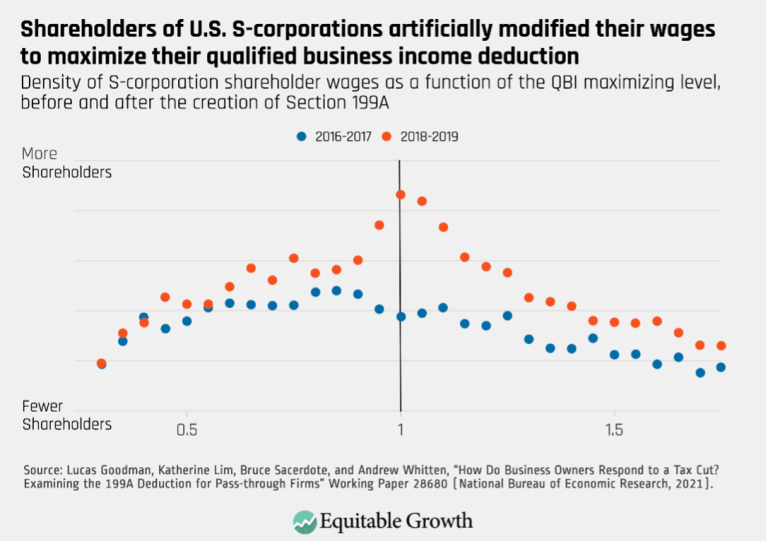
Shareholders of U.S. S-corporations artificially modified their wages to maximize their qualified business income deduction (opens in a new tab)
Visualizations Apr 30, 2024
 View Chart
(opens in a new tab)
View Chart
(opens in a new tab)
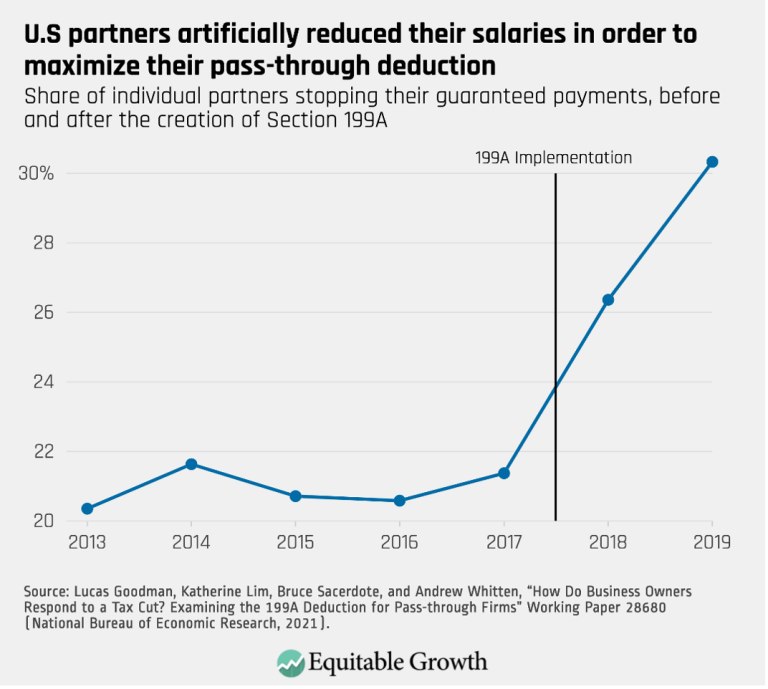
U.S. partners artificially reduced their salaries in order to maximize their pass-through deduction (opens in a new tab)
Visualizations Apr 30, 2024
 View Chart
(opens in a new tab)
View Chart
(opens in a new tab)
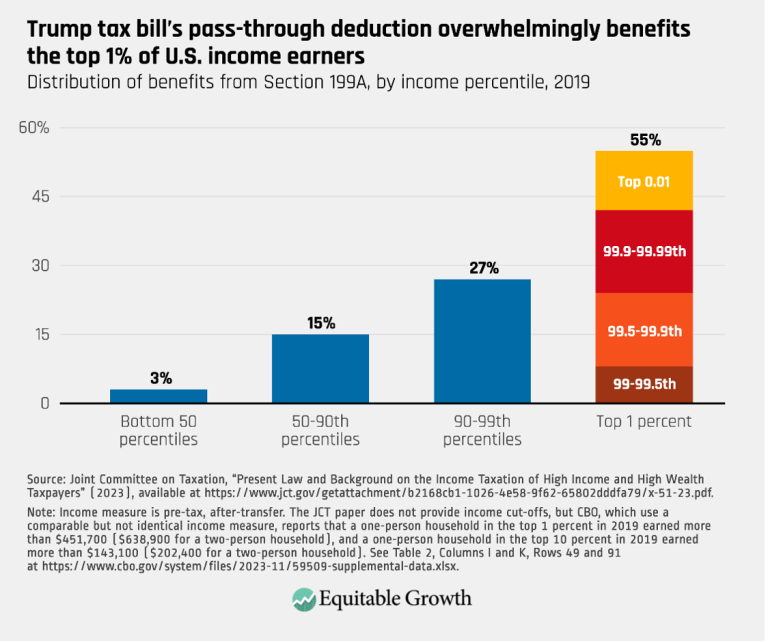
Trump tax bill’s pass-through deduction overwhelmingly benefits the top 1% of U.S. income earners (opens in a new tab)
Visualizations Apr 30, 2024
 View Chart
(opens in a new tab)
View Chart
(opens in a new tab)
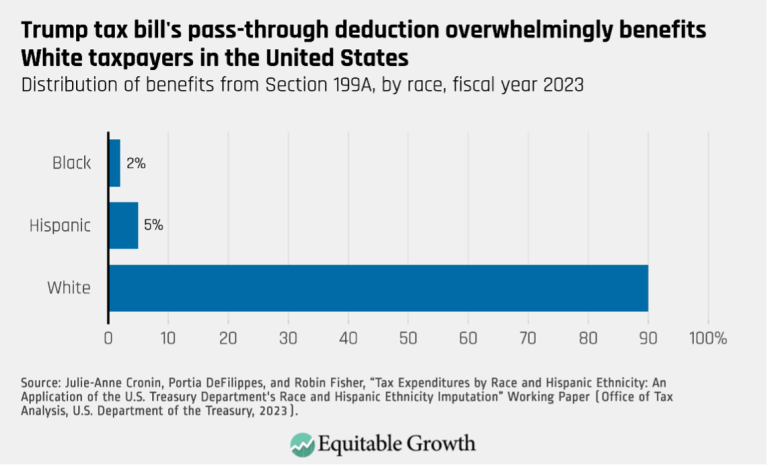
Trump tax bill’s pass-through deduction overwhelmingly benefits White taxpayers in the United States (opens in a new tab)
Visualizations Apr 30, 2024
 View Chart
(opens in a new tab)
View Chart
(opens in a new tab)
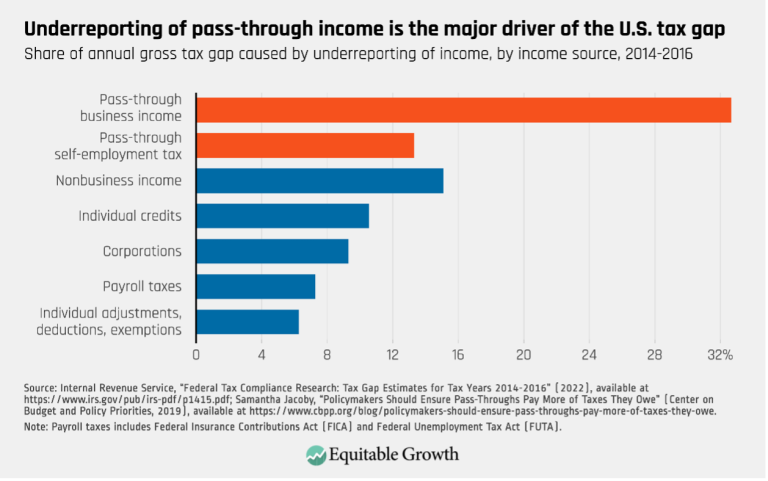
Underreporting of pass-through income is the major driver of the U.S. tax gap (opens in a new tab)
Visualizations Apr 30, 2024
 View Chart
(opens in a new tab)
View Chart
(opens in a new tab)
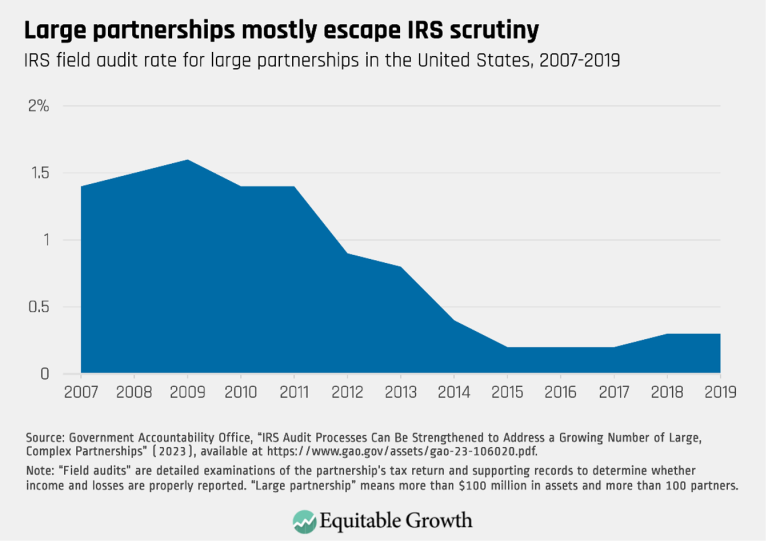
Large partnerships mostly escape IRS scrutiny (opens in a new tab)
Visualizations Apr 30, 2024
 View Chart
(opens in a new tab)
View Chart
(opens in a new tab)
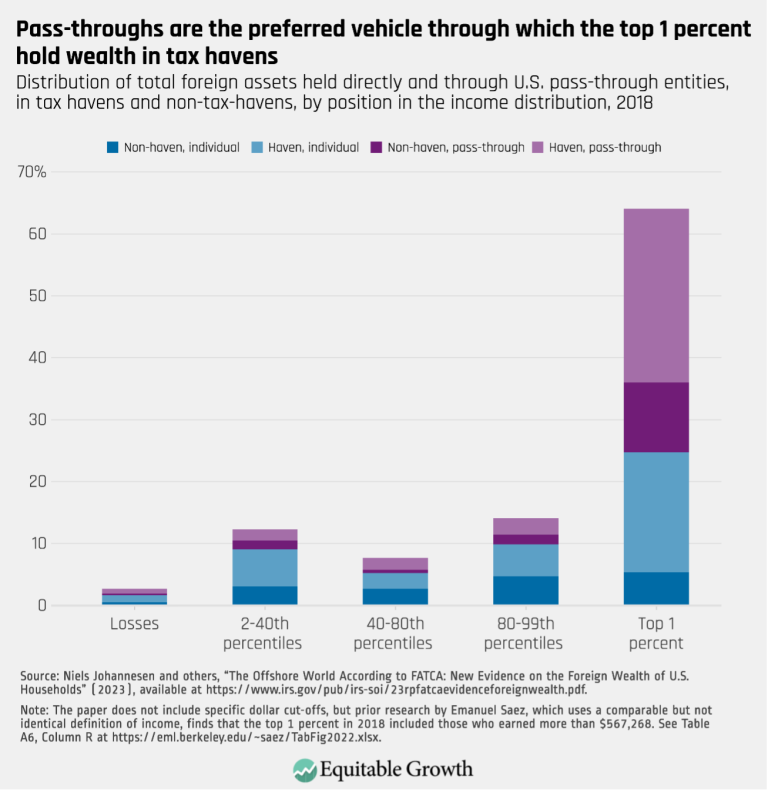
Pass-throughs are the preferred vehicle through which the top 1 percent hold wealth in tax havens (opens in a new tab)
Visualizations Apr 30, 2024
 View Chart
(opens in a new tab)
View Chart
(opens in a new tab)
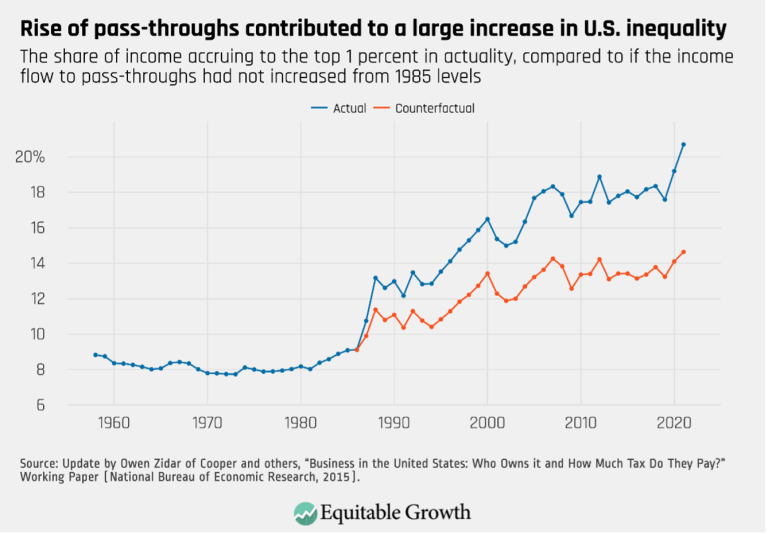
Rise of pass-throughs contributed to a large increase in U.S. inequality (opens in a new tab)
Visualizations Apr 30, 2024
 View Chart
(opens in a new tab)
View Chart
(opens in a new tab)
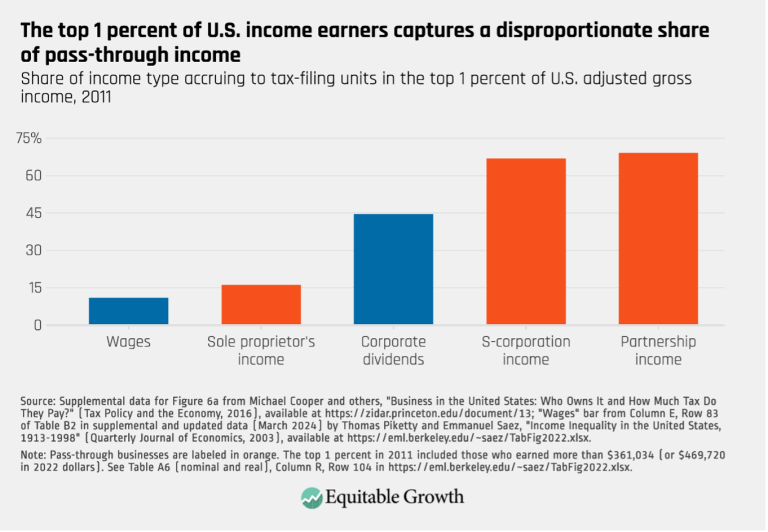
The top 1 percent of U.S. income earners captures a disproportionate share of pas-through income (opens in a new tab)
Visualizations Apr 29, 2024
 View Chart
(opens in a new tab)
View Chart
(opens in a new tab)
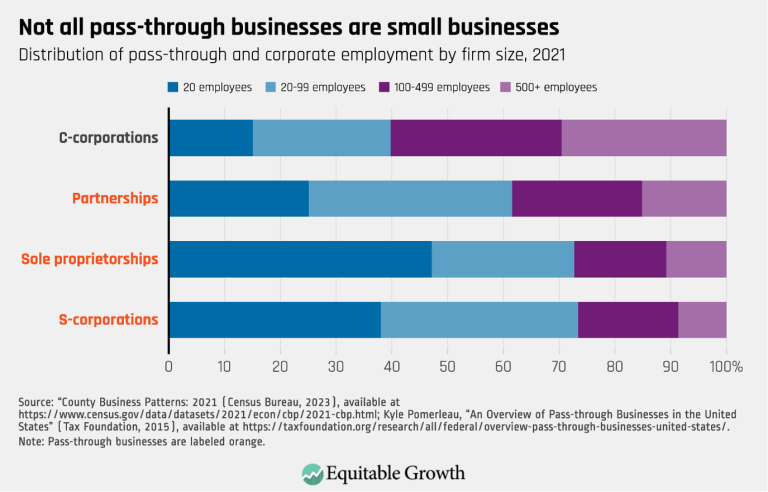
Not all pass-through businesses are small businesses (opens in a new tab)
Visualizations Apr 29, 2024
 View Chart
(opens in a new tab)
View Chart
(opens in a new tab)
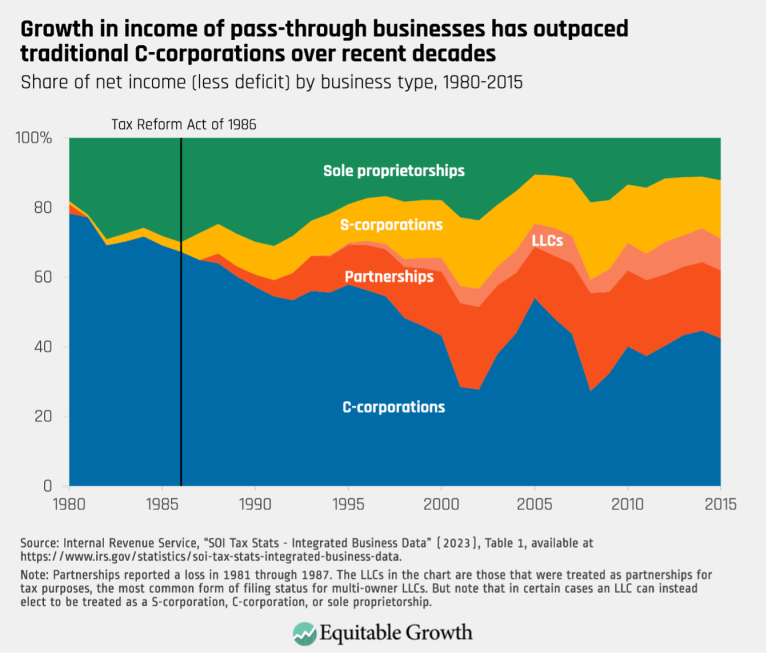
Growth in income of pass-through businesses has outpaced traditional C-corporations over recent decades (opens in a new tab)
Visualizations Apr 29, 2024
 View Chart
(opens in a new tab)
View Chart
(opens in a new tab)
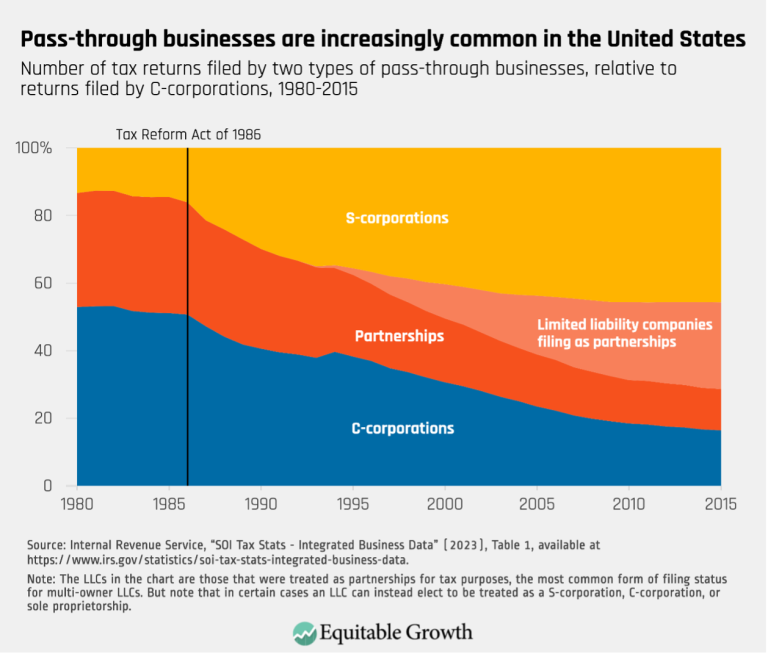
Pass-through businesses are increasingly common in the United States (opens in a new tab)
Visualizations Apr 29, 2024
 View Chart
(opens in a new tab)
View Chart
(opens in a new tab)
IRS audits of higher-income taxpayers deliver larger revenue returns to the government (opens in a new tab)
Visualizations Jan 9, 2024
 View Chart
(opens in a new tab)
View Chart
(opens in a new tab)
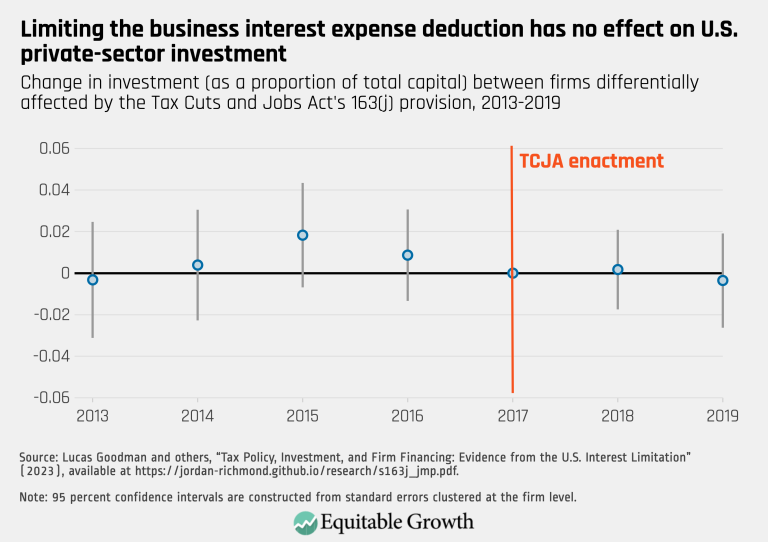
Investment Rate EG Graph 04 (opens in a new tab)
Visualizations Nov 20, 2023
 View Chart
(opens in a new tab)
View Chart
(opens in a new tab)
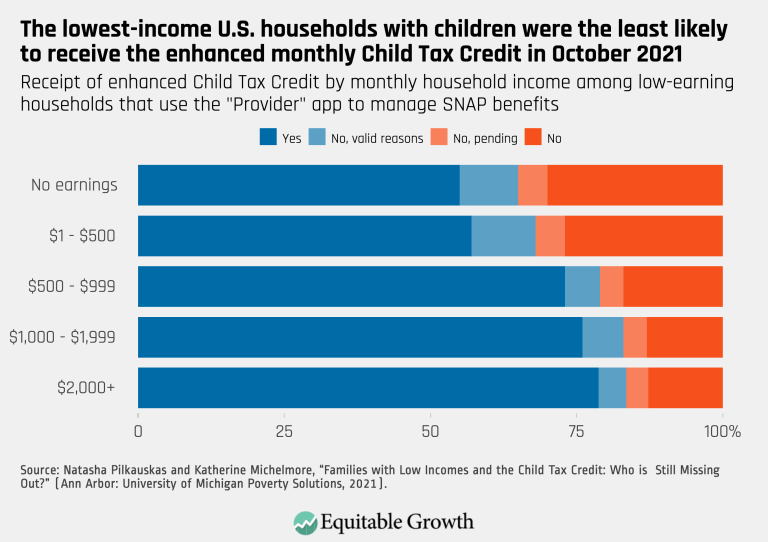
The lowest-income U.S. households with children were the least likely to receive the enhanced monthly Child Tax Credit in October 2021 (opens in a new tab)
Visualizations Nov 28, 2022
 View Chart
(opens in a new tab)
View Chart
(opens in a new tab)
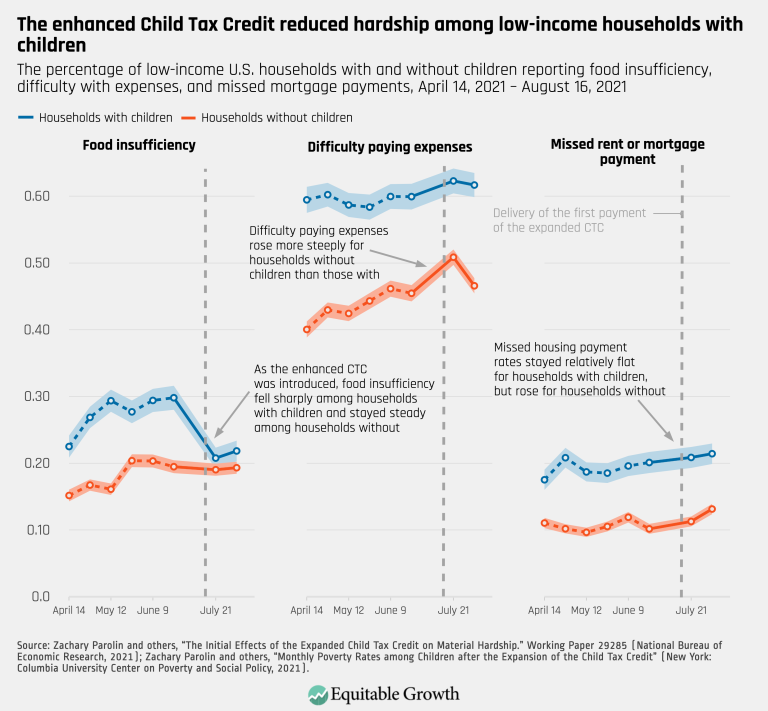
The enhanced Child Tax Credit reduced hardship among low-income households with children (opens in a new tab)
Visualizations Nov 28, 2022
 View Chart
(opens in a new tab)
View Chart
(opens in a new tab)
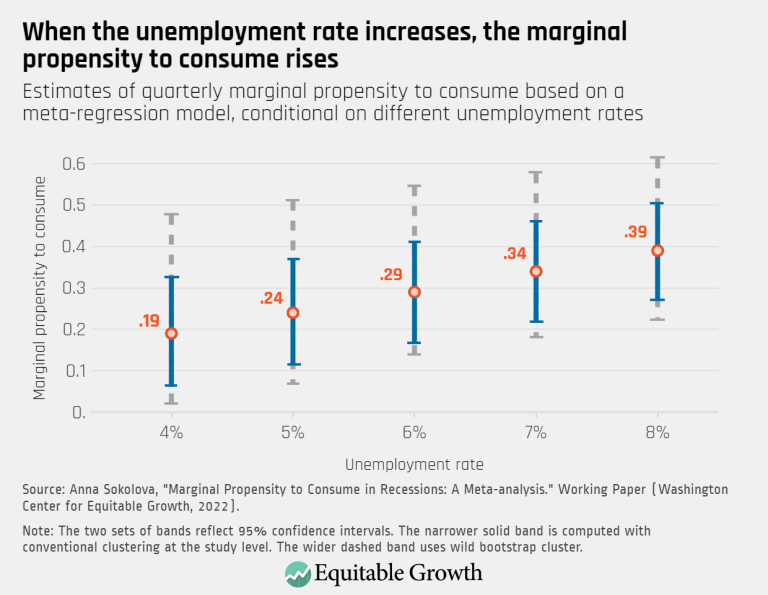
When the unemployment rate increases, the marginal propensity to consume rises (opens in a new tab)
Visualizations Sep 8, 2022
 View Chart
(opens in a new tab)
View Chart
(opens in a new tab)
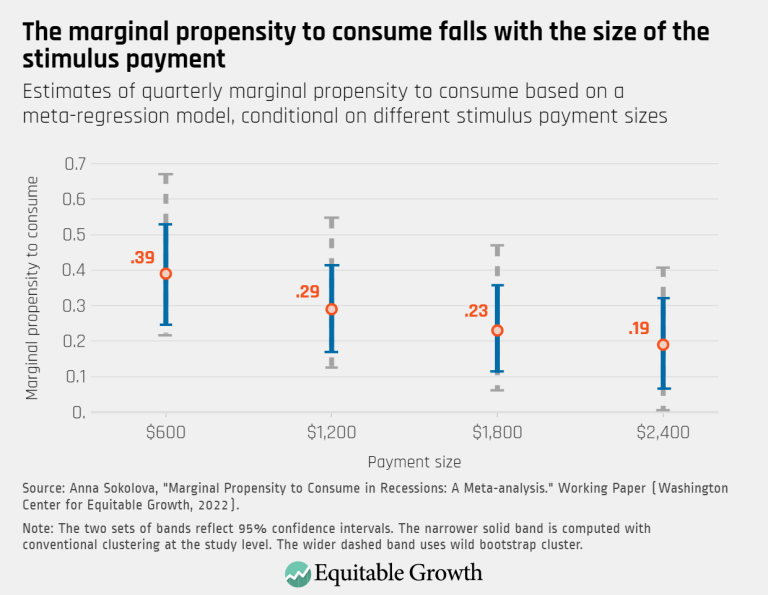
The marginal propensity to consume falls with the size of the stimulus payment (opens in a new tab)
Visualizations Sep 8, 2022
 View Chart
(opens in a new tab)
View Chart
(opens in a new tab)
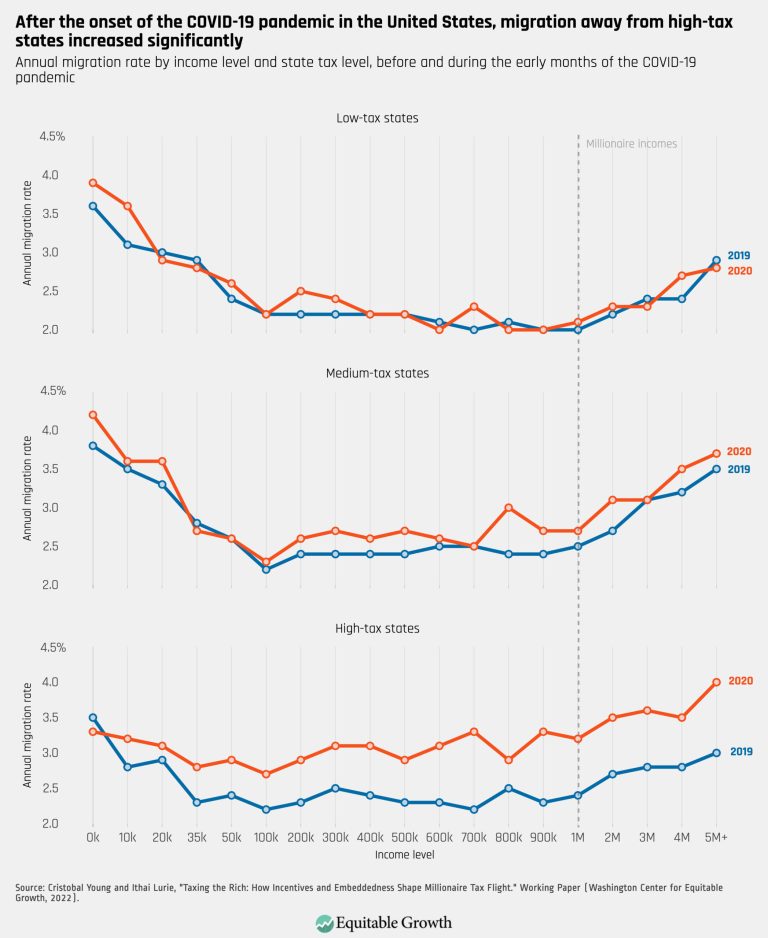
After the onset of the COVID-19 pandemic in the United States, migration away from high-tax states increased significantly – updated (opens in a new tab)
Visualizations Jul 28, 2022
 View Chart
(opens in a new tab)
View Chart
(opens in a new tab)
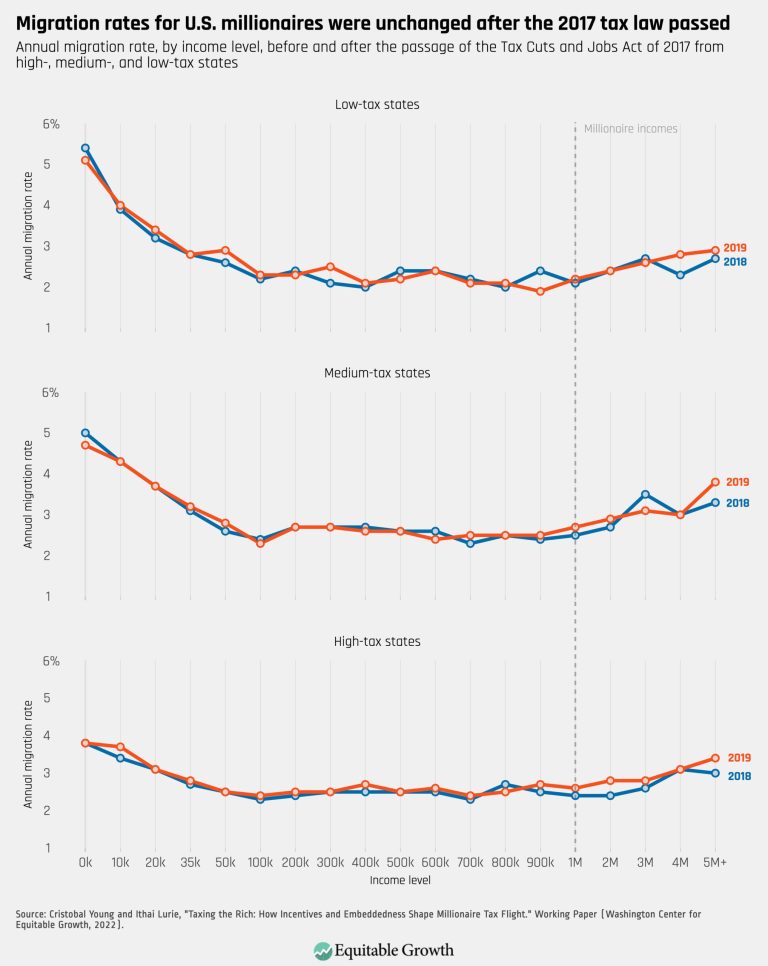
Migration rates for U.S. millionaires were unchanged after the 2017 tax law passed (opens in a new tab)
Visualizations Jul 28, 2022
 View Chart
(opens in a new tab)
View Chart
(opens in a new tab)
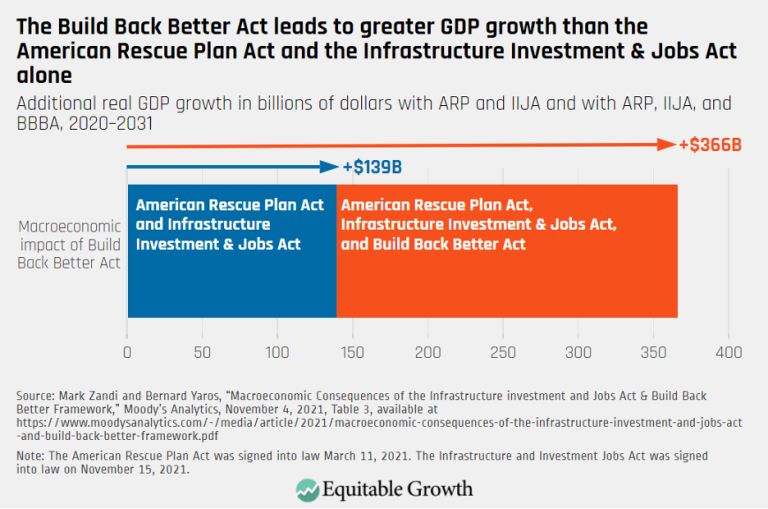
The Build Back Better Act leads to greater GDP growth than the American Rescue Plan Act and the Infrastructure Investment & Jobs Act alone (opens in a new tab)
Visualizations Nov 24, 2021
 View Chart
(opens in a new tab)
View Chart
(opens in a new tab)
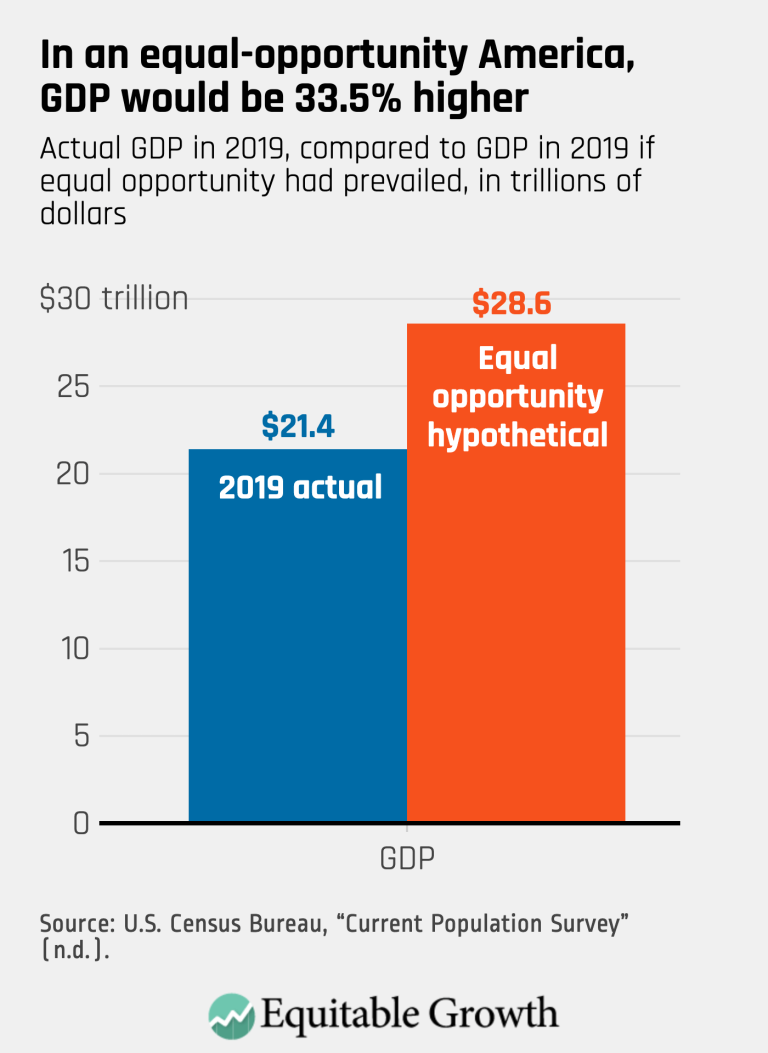
In an equal-opportunity America, GDP would be 33.5% higher (opens in a new tab)
Visualizations Jul 2, 2021
 View Chart
(opens in a new tab)
View Chart
(opens in a new tab)
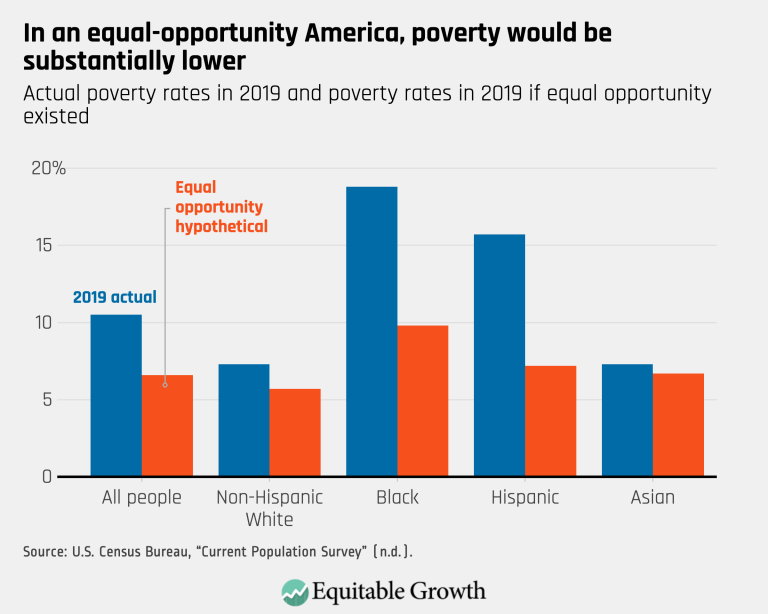
In an equal-opportunity America, poverty would be substantially lower (opens in a new tab)
Visualizations Jul 2, 2021
 View Chart
(opens in a new tab)
View Chart
(opens in a new tab)
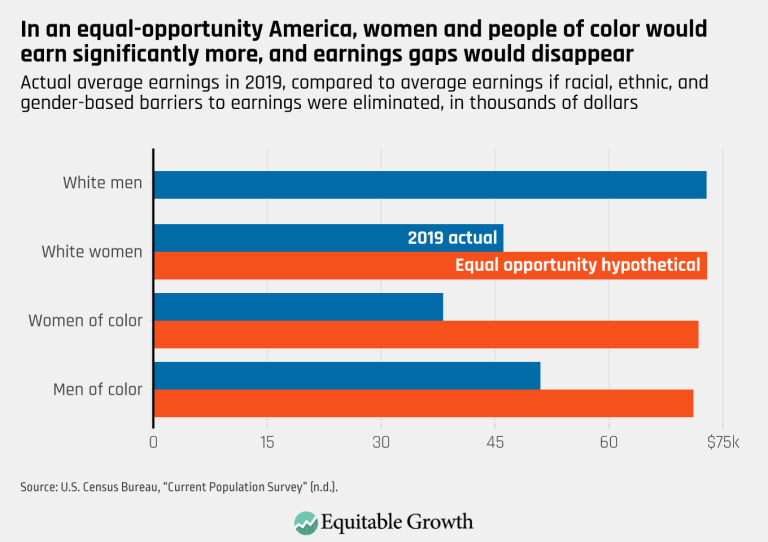
In an equal-opportunity America, women and people of color would earn significantly more, and earnings gaps would disappear (opens in a new tab)
Visualizations Jul 2, 2021
 View Chart
(opens in a new tab)
View Chart
(opens in a new tab)
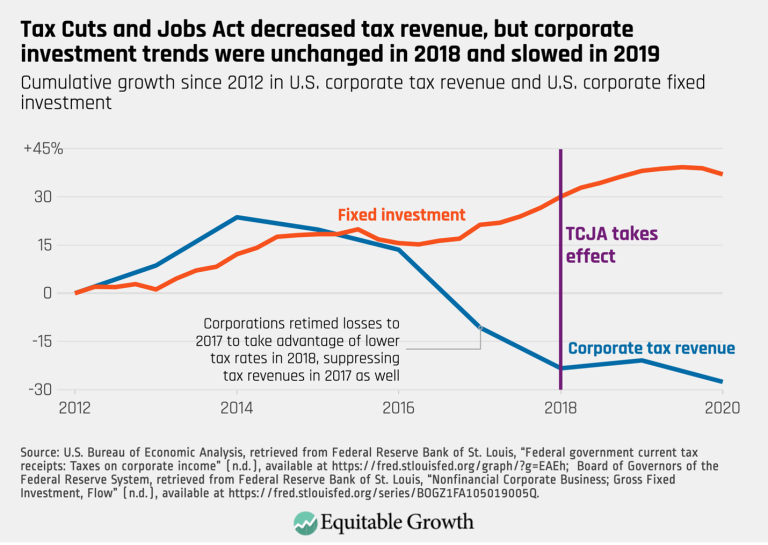
Tax Cuts and Jobs Act decreased tax revenue, but corporate investment trends were unchanged in 2018 and slowed in 2019 (opens in a new tab)
Visualizations Jun 28, 2021
 View Chart
(opens in a new tab)
View Chart
(opens in a new tab)
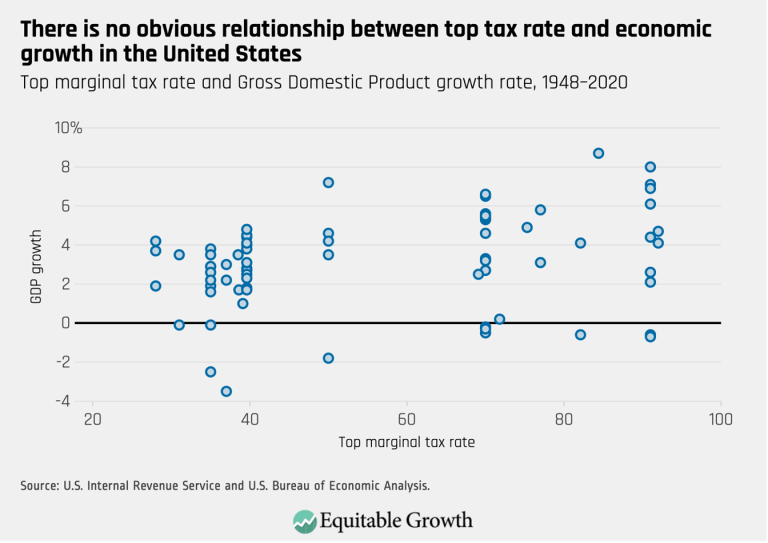
There is no obvious relationship between top tax rate and economic growth in the United States (opens in a new tab)
Visualizations Jun 28, 2021
 View Chart
(opens in a new tab)
View Chart
(opens in a new tab)
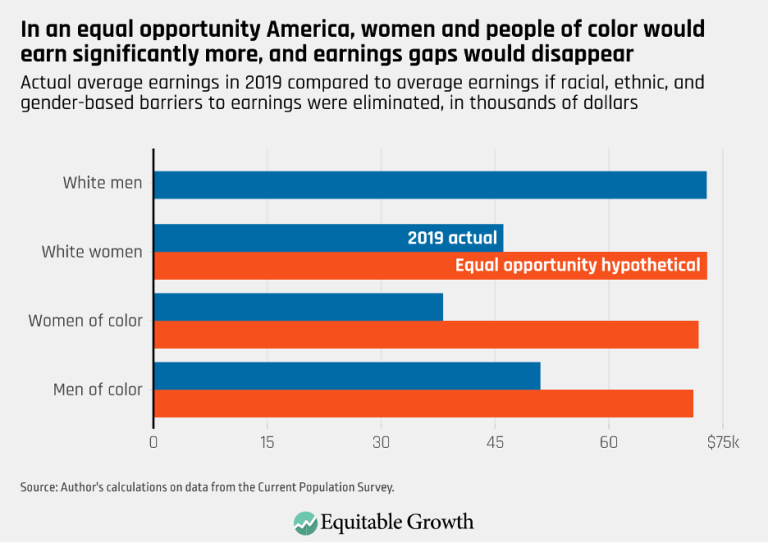
In an equal opportunity America, women and people of color would earn significantly more, and earnings gaps would disappear (opens in a new tab)
Visualizations Jun 7, 2021
 View Chart
(opens in a new tab)
View Chart
(opens in a new tab)
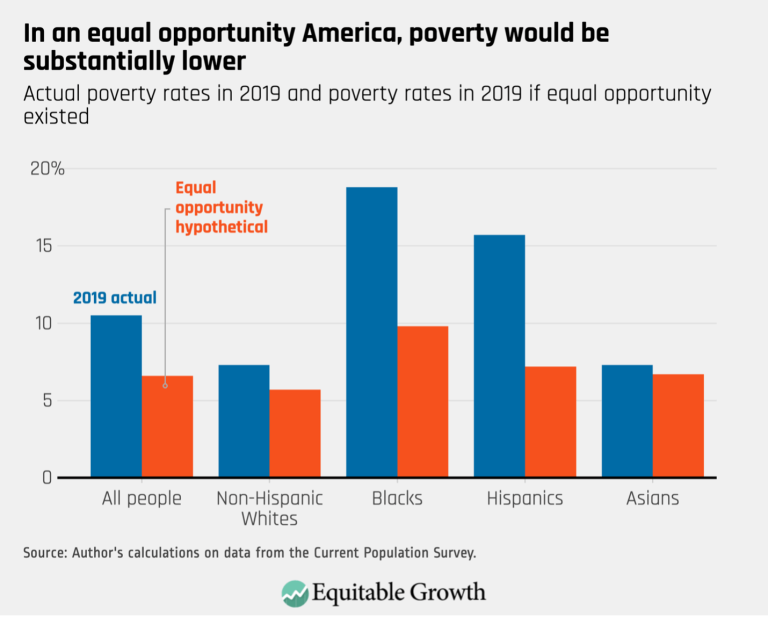
In an equal opportunity America, poverty would be substantially lower (opens in a new tab)
Visualizations Jun 7, 2021
 View Chart
(opens in a new tab)
View Chart
(opens in a new tab)
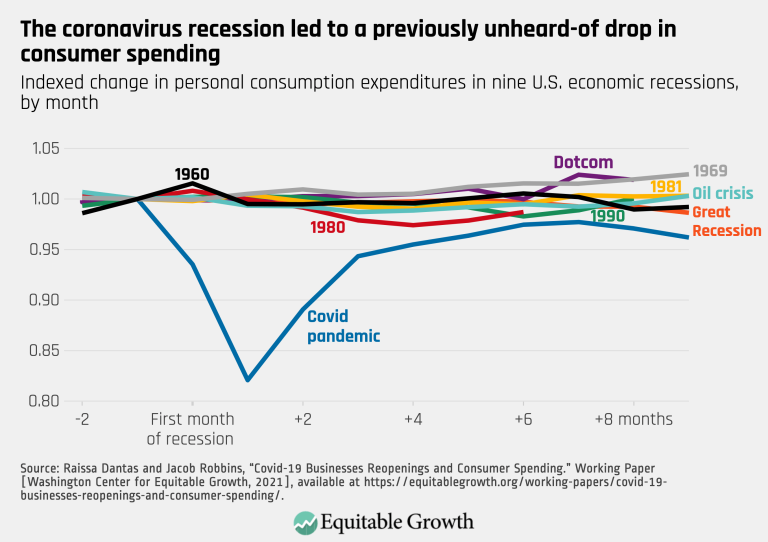
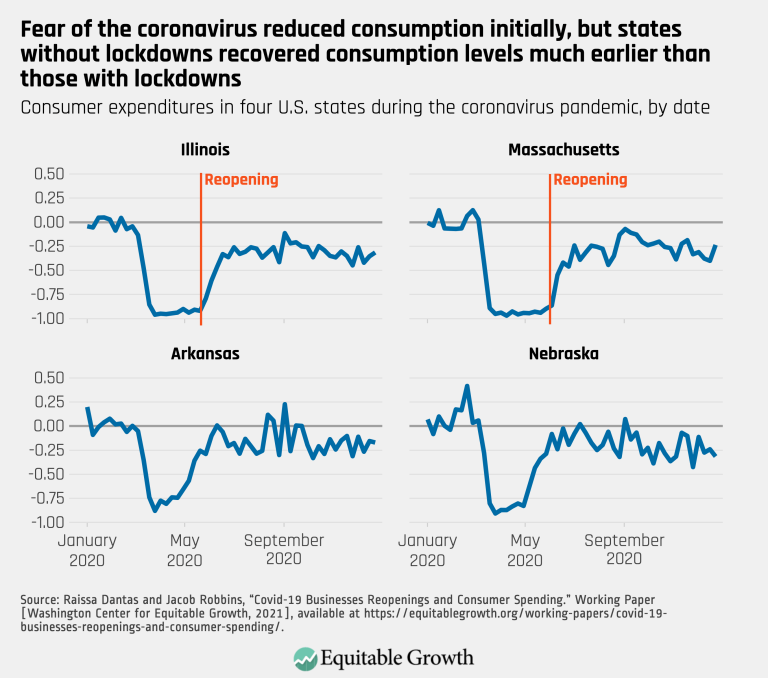
The coronavirus recession led to a previously unheard-of drop in consumer spending (opens in a new tab)
Visualizations May 27, 2021
 View Chart
(opens in a new tab)
View Chart
(opens in a new tab)
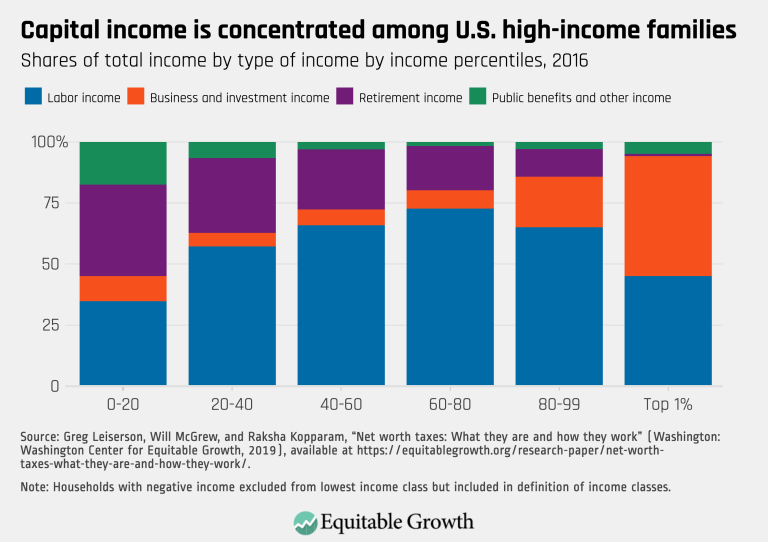
Capital income is concentrated among U.S. high-income families (opens in a new tab)
Visualizations May 14, 2021
 View Chart
(opens in a new tab)
View Chart
(opens in a new tab)
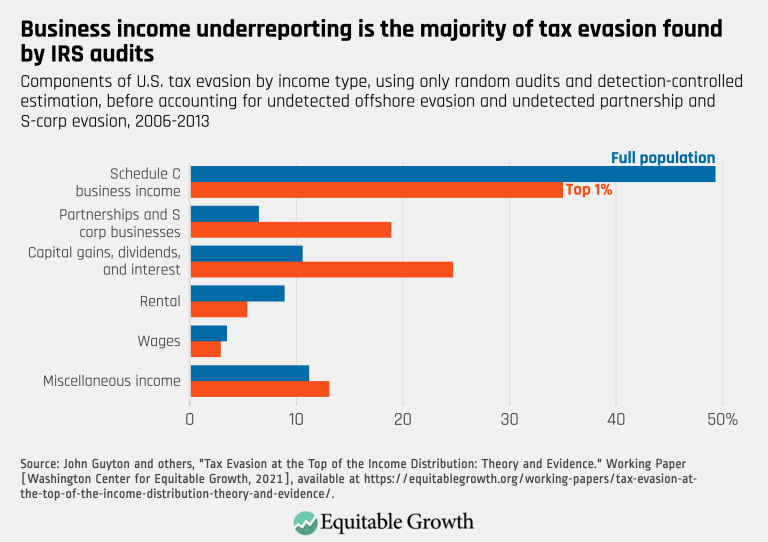
Business income underreporting is the majority of tax evasion found by IRS audits (opens in a new tab)
Visualizations May 14, 2021
 View Chart
(opens in a new tab)
View Chart
(opens in a new tab)
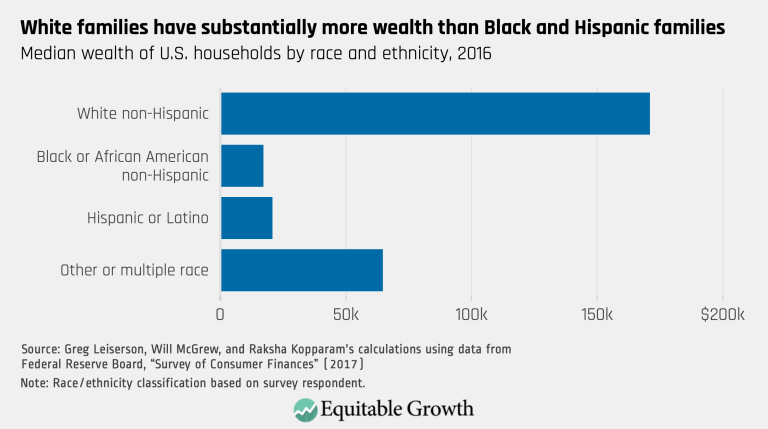
White families have substantially more wealth than Black and Hispanic families (opens in a new tab)
Visualizations Apr 19, 2021
 View Chart
(opens in a new tab)
View Chart
(opens in a new tab)
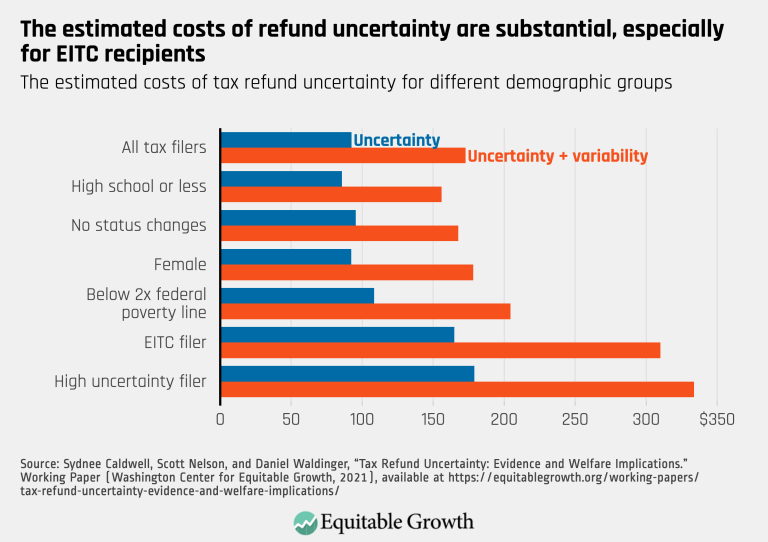
The estimated costs of refund uncertainty are substantial, especially for EITC recipients (opens in a new tab)
Visualizations Apr 13, 2021
 View Chart
(opens in a new tab)
View Chart
(opens in a new tab)
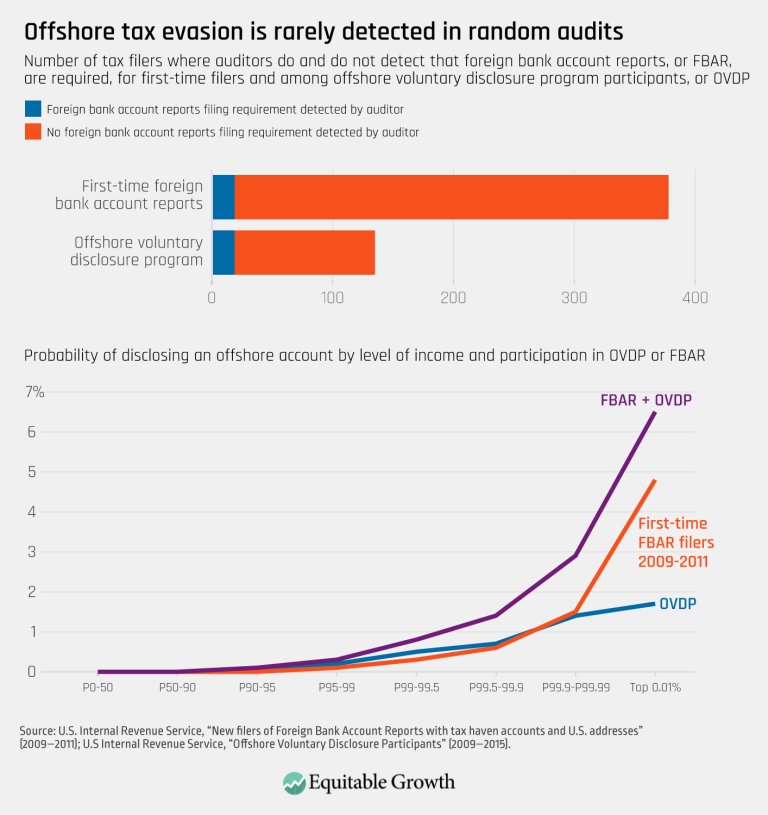
Offshore tax evasion is rarely detected in random audits (opens in a new tab)
Visualizations Mar 22, 2021
 View Chart
(opens in a new tab)
View Chart
(opens in a new tab)
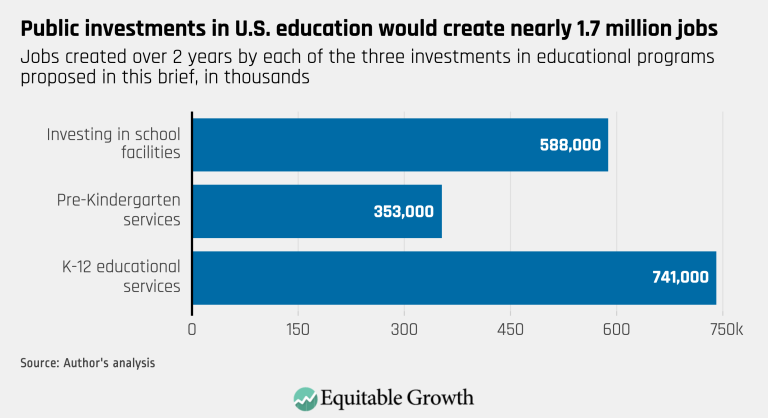
Public investment in U.S. education would create nearly 1.7 million jobs (opens in a new tab)
Visualizations Sep 22, 2020
 View Chart
(opens in a new tab)
View Chart
(opens in a new tab)
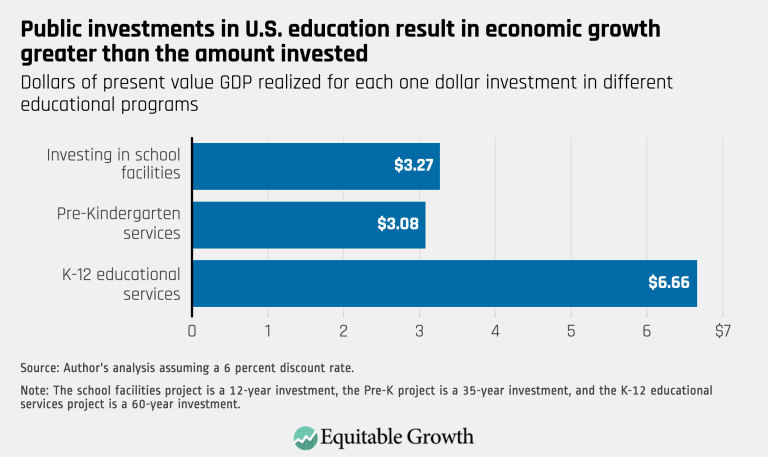
Public investment in U.S. education result in economic growth greater than the amount invested (opens in a new tab)
Visualizations Sep 22, 2020
 View Chart
(opens in a new tab)
View Chart
(opens in a new tab)
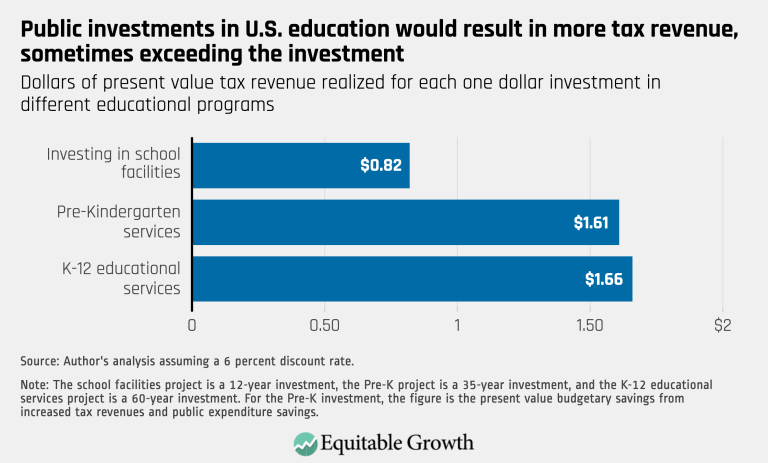
Public investment in U.S. education would result in more tax revenue, sometimes exceeding the investment (opens in a new tab)
Visualizations Sep 22, 2020
 View Chart
(opens in a new tab)
View Chart
(opens in a new tab)
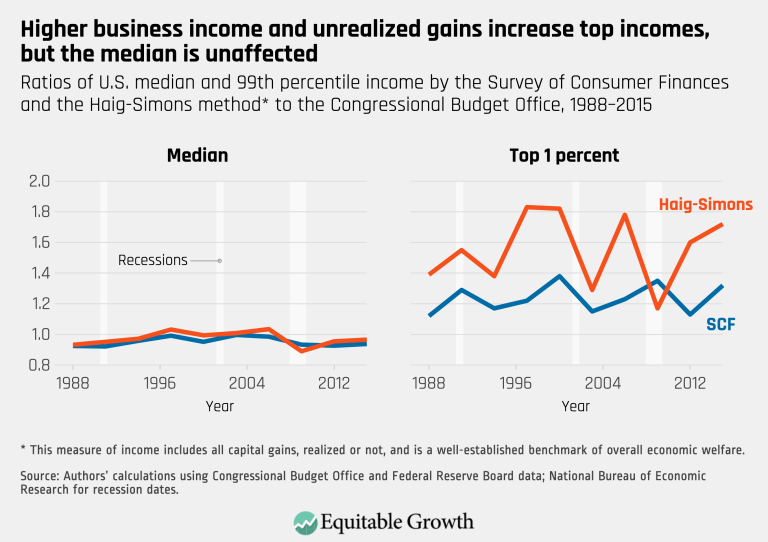
Higher business income and unrealized gains increase top incomes, but the median is anaffected (opens in a new tab)
Visualizations May 27, 2020
 View Chart
(opens in a new tab)
View Chart
(opens in a new tab)
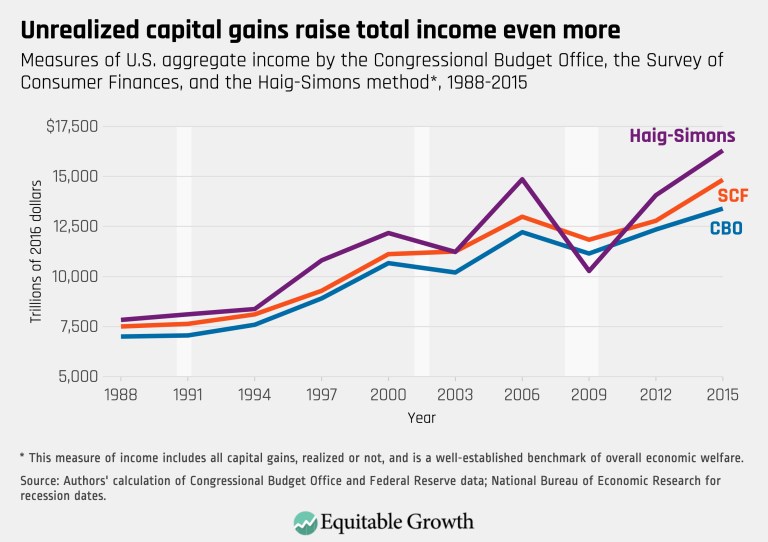
Unrealized capital gains raise total income even more (opens in a new tab)
Visualizations May 26, 2020
 View Chart
(opens in a new tab)
View Chart
(opens in a new tab)
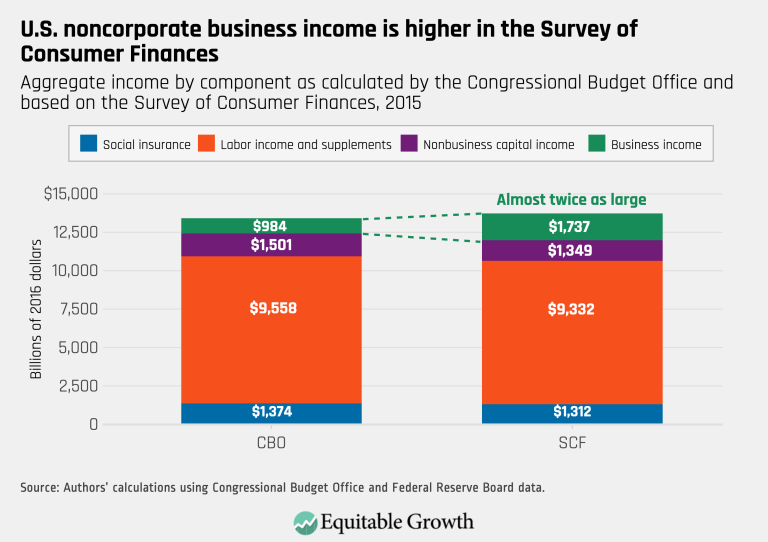
U.S. noncorporate business income is higher in the Survey of Consumer Finances (opens in a new tab)
Visualizations May 26, 2020
 View Chart
(opens in a new tab)
View Chart
(opens in a new tab)
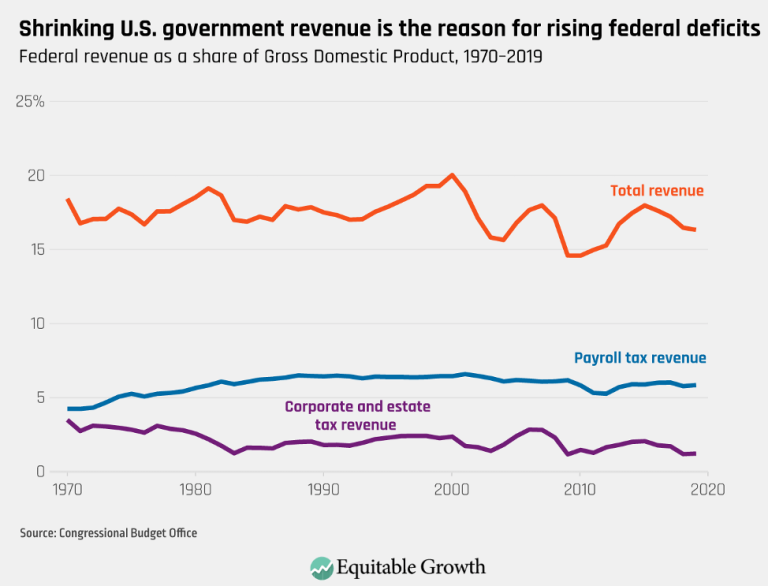
Shrinking U.S. government revenue is the reason for rising federal deficits (opens in a new tab)
Visualizations Apr 28, 2020
 View Chart
(opens in a new tab)
View Chart
(opens in a new tab)
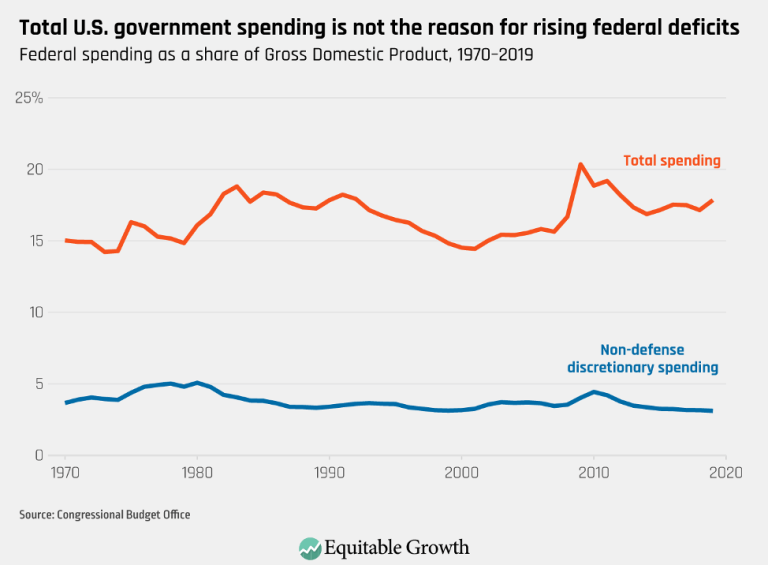
Total U.S. government spending is not the reason for rising federal deficits (opens in a new tab)
Visualizations Apr 28, 2020
 View Chart
(opens in a new tab)
View Chart
(opens in a new tab)
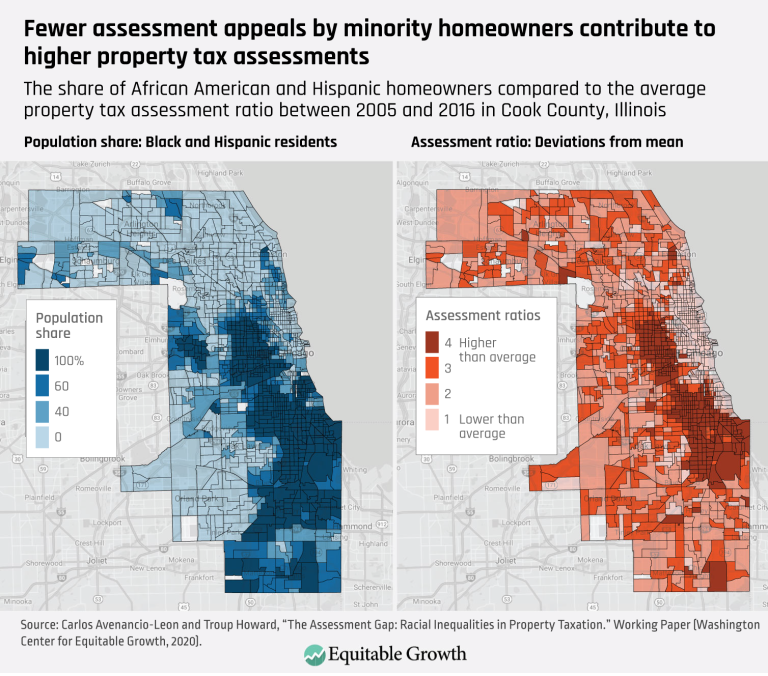
Fewer assessment appeals my minority homeowners contribute to higher property tax assessments (opens in a new tab)
Visualizations Apr 22, 2020
 View Chart
(opens in a new tab)
View Chart
(opens in a new tab)
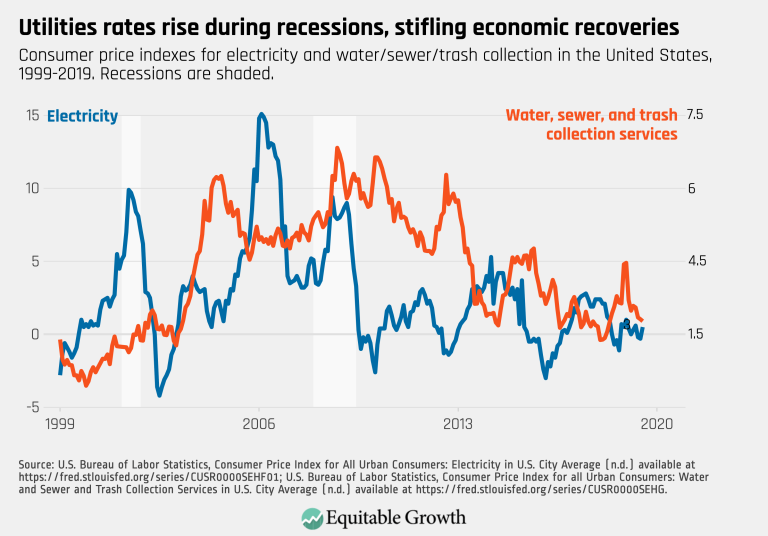
Utilities rates rise during recessions, stifling economic recoveries (opens in a new tab)
Visualizations Apr 2, 2020










































Your Source for the Latest Insights
Get updates on our latest research, event announcements, and policy insights delivered straight to your inbox. Stay connected with the leading voices on equitable growth.