


Issue Areas
The Washington Center for Equitable Growth is engaged in an array of issues to advance evidence-based ideas and policies that promote strong, stable, and broad-based economic growth.

152 Results

 View Chart
(opens in a new tab)
View Chart
(opens in a new tab)
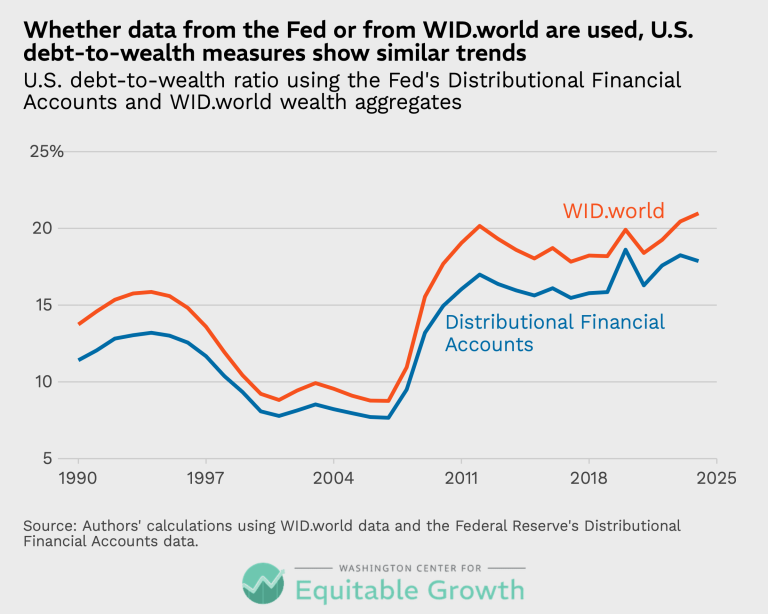
Whether data from the Fed or from WID.world are used, U.S. debt-to-wealth measures show similar trends (opens in a new tab)
Visualizations Jul 22, 2026
 View Chart
(opens in a new tab)
View Chart
(opens in a new tab)
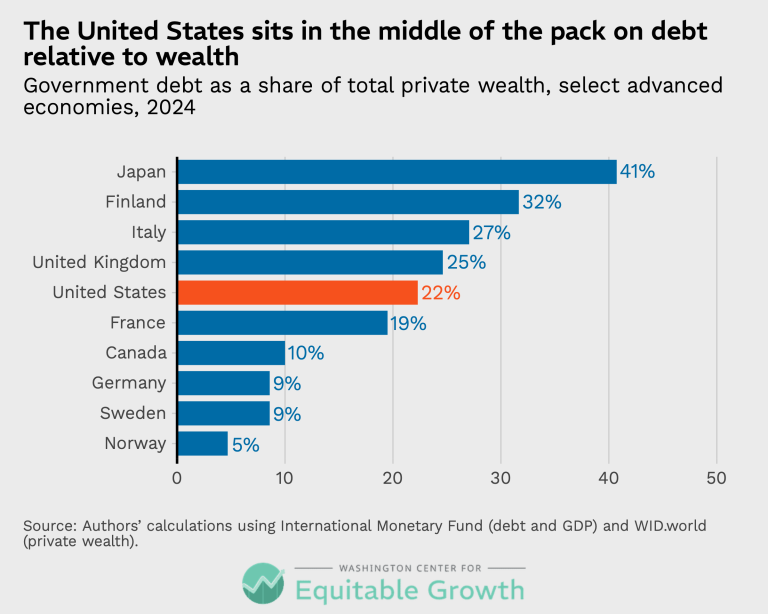
The United States sits in the middle of the pack on debt relative to wealth (opens in a new tab)
Visualizations Jul 22, 2026
 View Chart
(opens in a new tab)
View Chart
(opens in a new tab)
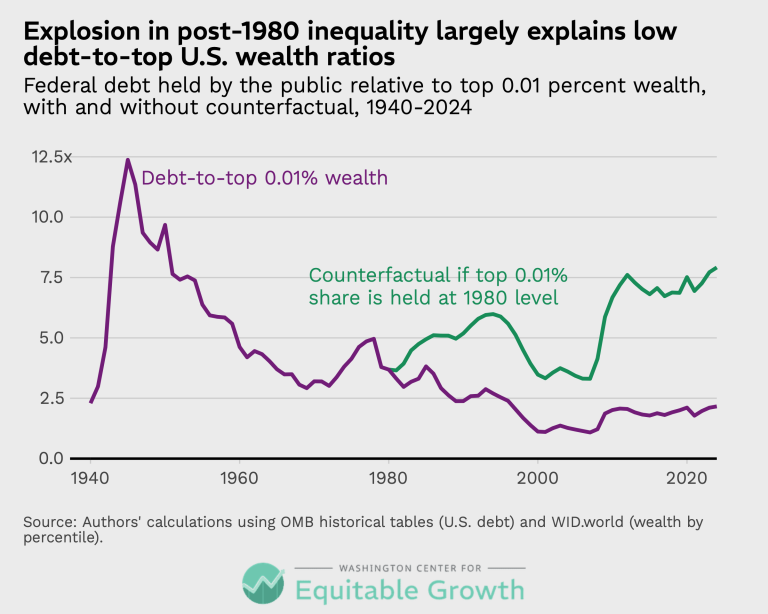
Explosion in post-1980 inequality largely explains low debt-to-top U.S. wealth ratios (opens in a new tab)
Visualizations Jul 22, 2026
 View Chart
(opens in a new tab)
View Chart
(opens in a new tab)
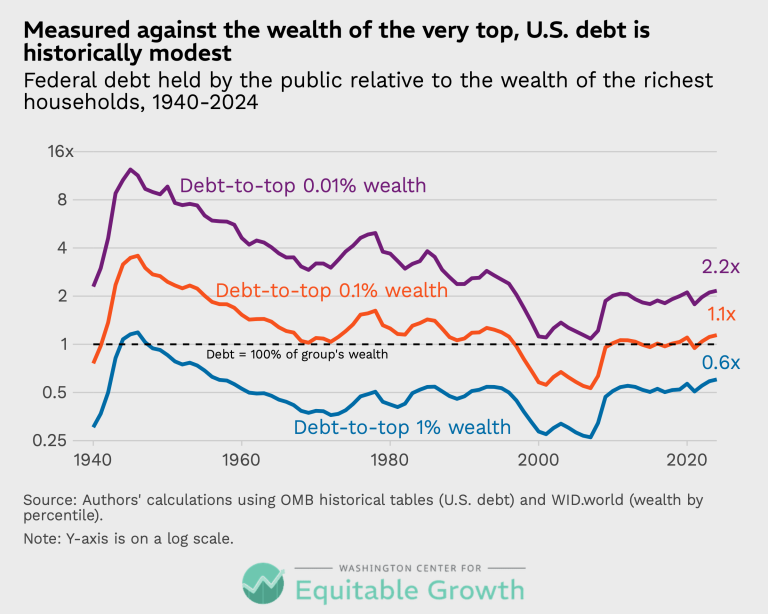
Measured against the wealth of the very top, U.S. debt is historically modest (opens in a new tab)
Visualizations Jul 22, 2026
 View Chart
(opens in a new tab)
View Chart
(opens in a new tab)
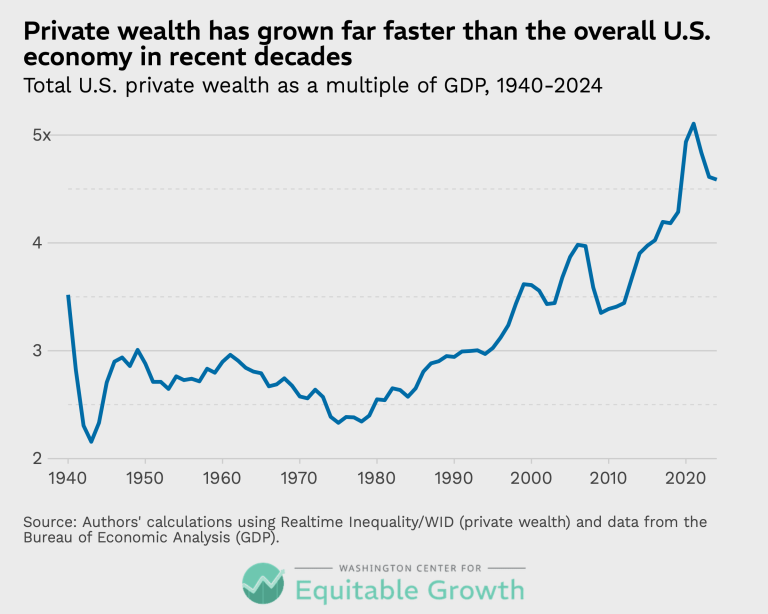
Private wealth has grown far faster than the overall U.S. economy in recent decades (opens in a new tab)
Visualizations Jul 22, 2026
 View Chart
(opens in a new tab)
View Chart
(opens in a new tab)
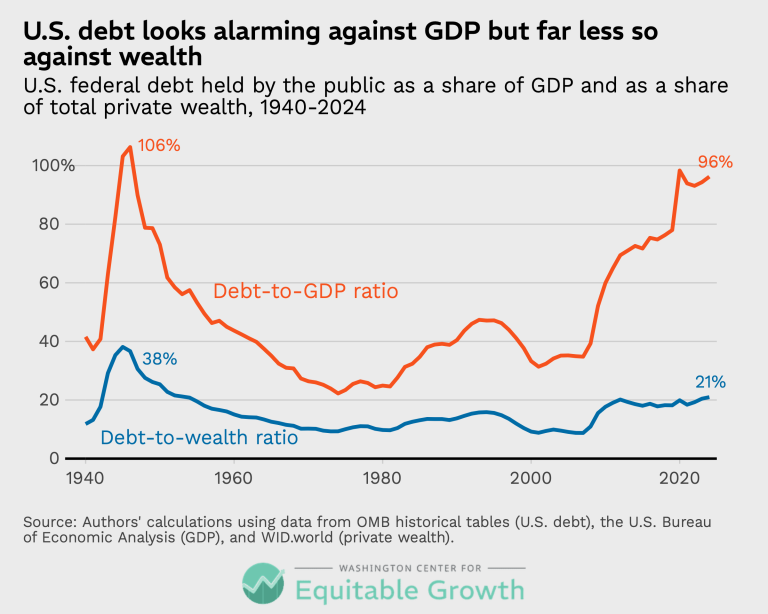
U.S. debt looks alarming against GDP but far less so against wealth (opens in a new tab)
Visualizations Jul 22, 2026
 View Chart
(opens in a new tab)
View Chart
(opens in a new tab)
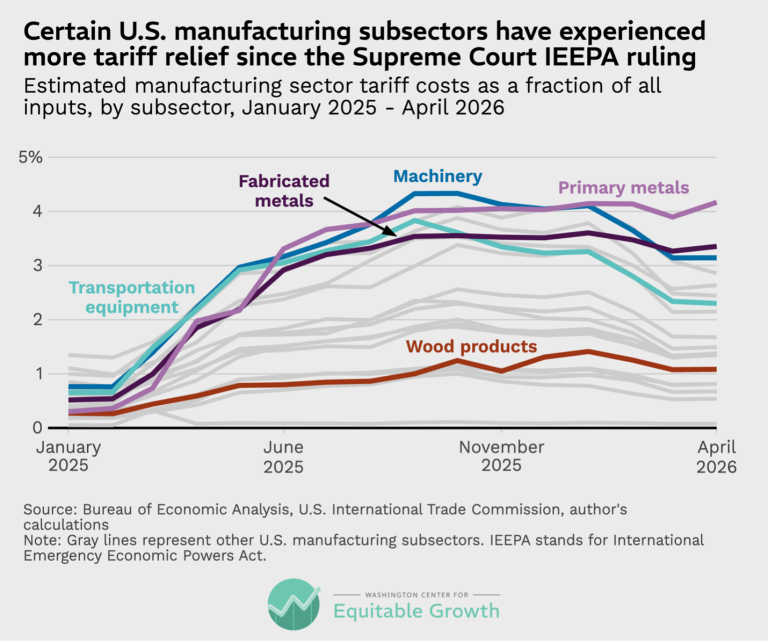
Certain U.S. manufacturing subsectors have experienced more tariff relief since the Supreme Court IEEPA ruling (opens in a new tab)
Visualizations Jul 13, 2026
 View Chart
(opens in a new tab)
View Chart
(opens in a new tab)
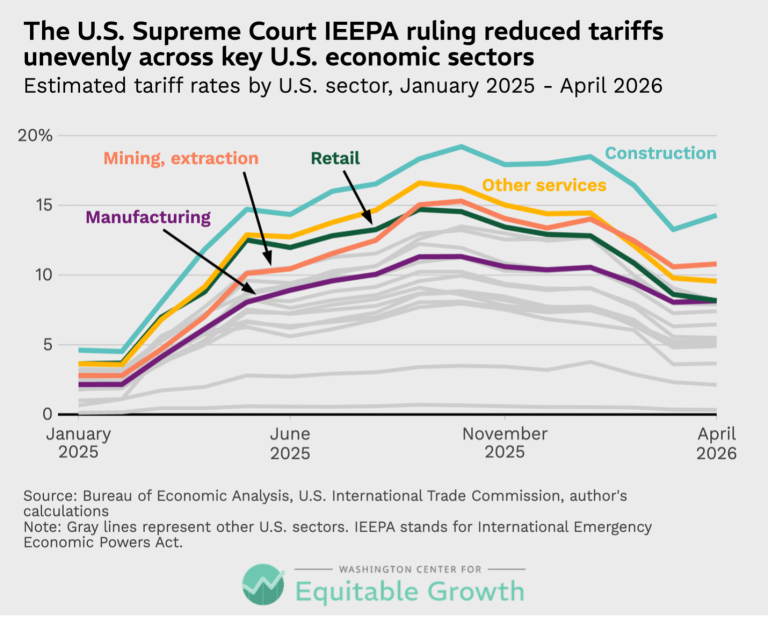
The U.S. Supreme Court IEEPA ruling reduced tariffs unevenly across key U.S. economic sectors (opens in a new tab)
Visualizations Jul 13, 2026
 View Chart
(opens in a new tab)
View Chart
(opens in a new tab)
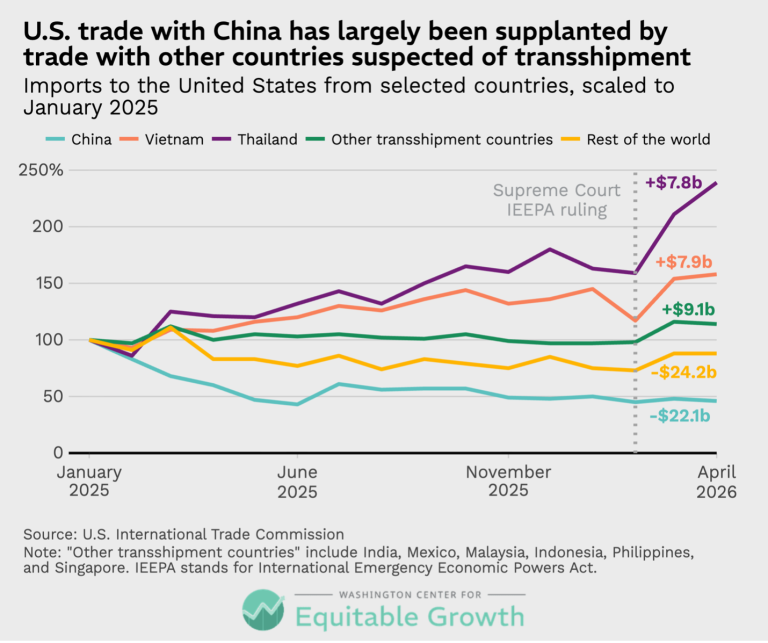
U.S. trade with China has largely been supplanted by trade with other countries suspected of transshipment (opens in a new tab)
Visualizations Jul 13, 2026
 View Chart
(opens in a new tab)
View Chart
(opens in a new tab)
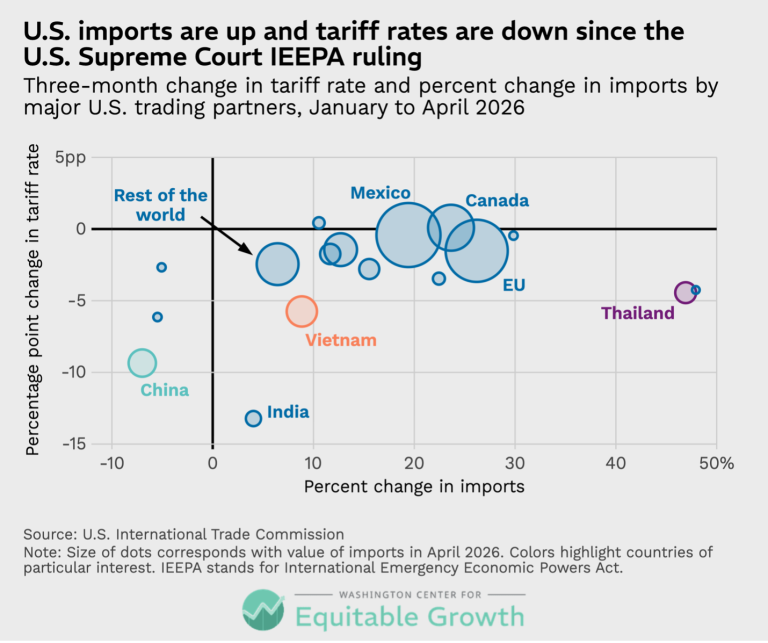
U.S. imports are up and tariff rates are down since the U.S. Supreme Court IEEPA ruling (opens in a new tab)
Visualizations Jul 13, 2026
 View Chart
(opens in a new tab)
View Chart
(opens in a new tab)
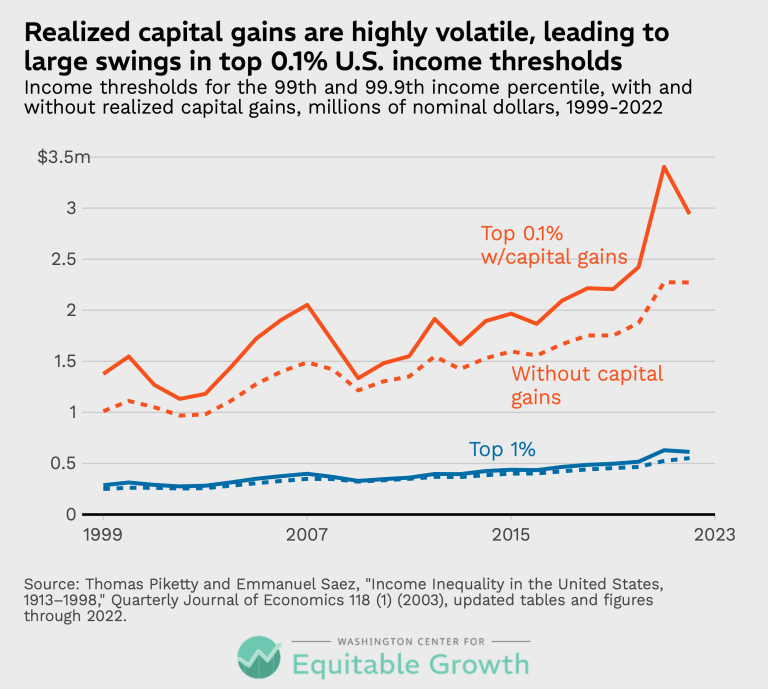
Realized capital gains are highly volatile, leading to large swings in the top 0.1% U.S. income thresholds (opens in a new tab)
Visualizations May 26, 2026
 View Chart
(opens in a new tab)
View Chart
(opens in a new tab)
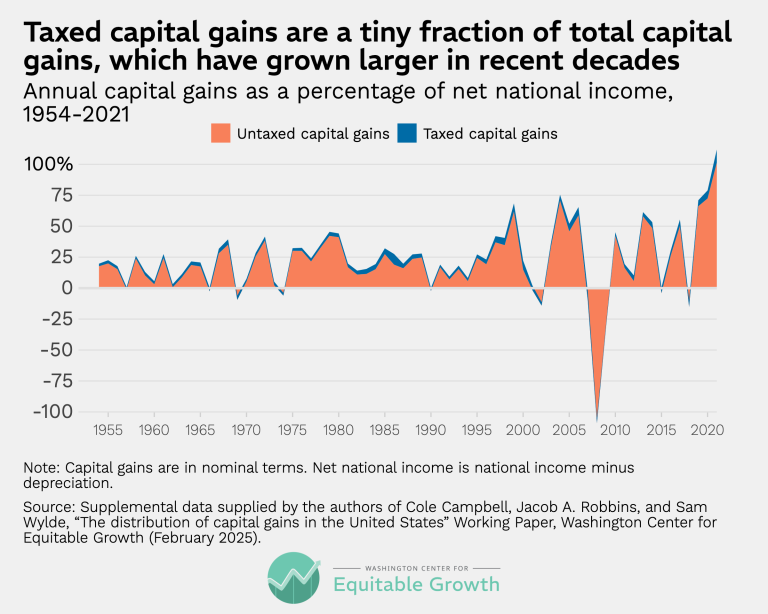
Taxed capital gains are a tiny fraction of total capital gains, which have grown larger in recent decades (opens in a new tab)
Visualizations May 6, 2026








































Your Source for the Latest Insights
Get updates on our latest research, event announcements, and policy insights delivered straight to your inbox. Stay connected with the leading voices on equitable growth.