


Issue Areas
The Washington Center for Equitable Growth is engaged in an array of issues to advance evidence-based ideas and policies that promote strong, stable, and broad-based economic growth.

779 Results


What happens to U.S. workers without access to Unemployment Insurance amid economic downturns or disruptions related to AI? (opens in a new tab)
Essays Sep 2, 2026
The adoption of artificial intelligence in the workplace has led to predictions of U.S. labor market disruptions. In response, policymakers have increased attention on the fitness of the nation’s social…

Defining extreme wealth is more complicated than it looks (opens in a new tab)
Videos Aug 13, 2026
Facing high levels of income and wealth inequality and shrinking tax revenues, U.S. policymakers are showing increased interest in proposals to tax the richest households. Yet determining which households fall into that category is complex and changes based…

Estimating AI exposure is useful for research but cannot yet tell policymakers the whole story of AI’s impact on the labor market (opens in a new tab)
Essays Aug 7, 2026
Artificial intelligence has the potential to substantially change the nature and availability of work. To effectively manage the transitions this technology might bring to the U.S. economy, policymakers need information…
The debt-to-wealth ratio: A missing lens on the U.S. government’s fiscal capacity (opens in a new tab)
Reports Jul 30, 2026
Few statistics shape the fiscal debate in the United States as powerfully as the ratio of federal debt-to-Gross Domestic Product. Debt held by the public recently surpassed 100 percent of…
 View Chart
(opens in a new tab)
View Chart
(opens in a new tab)
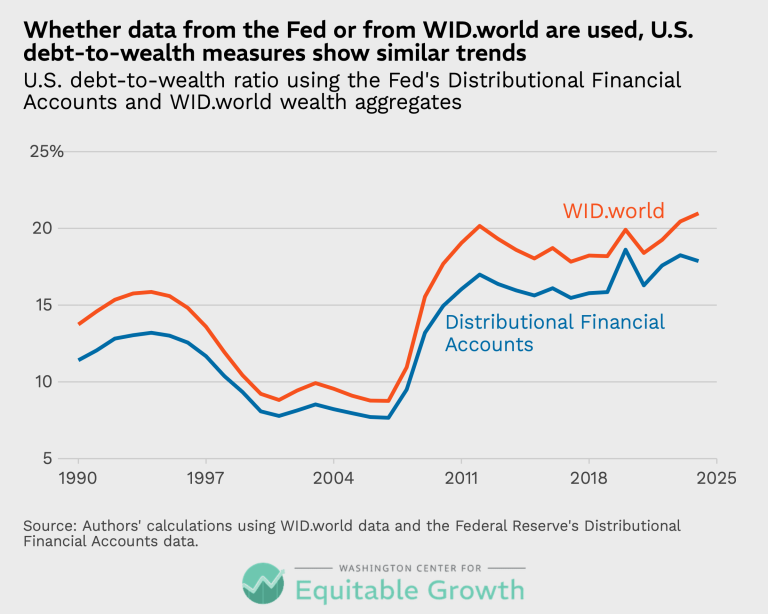
Whether data from the Fed or from WID.world are used, U.S. debt-to-wealth measures show similar trends (opens in a new tab)
Visualizations Jul 22, 2026
 View Chart
(opens in a new tab)
View Chart
(opens in a new tab)
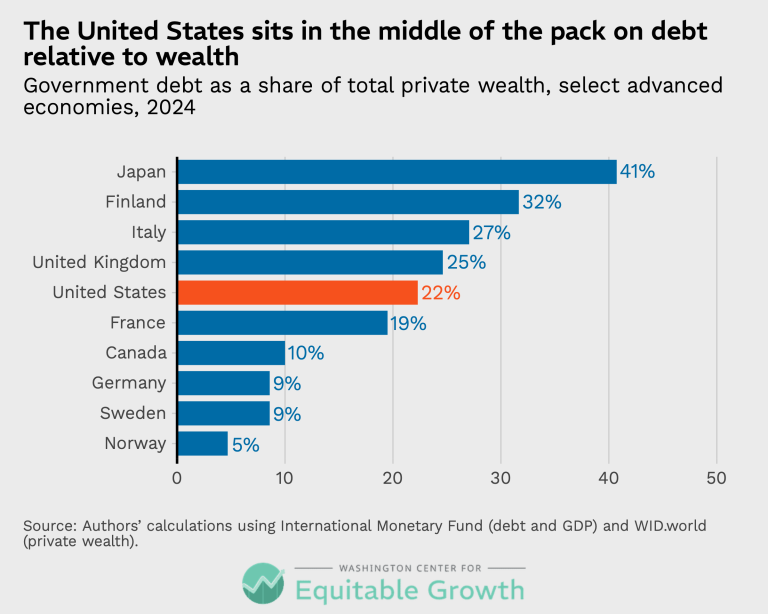
The United States sits in the middle of the pack on debt relative to wealth (opens in a new tab)
Visualizations Jul 22, 2026
 View Chart
(opens in a new tab)
View Chart
(opens in a new tab)
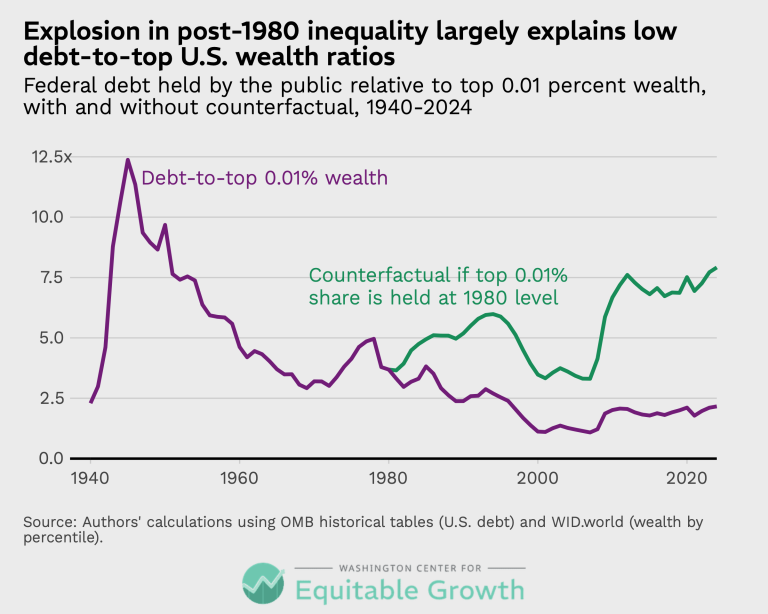
Explosion in post-1980 inequality largely explains low debt-to-top U.S. wealth ratios (opens in a new tab)
Visualizations Jul 22, 2026
 View Chart
(opens in a new tab)
View Chart
(opens in a new tab)
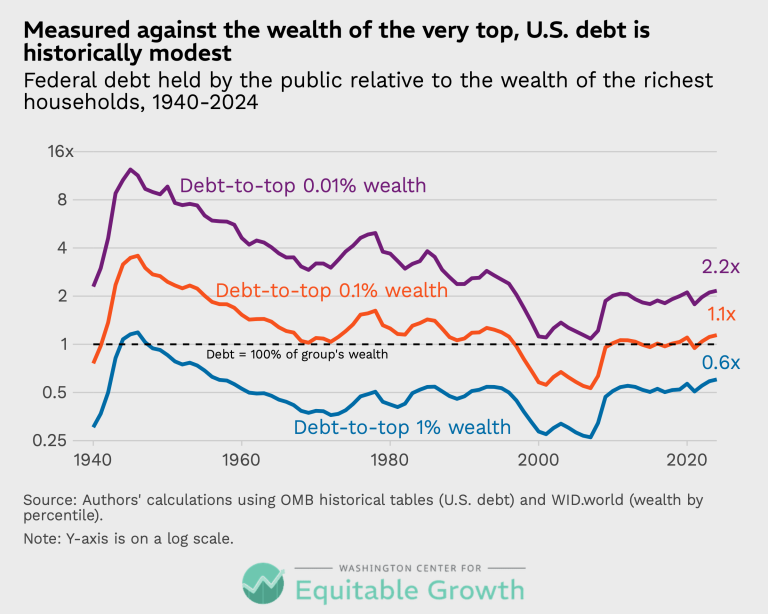
Measured against the wealth of the very top, U.S. debt is historically modest (opens in a new tab)
Visualizations Jul 22, 2026
 View Chart
(opens in a new tab)
View Chart
(opens in a new tab)
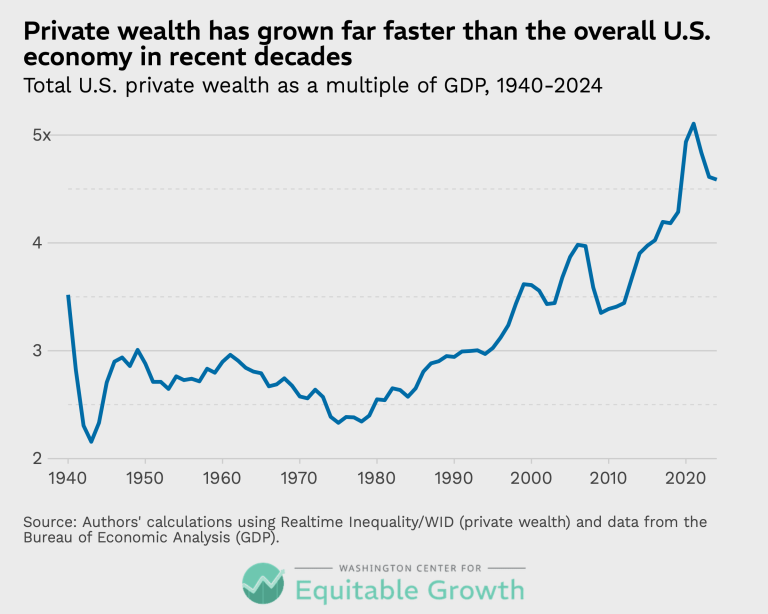
Private wealth has grown far faster than the overall U.S. economy in recent decades (opens in a new tab)
Visualizations Jul 22, 2026
 View Chart
(opens in a new tab)
View Chart
(opens in a new tab)
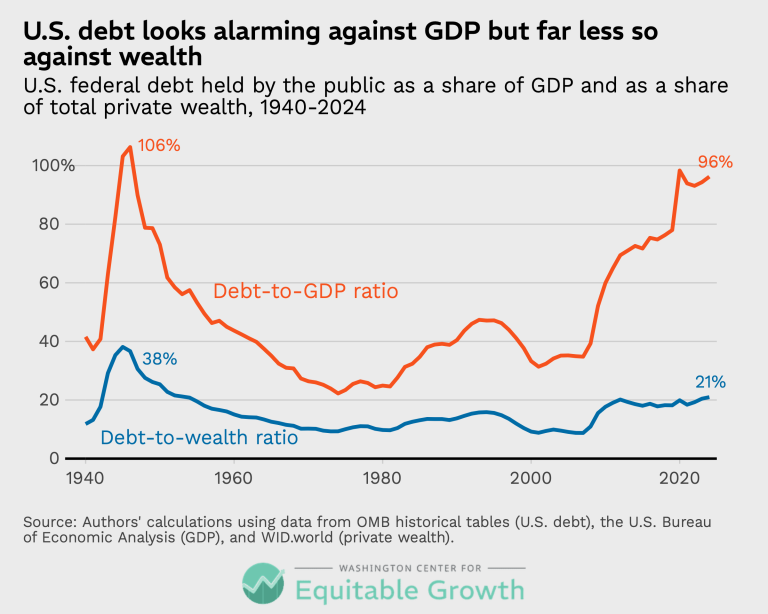
U.S. debt looks alarming against GDP but far less so against wealth (opens in a new tab)
Visualizations Jul 22, 2026

The costs of the Trump administration’s tariffs diverge for countries and industries so far in 2026 (opens in a new tab)
Essays Jul 14, 2026
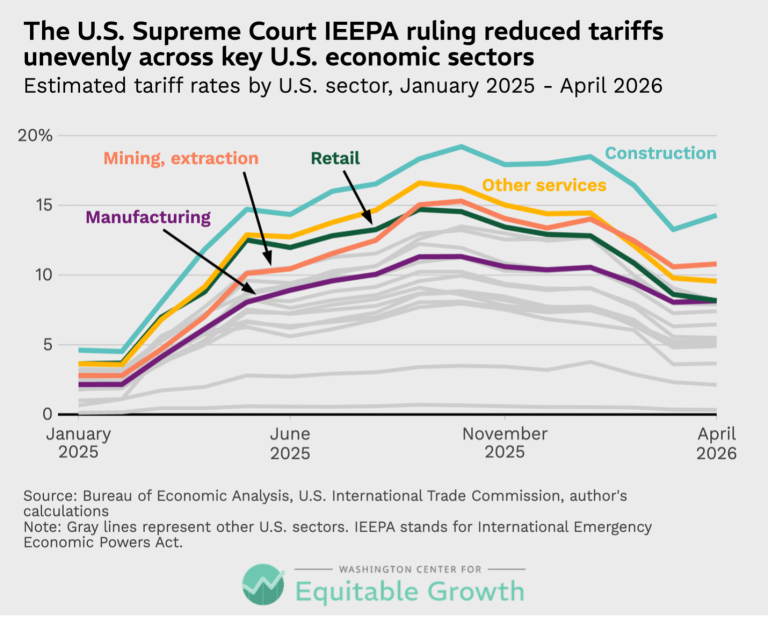
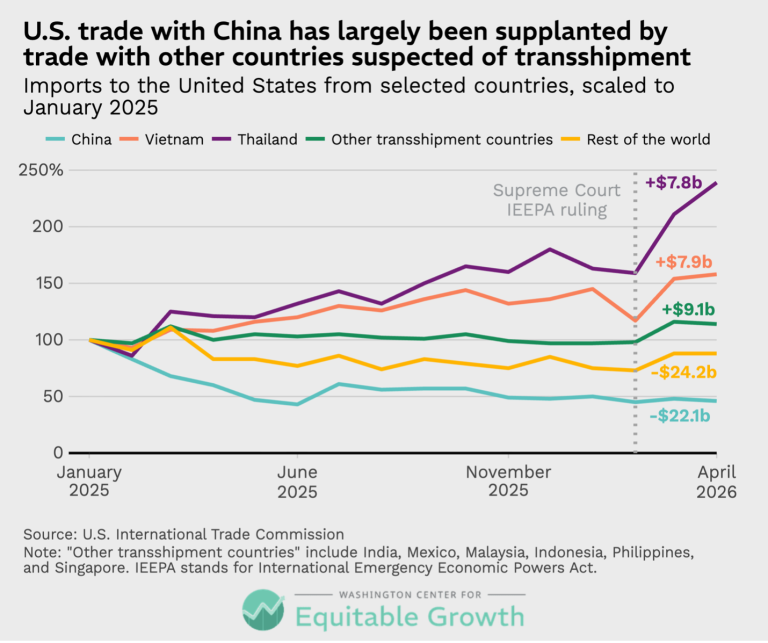
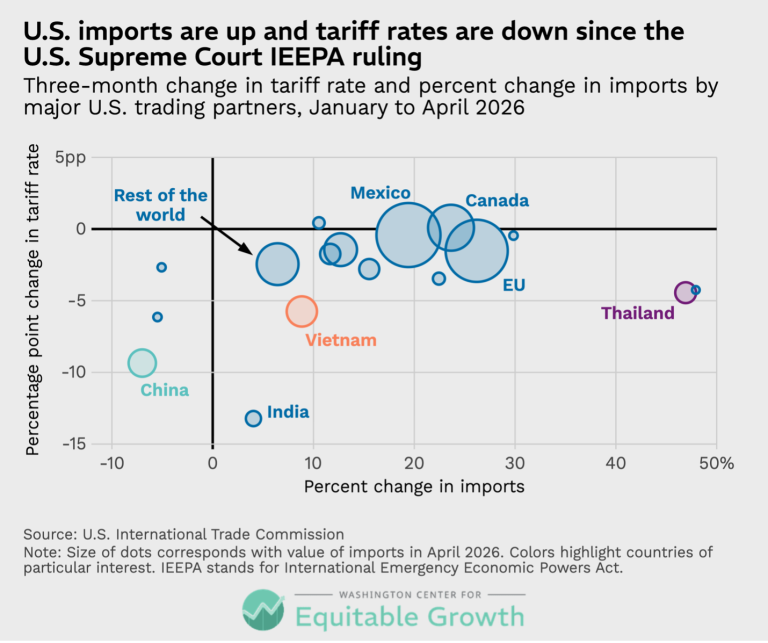
The first 4 months of 2026 saw continued seismic changes in U.S. trade policy. In late February, the U.S. Supreme Court struck down the Trump administration’s use of the International…
 View Chart
(opens in a new tab)
View Chart
(opens in a new tab)
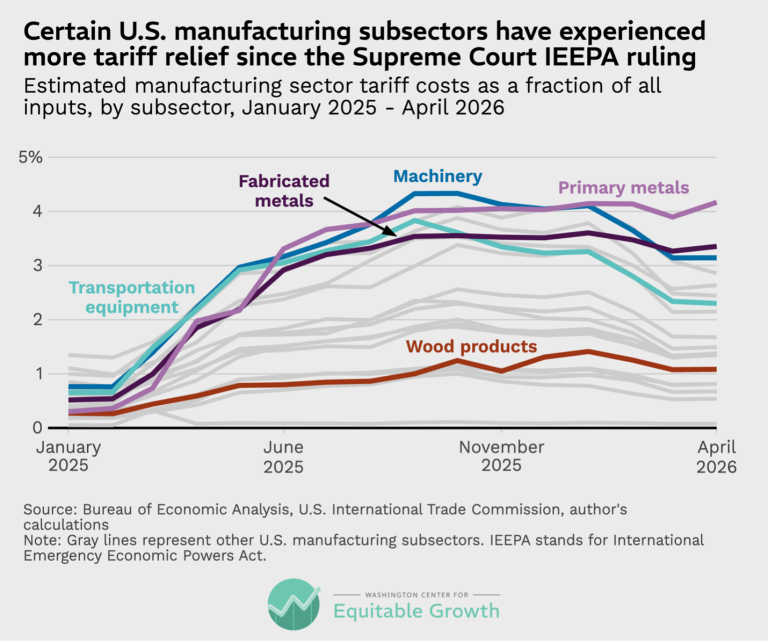
Certain U.S. manufacturing subsectors have experienced more tariff relief since the Supreme Court IEEPA ruling (opens in a new tab)
Visualizations Jul 13, 2026
 View Chart
(opens in a new tab)
View Chart
(opens in a new tab)
The U.S. Supreme Court IEEPA ruling reduced tariffs unevenly across key U.S. economic sectors (opens in a new tab)
Visualizations Jul 13, 2026
 View Chart
(opens in a new tab)
View Chart
(opens in a new tab)
U.S. trade with China has largely been supplanted by trade with other countries suspected of transshipment (opens in a new tab)
Visualizations Jul 13, 2026
 View Chart
(opens in a new tab)
View Chart
(opens in a new tab)
U.S. imports are up and tariff rates are down since the U.S. Supreme Court IEEPA ruling (opens in a new tab)
Visualizations Jul 13, 2026

Personal Income in the United States nudges up in May but is down 0.76 percent in the past 6 months (opens in a new tab)
Essays Jun 25, 2026
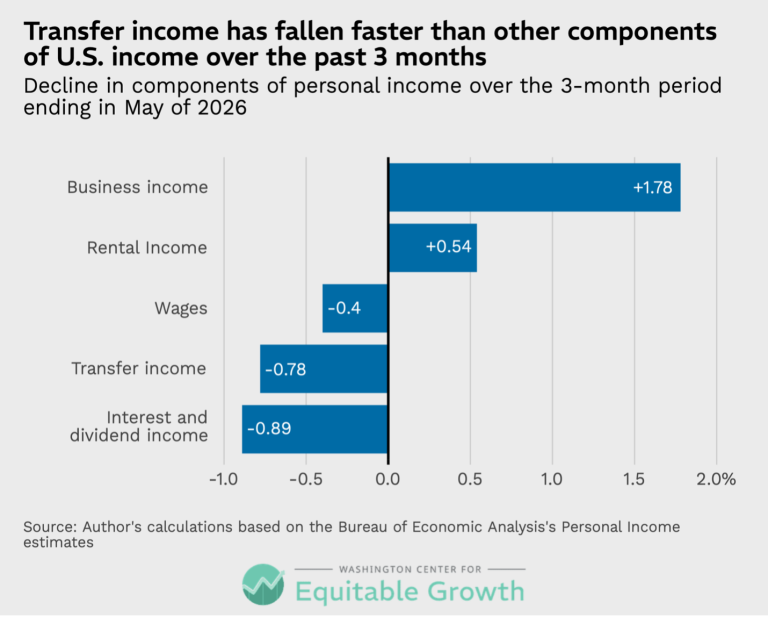
According to today’s release of Personal Income estimates from the U.S. Bureau of Economic Analysis, U.S. household incomes have fallen 0.76 percent in the past 6 months, with month-to-month declines…
 View Chart
(opens in a new tab)
View Chart
(opens in a new tab)
Transfer income has fallen faster than other components of U.S. income over the past 3 months (opens in a new tab)
Visualizations Jun 25, 2026
 View Chart
(opens in a new tab)
View Chart
(opens in a new tab)
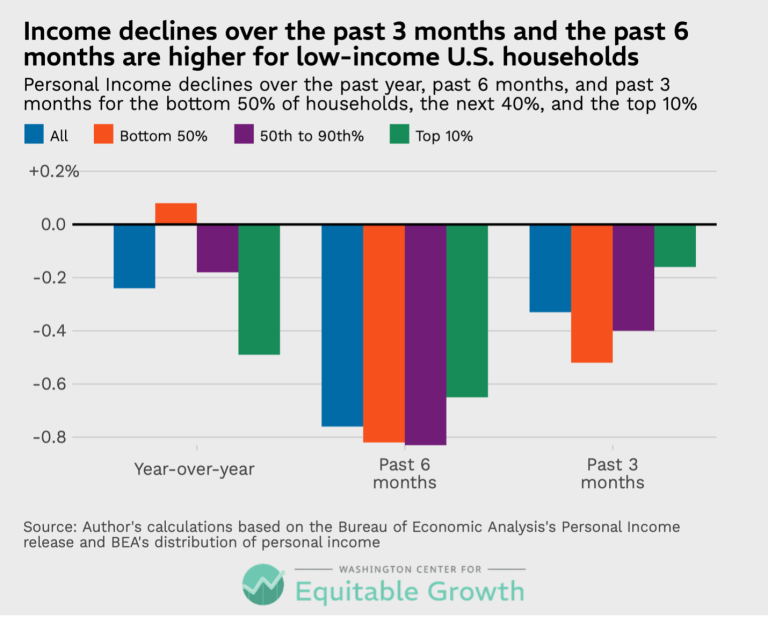
Income declines over the past 3 months and the past 6 months are higher for low-income U.S. households (opens in a new tab)
Visualizations Jun 25, 2026





































Your Source for the Latest Insights
Get updates on our latest research, event announcements, and policy insights delivered straight to your inbox. Stay connected with the leading voices on equitable growth.