


Issue Areas
The Washington Center for Equitable Growth is engaged in an array of issues to advance evidence-based ideas and policies that promote strong, stable, and broad-based economic growth.

234 Results

 View Chart
(opens in a new tab)
View Chart
(opens in a new tab)
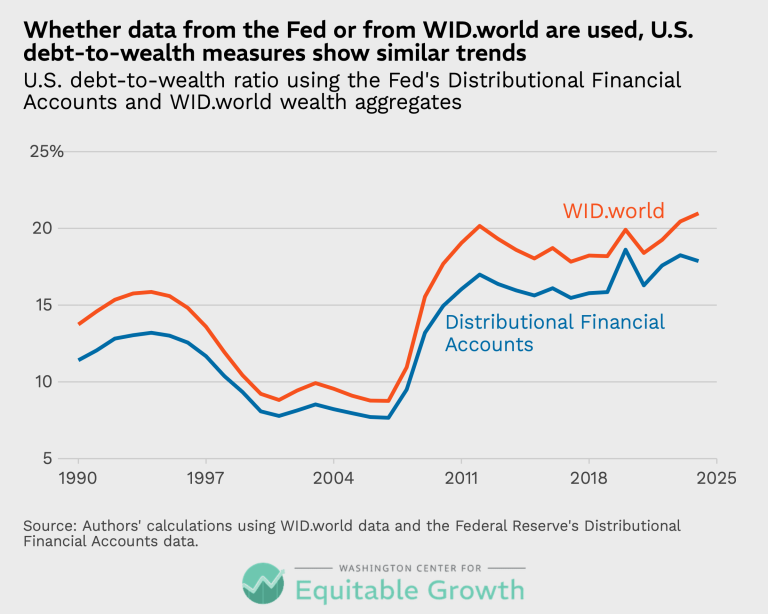
Whether data from the Fed or from WID.world are used, U.S. debt-to-wealth measures show similar trends (opens in a new tab)
Visualizations Jul 22, 2026
 View Chart
(opens in a new tab)
View Chart
(opens in a new tab)
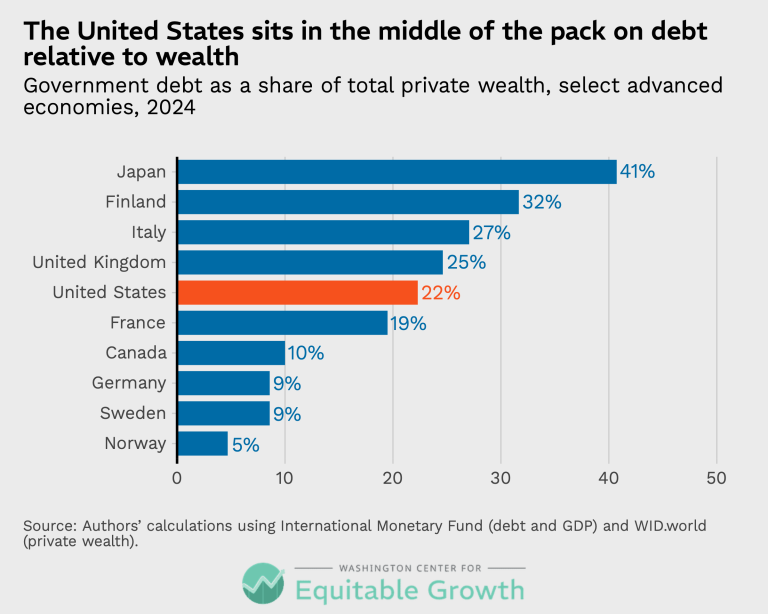
The United States sits in the middle of the pack on debt relative to wealth (opens in a new tab)
Visualizations Jul 22, 2026
 View Chart
(opens in a new tab)
View Chart
(opens in a new tab)
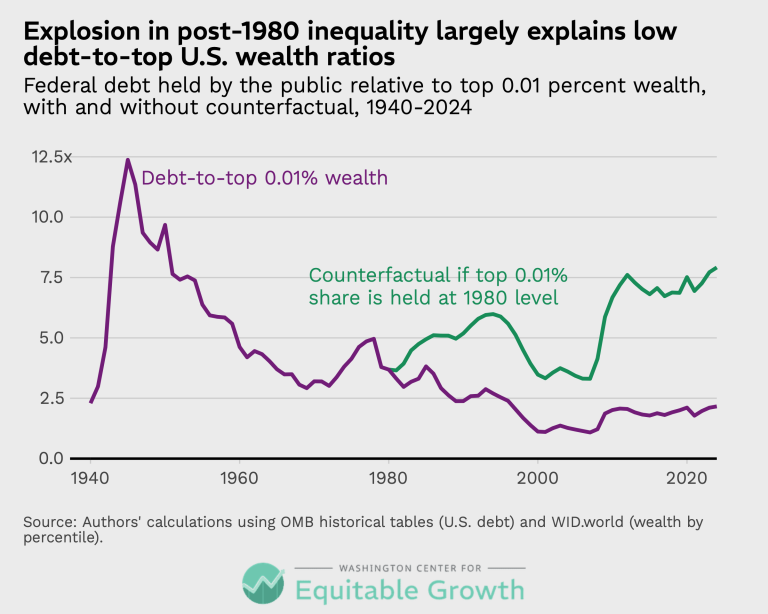
Explosion in post-1980 inequality largely explains low debt-to-top U.S. wealth ratios (opens in a new tab)
Visualizations Jul 22, 2026
 View Chart
(opens in a new tab)
View Chart
(opens in a new tab)
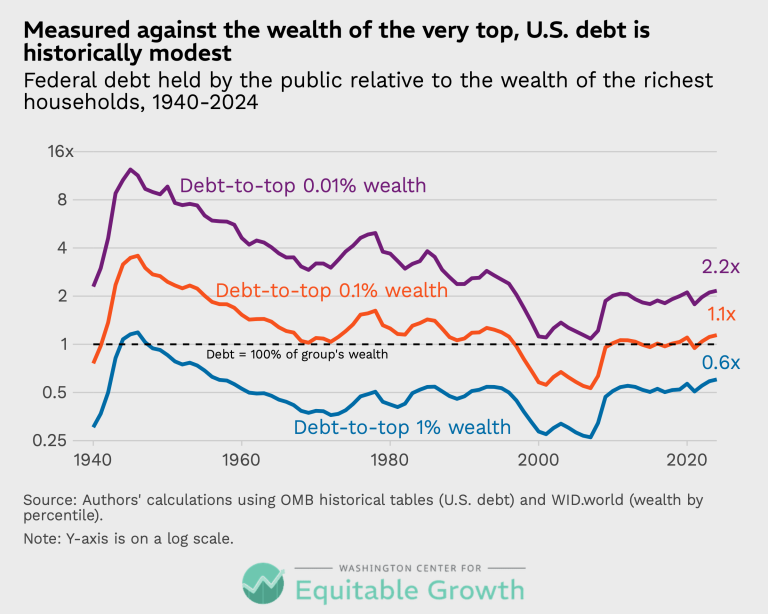
Measured against the wealth of the very top, U.S. debt is historically modest (opens in a new tab)
Visualizations Jul 22, 2026
 View Chart
(opens in a new tab)
View Chart
(opens in a new tab)
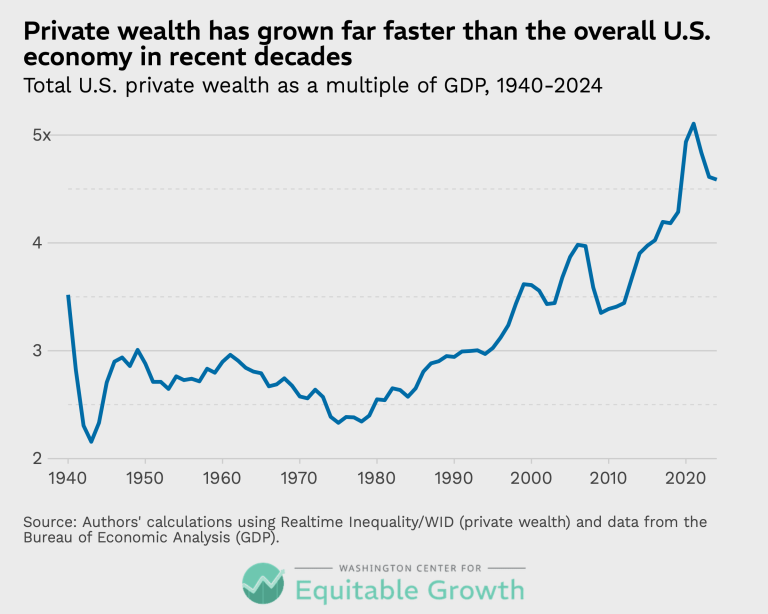
Private wealth has grown far faster than the overall U.S. economy in recent decades (opens in a new tab)
Visualizations Jul 22, 2026
 View Chart
(opens in a new tab)
View Chart
(opens in a new tab)
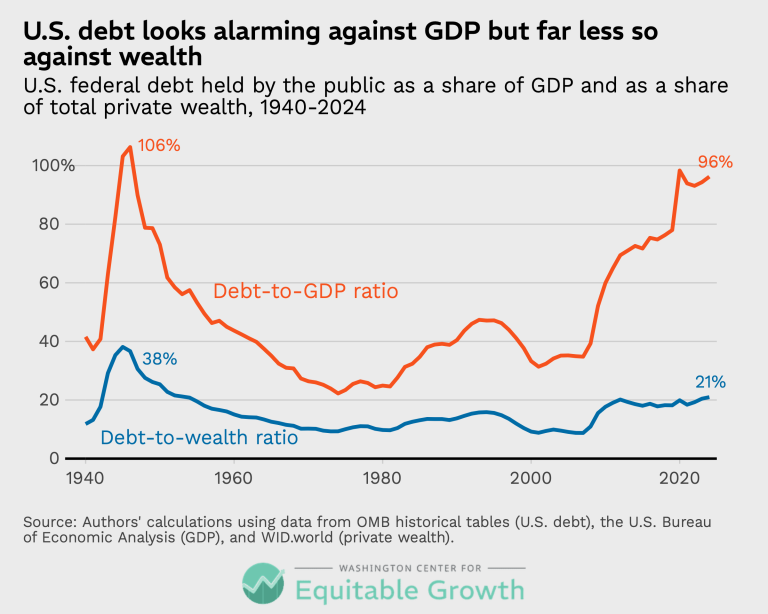
U.S. debt looks alarming against GDP but far less so against wealth (opens in a new tab)
Visualizations Jul 22, 2026
 View Chart
(opens in a new tab)
View Chart
(opens in a new tab)
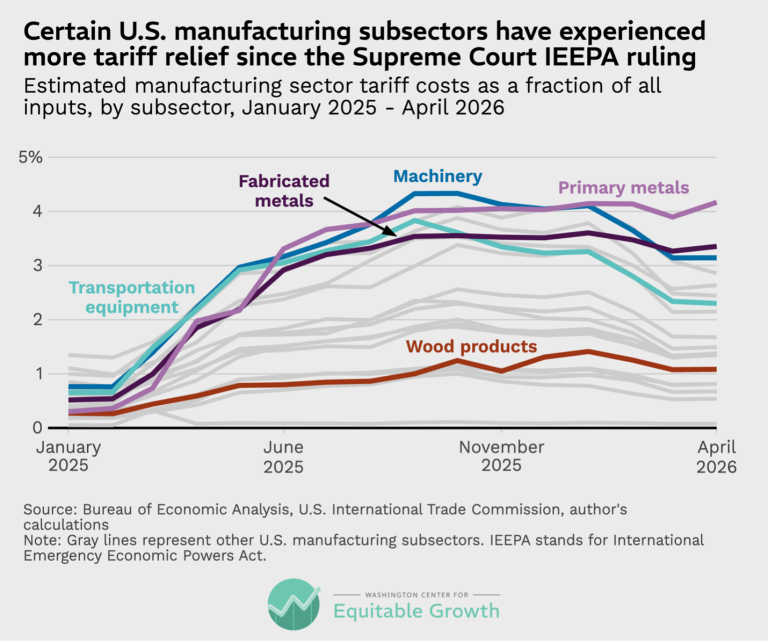
Certain U.S. manufacturing subsectors have experienced more tariff relief since the Supreme Court IEEPA ruling (opens in a new tab)
Visualizations Jul 13, 2026
 View Chart
(opens in a new tab)
View Chart
(opens in a new tab)
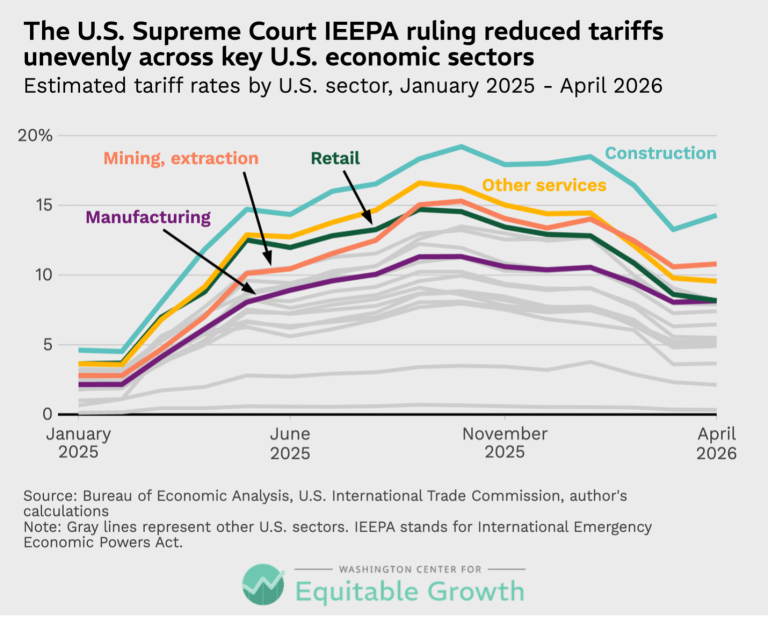
The U.S. Supreme Court IEEPA ruling reduced tariffs unevenly across key U.S. economic sectors (opens in a new tab)
Visualizations Jul 13, 2026
 View Chart
(opens in a new tab)
View Chart
(opens in a new tab)
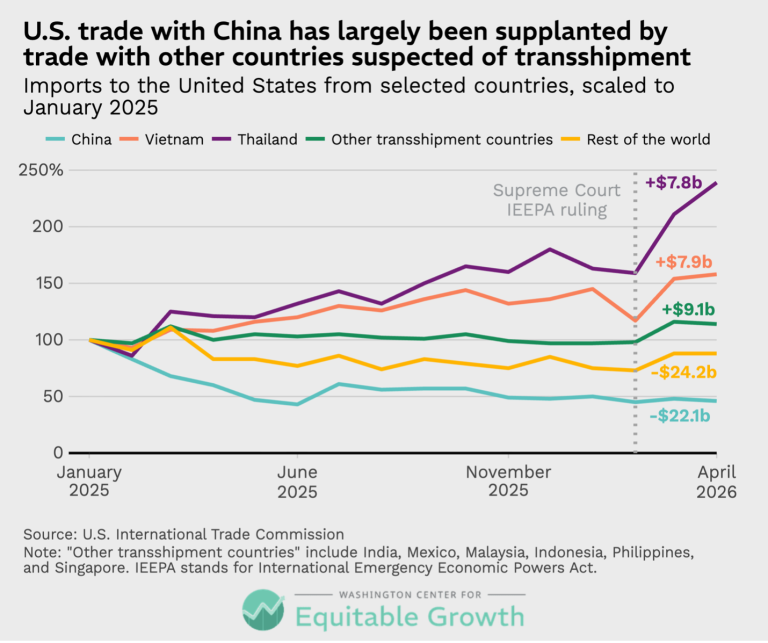
U.S. trade with China has largely been supplanted by trade with other countries suspected of transshipment (opens in a new tab)
Visualizations Jul 13, 2026
 View Chart
(opens in a new tab)
View Chart
(opens in a new tab)
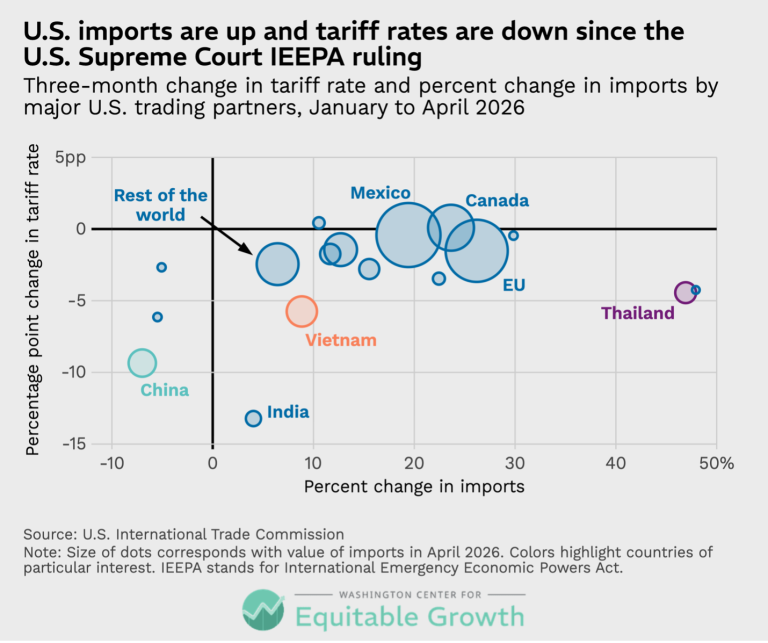
U.S. imports are up and tariff rates are down since the U.S. Supreme Court IEEPA ruling (opens in a new tab)
Visualizations Jul 13, 2026
 View Chart
(opens in a new tab)
View Chart
(opens in a new tab)
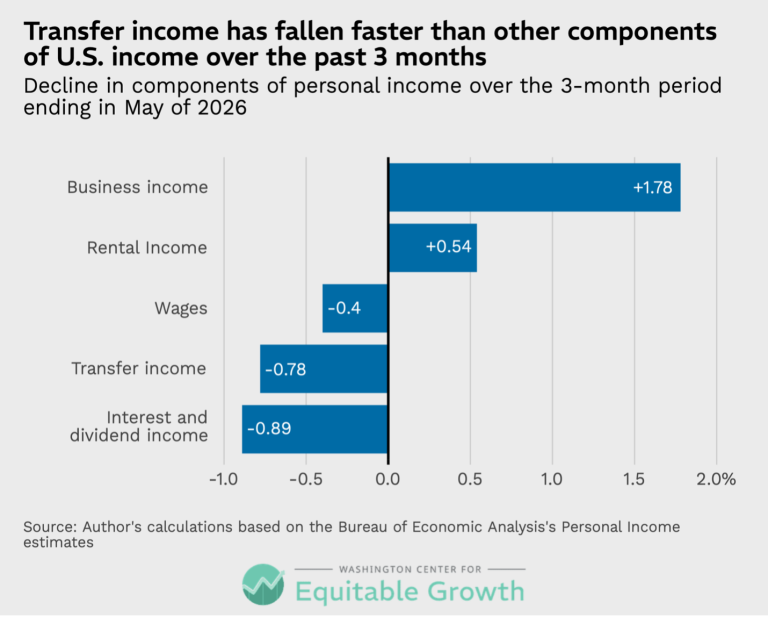
Transfer income has fallen faster than other components of U.S. income over the past 3 months (opens in a new tab)
Visualizations Jun 25, 2026
 View Chart
(opens in a new tab)
View Chart
(opens in a new tab)
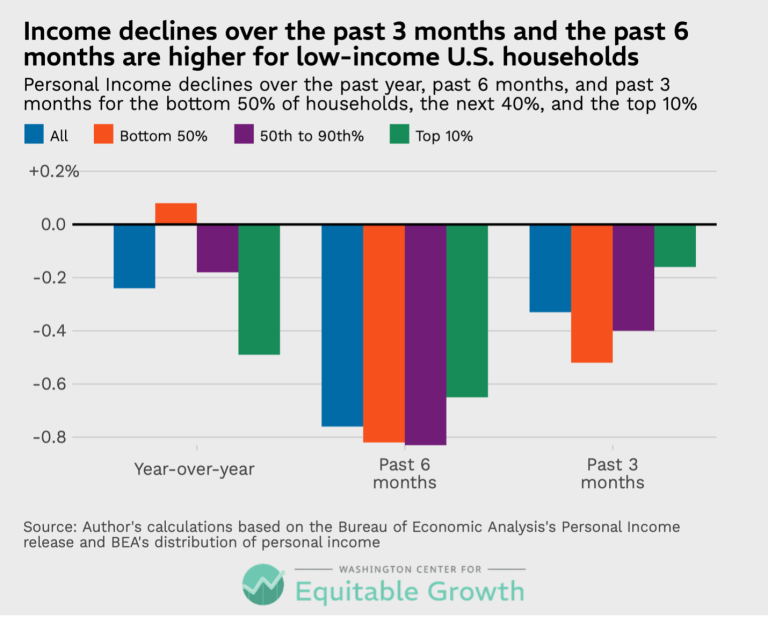
Income declines over the past 3 months and the past 6 months are higher for low-income U.S. households (opens in a new tab)
Visualizations Jun 25, 2026
 View Chart
(opens in a new tab)
View Chart
(opens in a new tab)
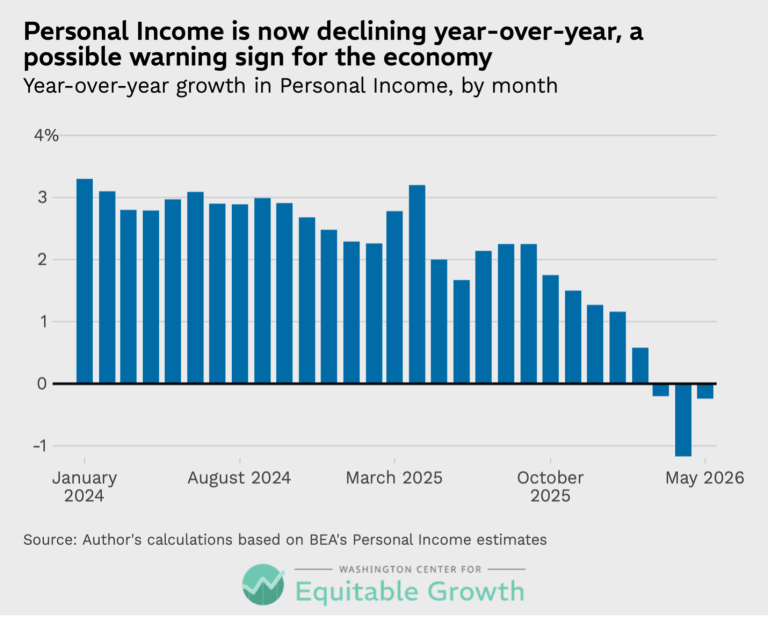
Personal Income is now declining year-over-year, a possible warning sign for the economy (opens in a new tab)
Visualizations Jun 25, 2026
 View Chart
(opens in a new tab)
View Chart
(opens in a new tab)
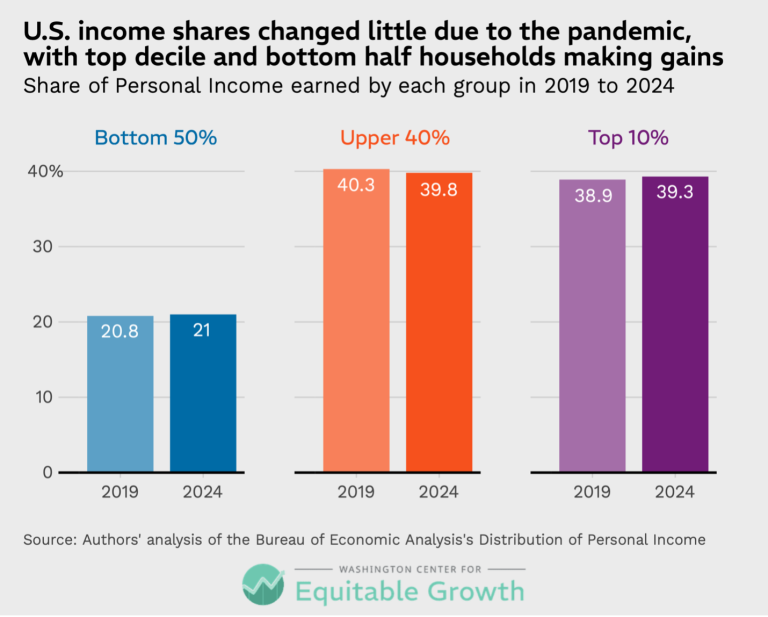
U.S. income shares changed little due to the pandemic, with top decile and bottom half households making gains (opens in a new tab)
Visualizations Jun 24, 2026
 View Chart
(opens in a new tab)
View Chart
(opens in a new tab)
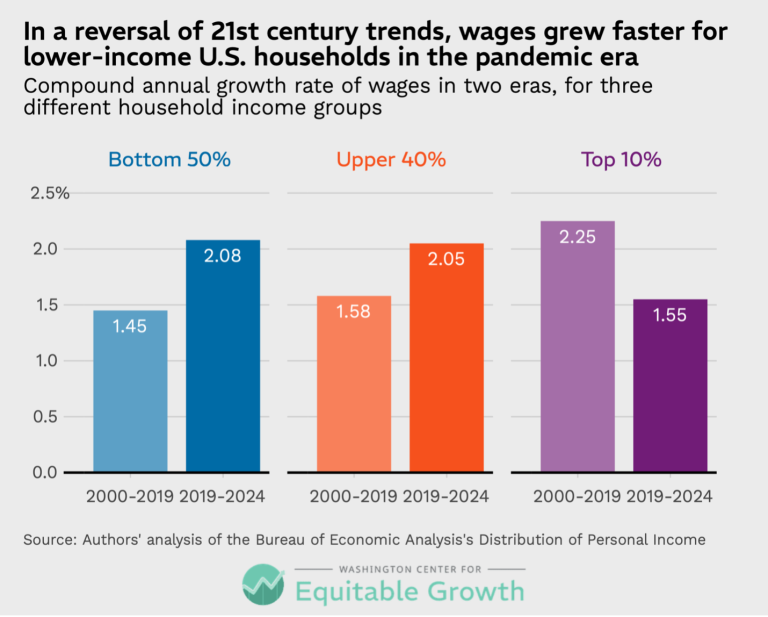
In a reversal of 21st century trends, wages grew faster for lower-income U.S. households in the pandemic era (opens in a new tab)
Visualizations Jun 24, 2026
 View Chart
(opens in a new tab)
View Chart
(opens in a new tab)
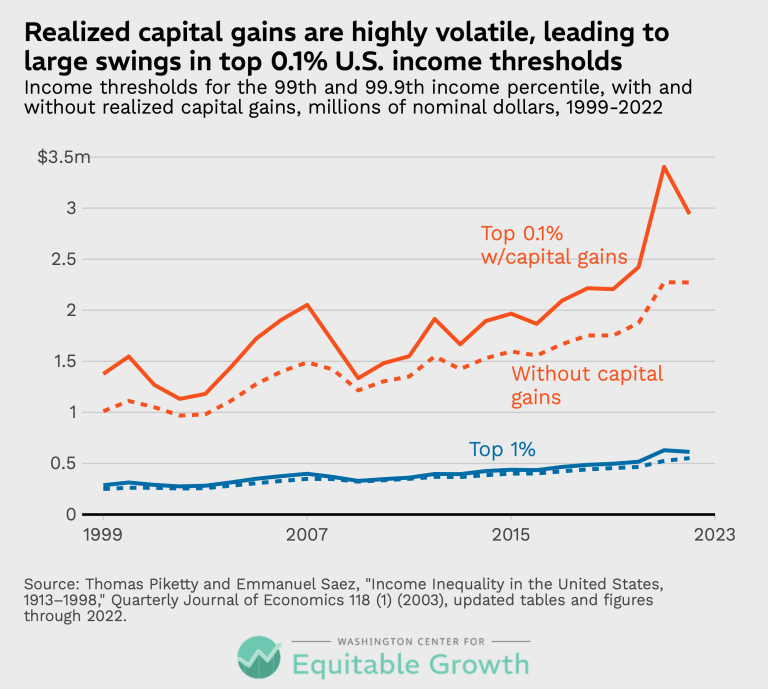
Realized capital gains are highly volatile, leading to large swings in the top 0.1% U.S. income thresholds (opens in a new tab)
Visualizations May 26, 2026
 View Chart
(opens in a new tab)
View Chart
(opens in a new tab)
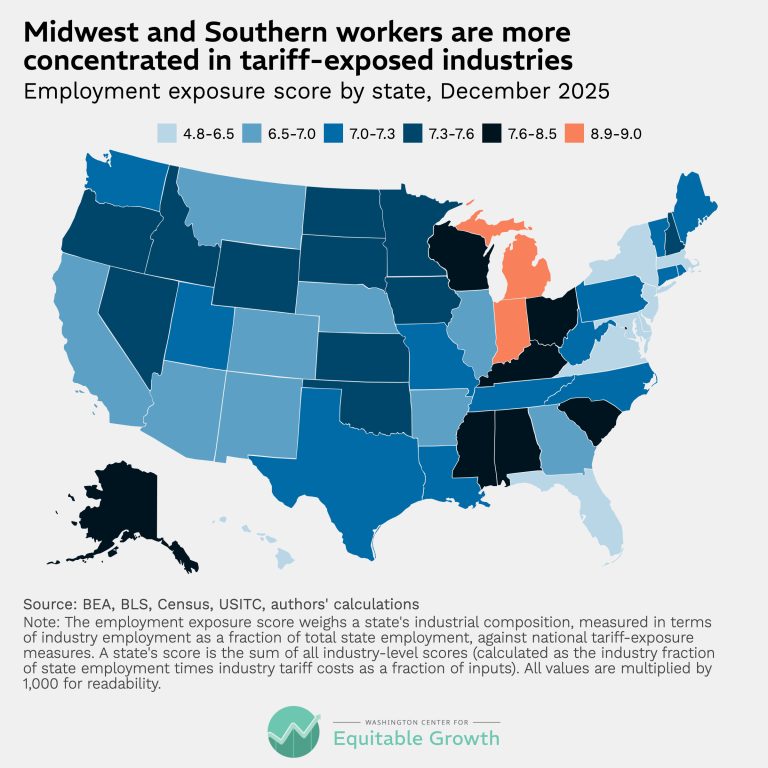
Midwest and Southern workers are more concentrated in tariff-exposed industries (opens in a new tab)
Visualizations Mar 17, 2026
 View Chart
(opens in a new tab)
View Chart
(opens in a new tab)
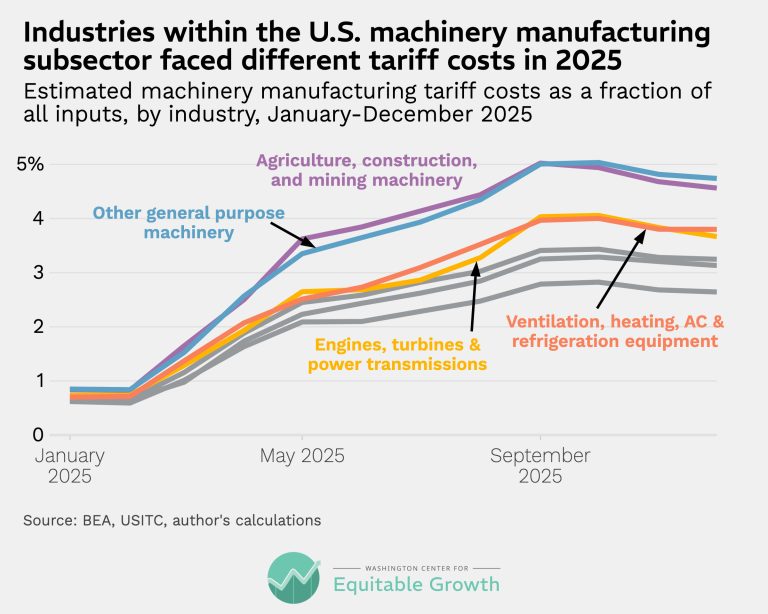
Industries within the U.S. machinery manufacturing subsector faced different tariff costs in 2025 (opens in a new tab)
Visualizations Mar 17, 2026
 View Chart
(opens in a new tab)
View Chart
(opens in a new tab)
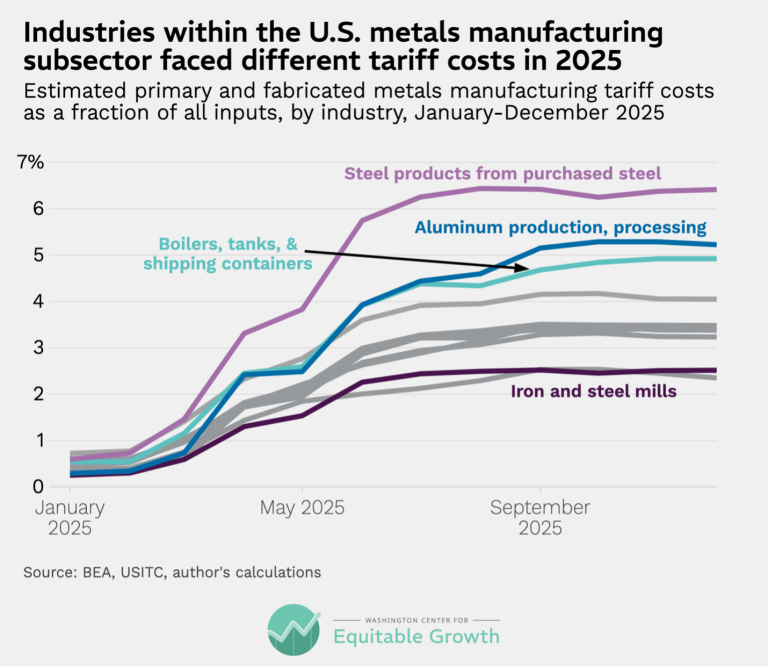
Industries within the U.S. metals manufacturing subsector faced different tariff costs in 2025 (opens in a new tab)
Visualizations Mar 17, 2026
 View Chart
(opens in a new tab)
View Chart
(opens in a new tab)
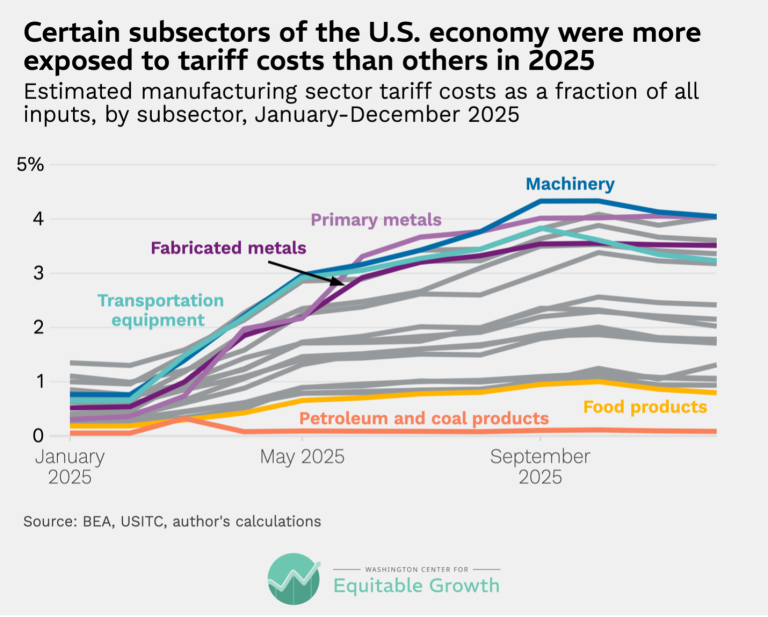
Certain subsectors of the U.S. economy were more exposed to tariff costs than others in 2025 (opens in a new tab)
Visualizations Mar 17, 2026
 View Chart
(opens in a new tab)
View Chart
(opens in a new tab)
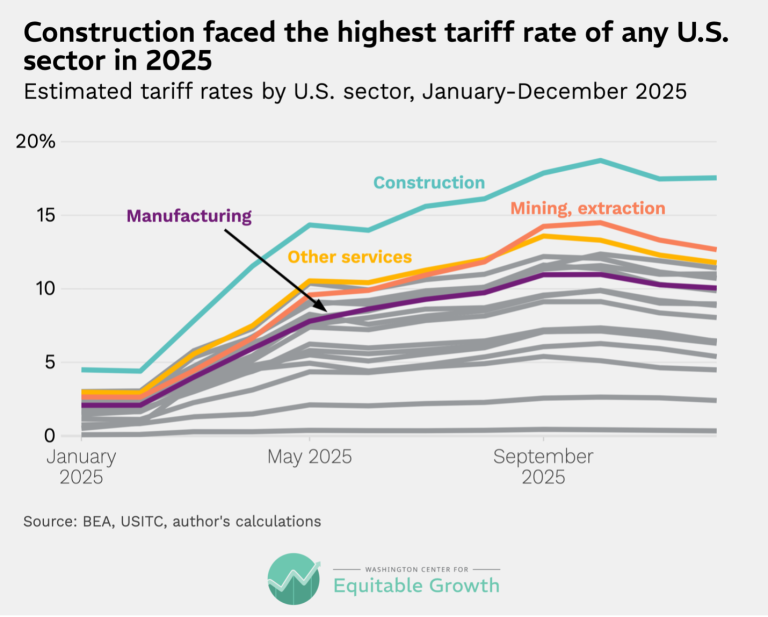
Construction faced the highest tariff rate of any U.S. sector in 2025 (opens in a new tab)
Visualizations Mar 17, 2026
 View Chart
(opens in a new tab)
View Chart
(opens in a new tab)
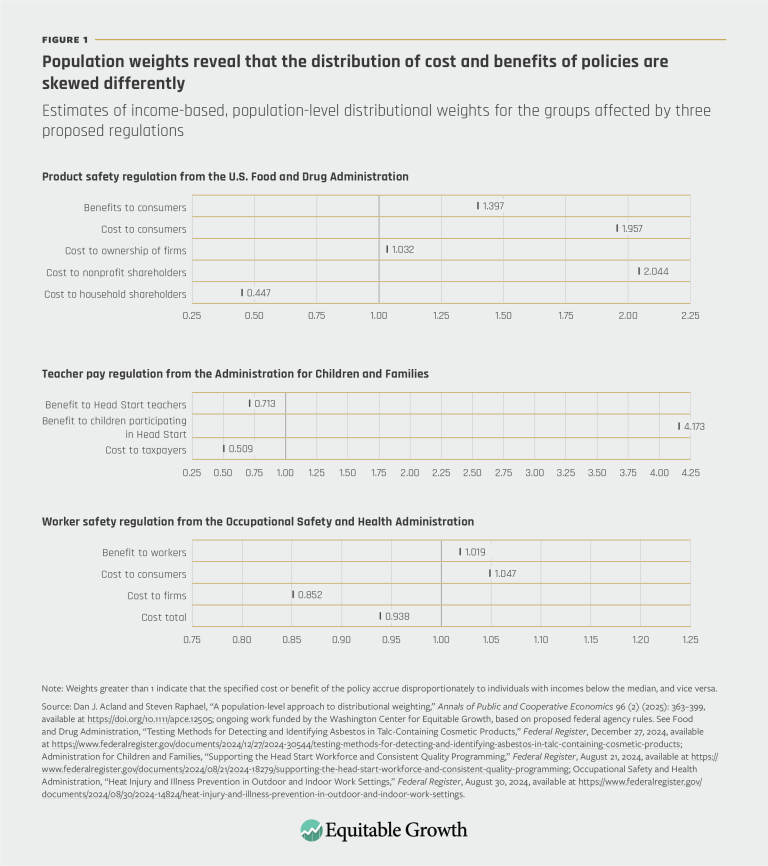
Population weights reveal that the distribution of cost and benefits of policies are skewed differently (opens in a new tab)
Visualizations Nov 13, 2025
 View Chart
(opens in a new tab)
View Chart
(opens in a new tab)
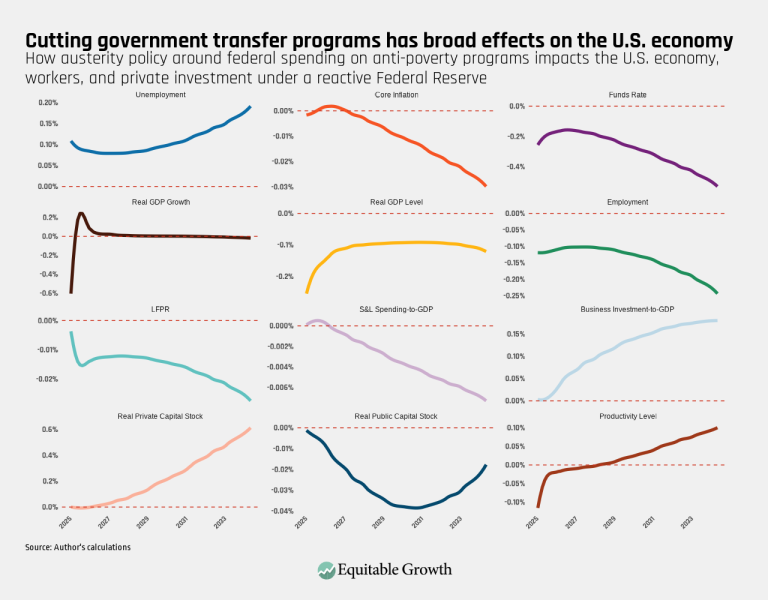
Cutting government transfer programs has broad effects on the U.S. economy (opens in a new tab)
Visualizations Aug 12, 2025
 View Chart
(opens in a new tab)
View Chart
(opens in a new tab)
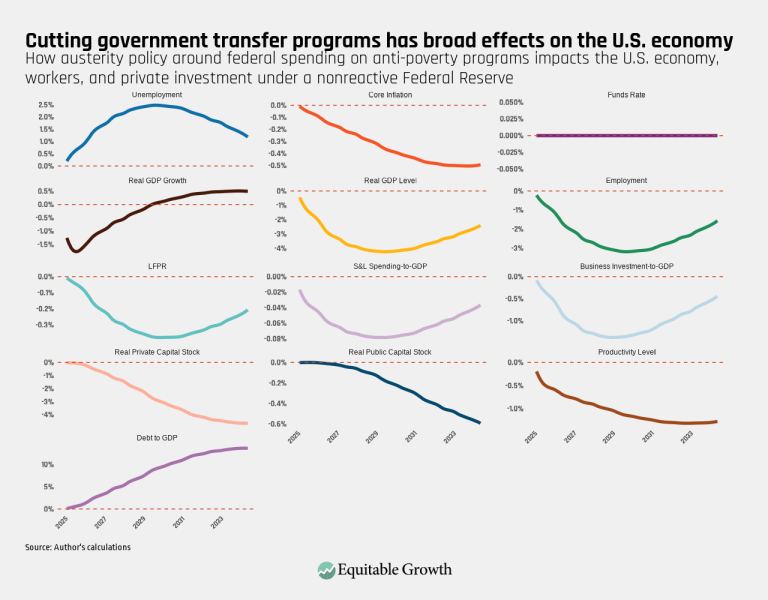
Cutting government transfer programs has broad effects on the U.S. economy (opens in a new tab)
Visualizations Aug 12, 2025
 View Chart
(opens in a new tab)
View Chart
(opens in a new tab)
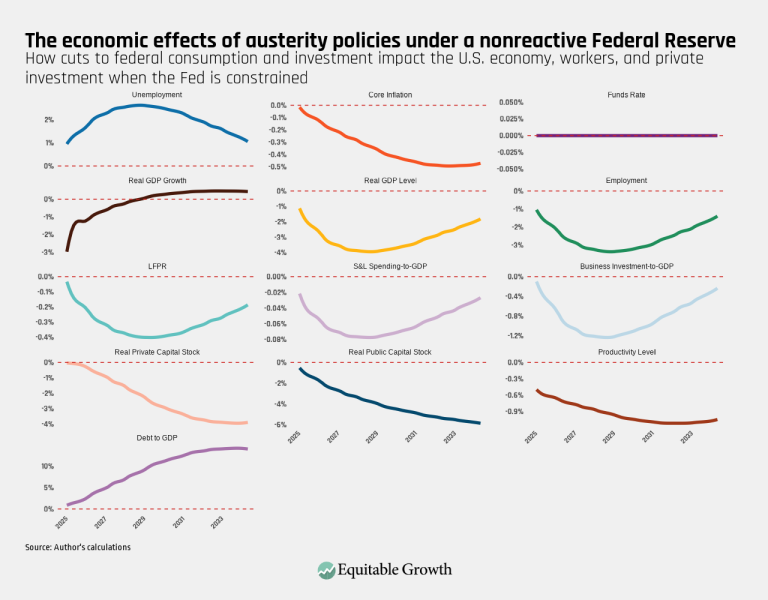
The economic effects of austerity policies under a nonreactive Federal Reserve – Final (opens in a new tab)
Visualizations Aug 12, 2025
 View Chart
(opens in a new tab)
View Chart
(opens in a new tab)
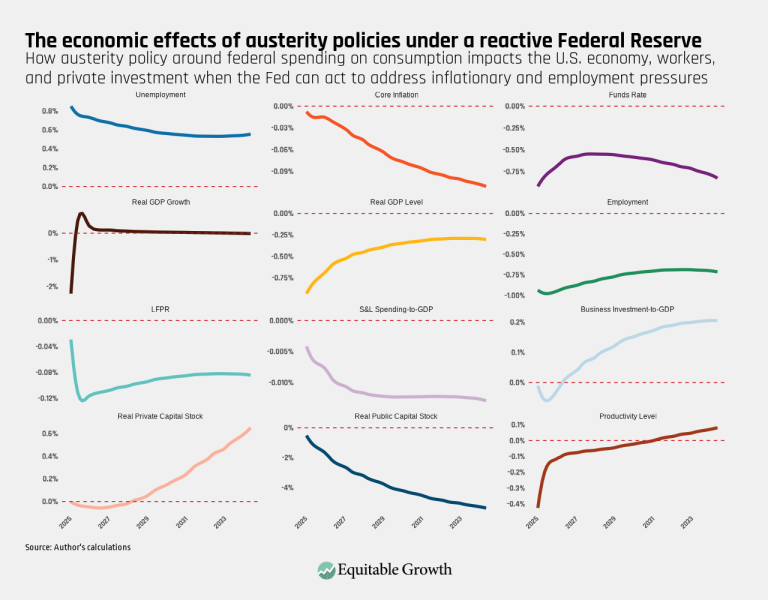
The economic effects of austerity policies under a reactive Federal Reserve (opens in a new tab)
Visualizations Aug 12, 2025
 View Chart
(opens in a new tab)
View Chart
(opens in a new tab)
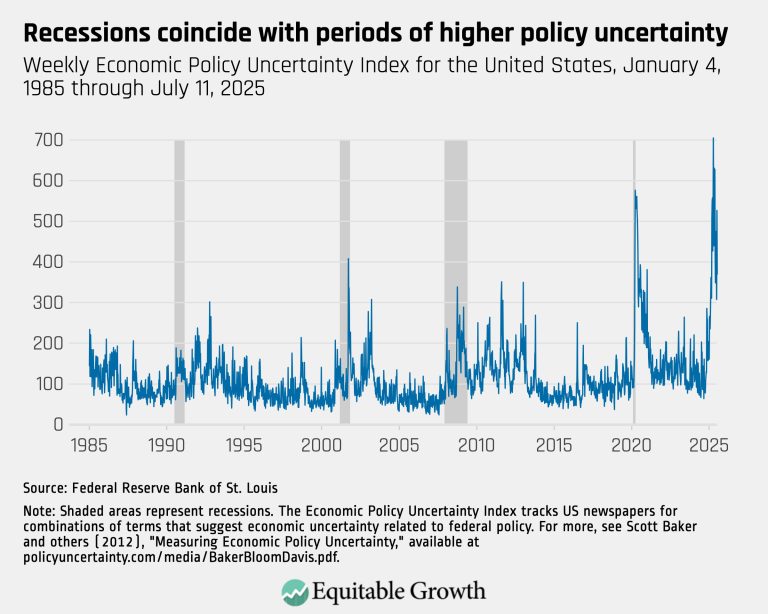
Recessions coincide with periods of higher policy uncertainty – updated (opens in a new tab)
Visualizations Aug 7, 2025
 View Chart
(opens in a new tab)
View Chart
(opens in a new tab)
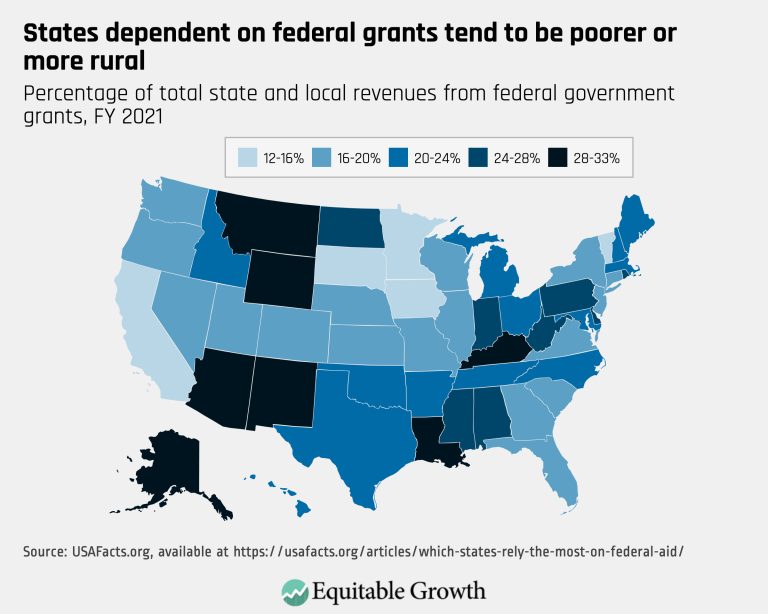
States dependent on federal grants tend to be poorer or more rural (opens in a new tab)
Visualizations Aug 7, 2025
 View Chart
(opens in a new tab)
View Chart
(opens in a new tab)
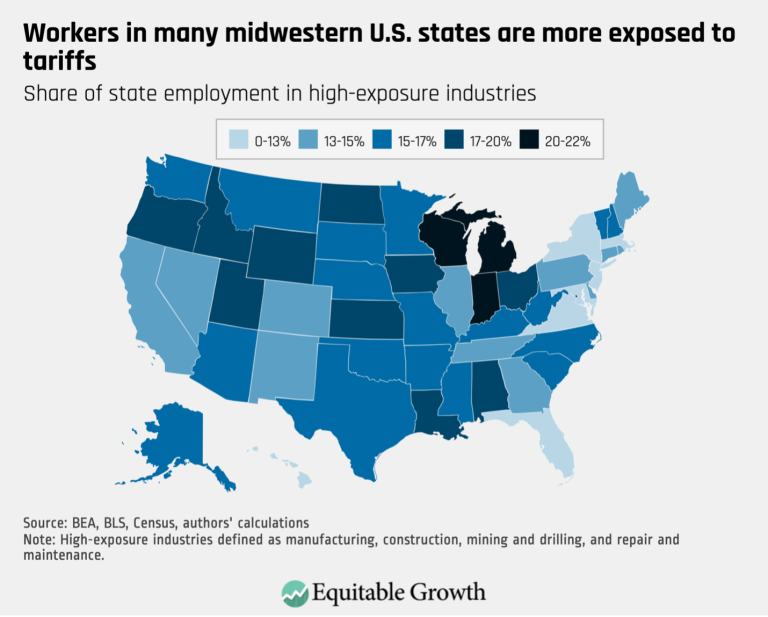
Workers in many midwestern U.S. states are more exposed to tariffs (opens in a new tab)
Visualizations Jul 28, 2025
 View Chart
(opens in a new tab)
View Chart
(opens in a new tab)
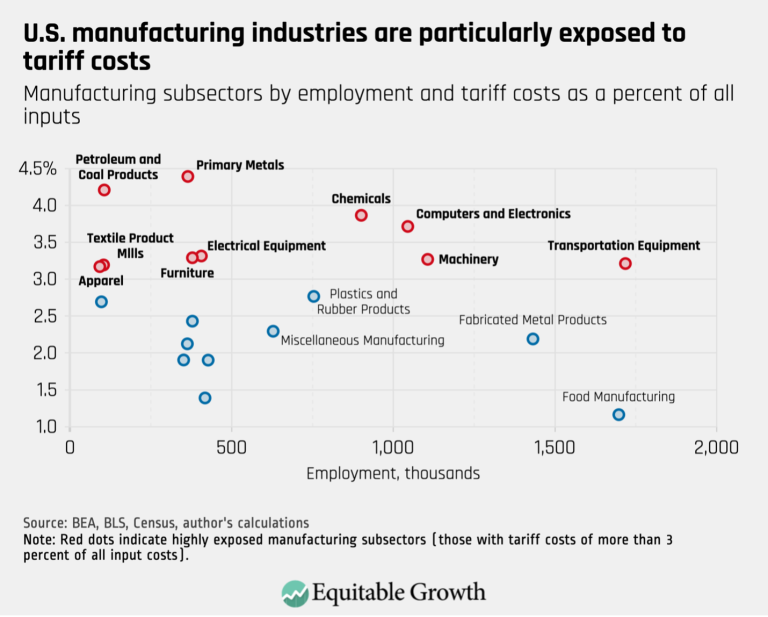
U.S. manufacturing industries are particularly exposed to tariff costs (opens in a new tab)
Visualizations Jul 28, 2025
 View Chart
(opens in a new tab)
View Chart
(opens in a new tab)
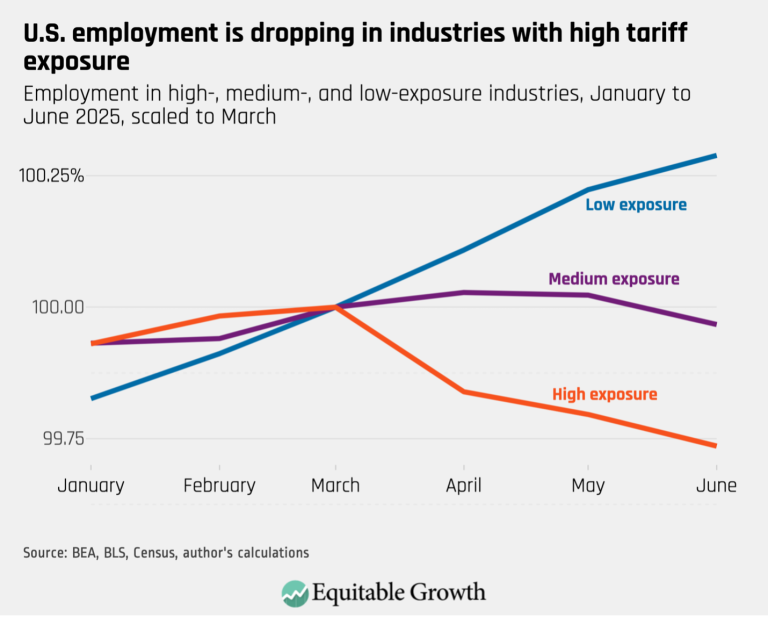
U.S. employment is dropping in industries with high tariff exposure (opens in a new tab)
Visualizations Jul 28, 2025
 View Chart
(opens in a new tab)
View Chart
(opens in a new tab)
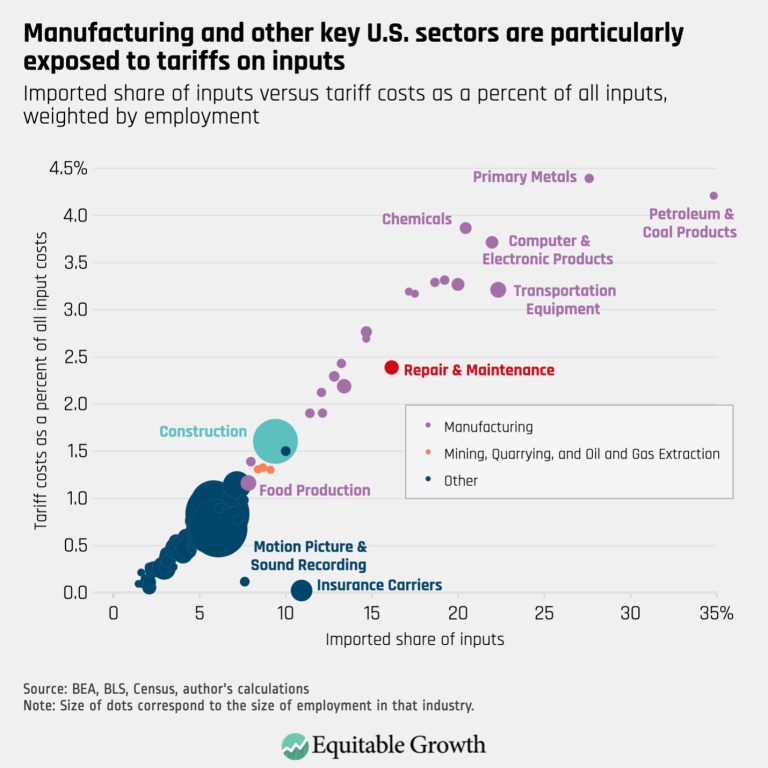
Manufacturing and other key U.S. sectors are particularly exposed to tariffs on inputs (opens in a new tab)
Visualizations Jul 28, 2025
 View Chart
(opens in a new tab)
View Chart
(opens in a new tab)
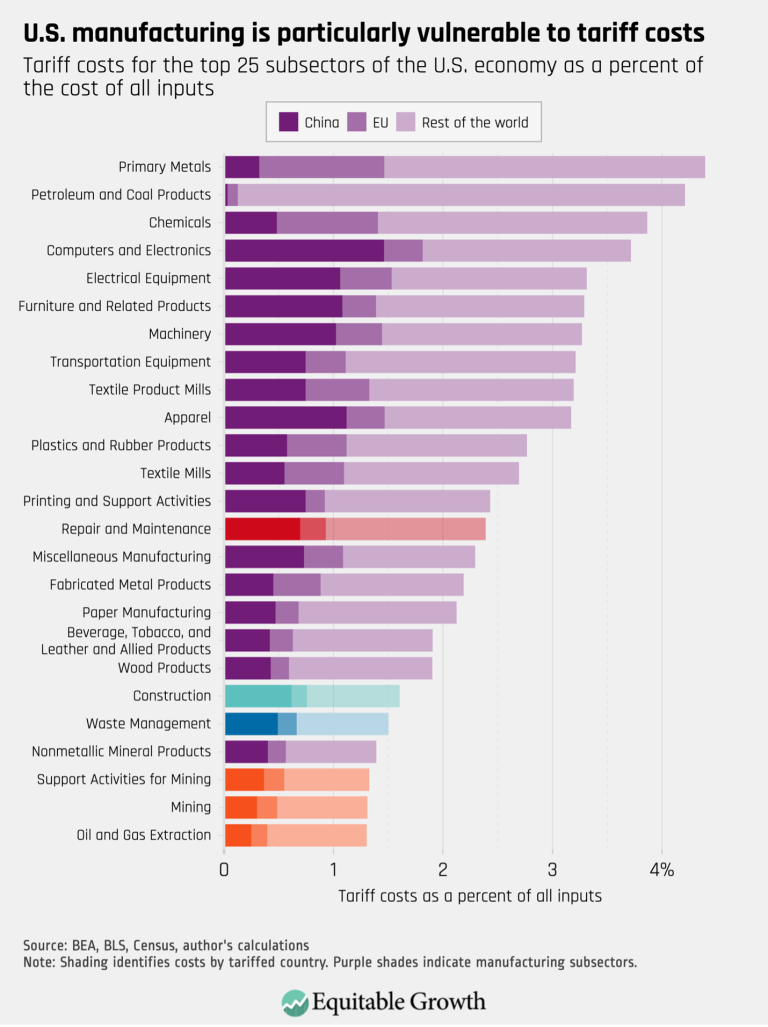
U.S. manufacturing is particularly vulnerable to tariff costs (opens in a new tab)
Visualizations Jul 28, 2025
 View Chart
(opens in a new tab)
View Chart
(opens in a new tab)
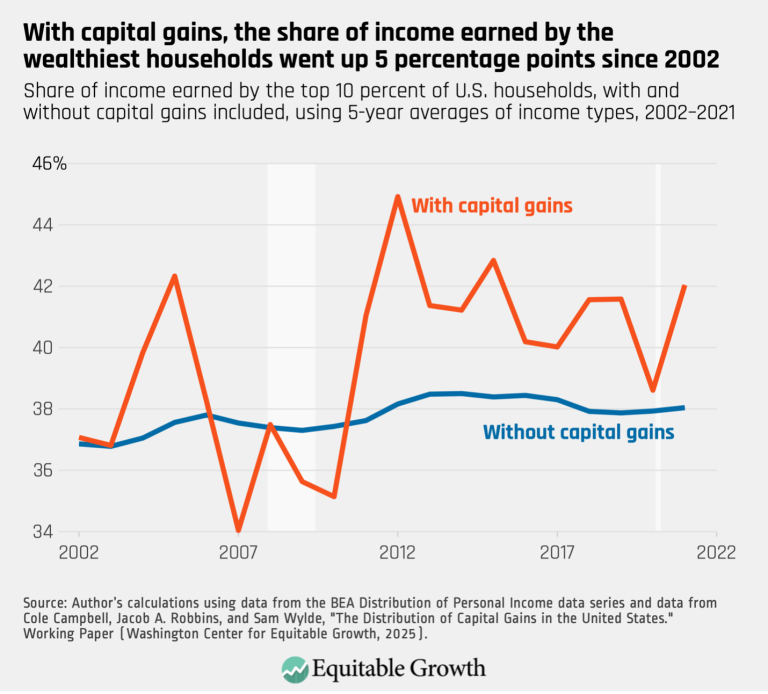
With capital gains, the share of income earned by the wealthiest households went up 5 percentage points since 2002 (opens in a new tab)
Visualizations Jul 14, 2025
 View Chart
(opens in a new tab)
View Chart
(opens in a new tab)
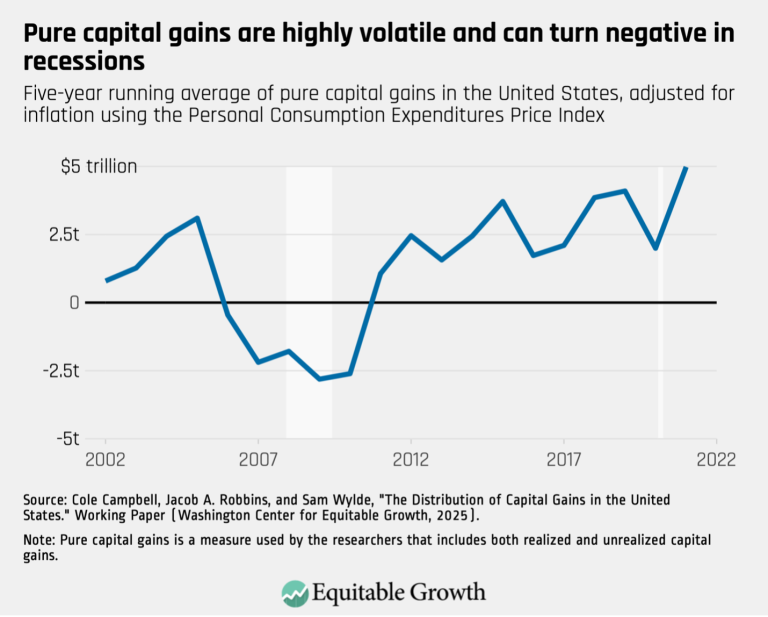
Pure capital gains are highly volatile and can turn negative in recessions (opens in a new tab)
Visualizations Jul 14, 2025
 View Chart
(opens in a new tab)
View Chart
(opens in a new tab)
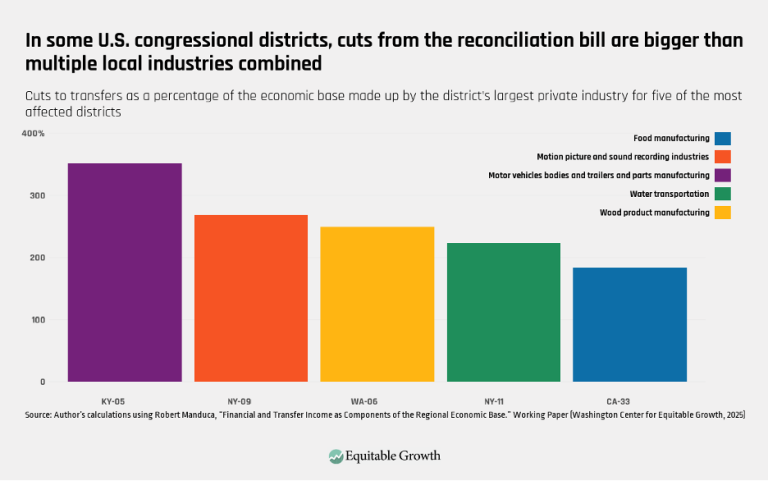
In some U.S. congressional districts, cuts from the reconciliation bill are bigger than multiple local industries combined (opens in a new tab)
Visualizations Jul 10, 2025
 View Chart
(opens in a new tab)
View Chart
(opens in a new tab)
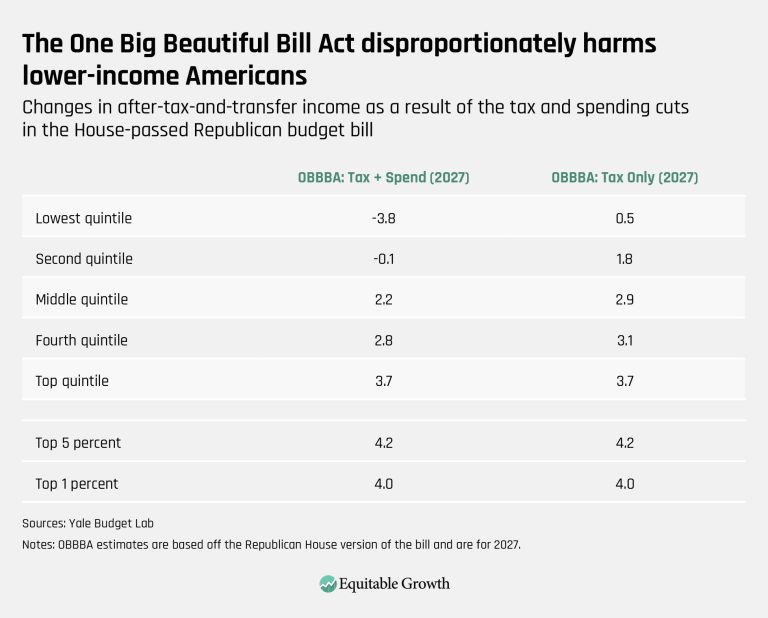
The One Big Beautiful Bill Act disproportionately harms lower-income Americans (opens in a new tab)
Visualizations Jul 3, 2025
 View Chart
(opens in a new tab)
View Chart
(opens in a new tab)
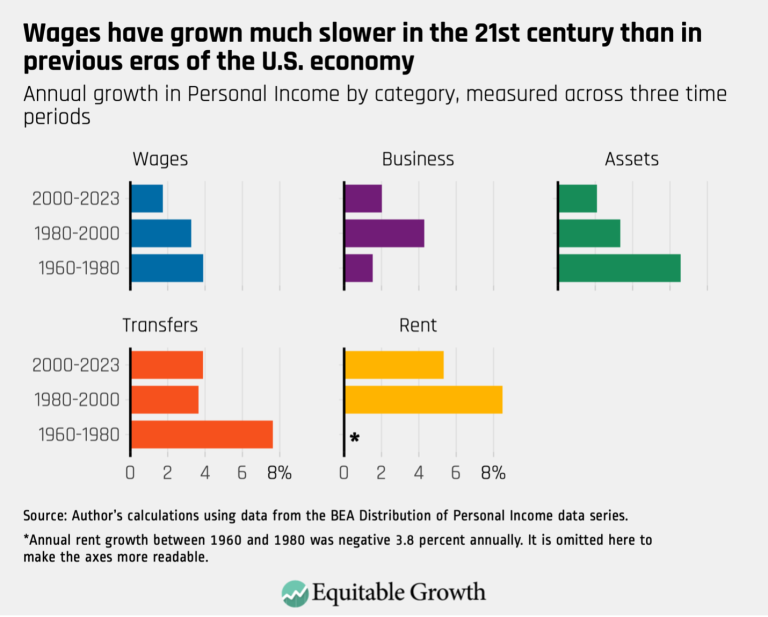
Wages have grown much slower in the 21st century than in previous eras of the U.S. economy (opens in a new tab)
Visualizations Jun 25, 2025
 View Chart
(opens in a new tab)
View Chart
(opens in a new tab)
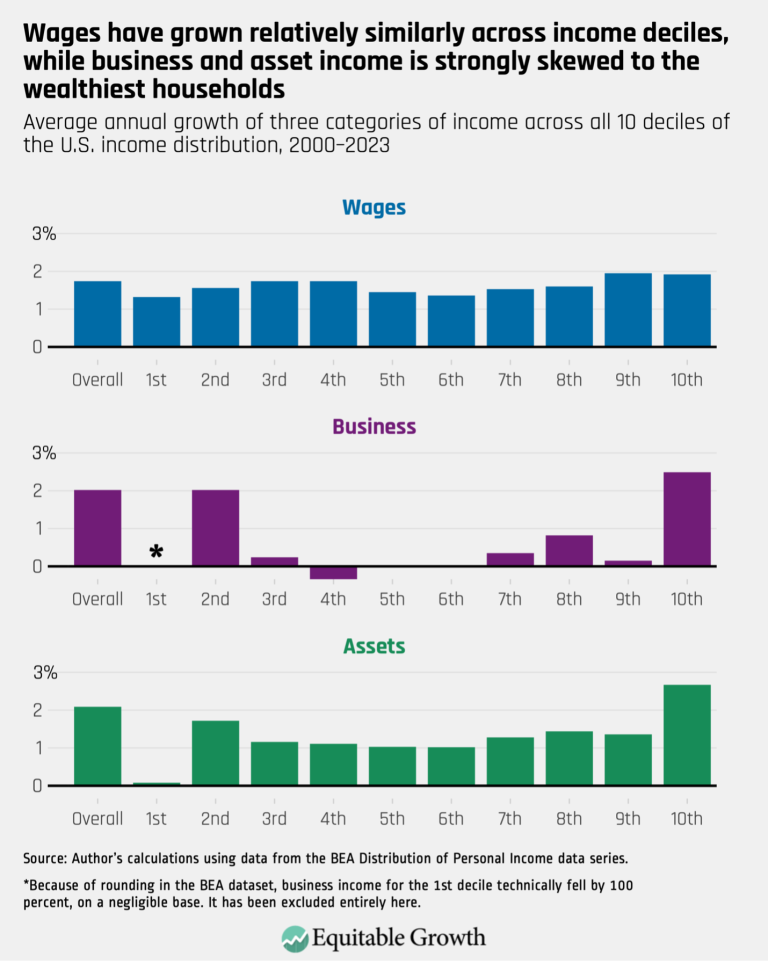
Wages have grown relatively similarly across income deciles, while business and asset income is strongly skewed to the wealthiest households (opens in a new tab)
Visualizations Jun 25, 2025
 View Chart
(opens in a new tab)
View Chart
(opens in a new tab)
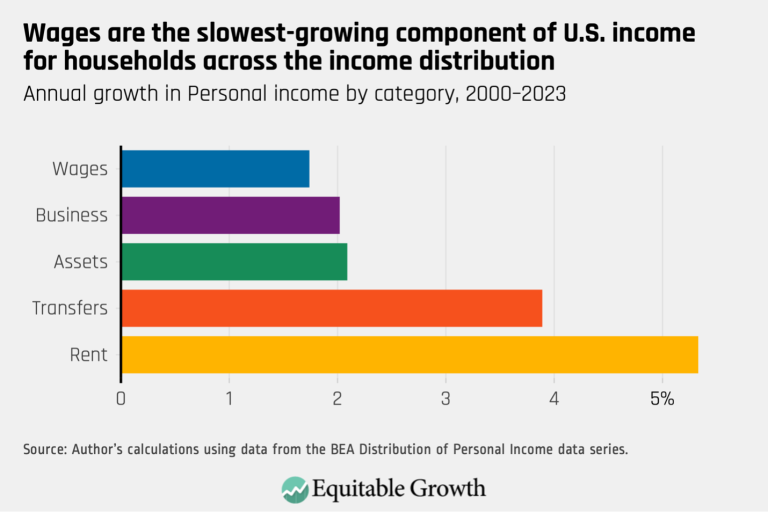
Wages are the slowest-growing component of U.S. income for households across the income distribution (opens in a new tab)
Visualizations Jun 25, 2025
 View Chart
(opens in a new tab)
View Chart
(opens in a new tab)
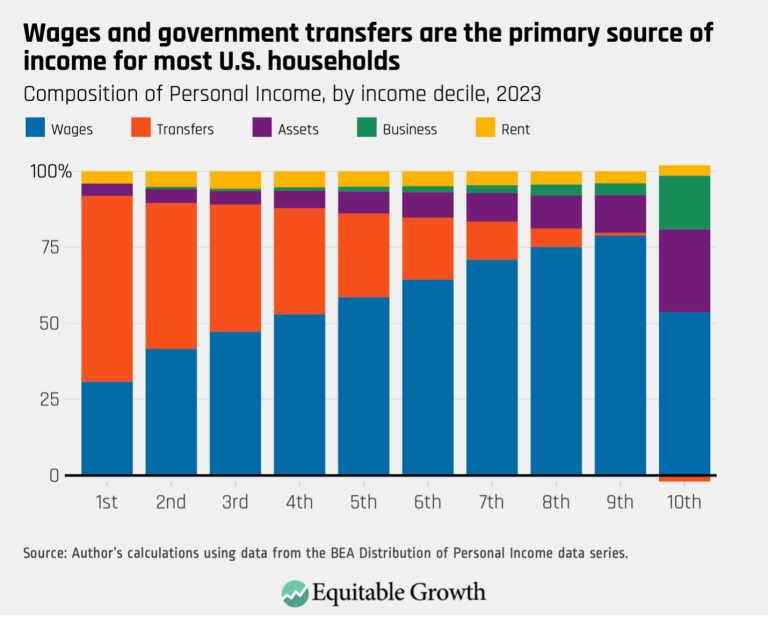
Wages and government transfers are the primary source of income for most U.S. households (opens in a new tab)
Visualizations Jun 25, 2025
 View Chart
(opens in a new tab)
View Chart
(opens in a new tab)
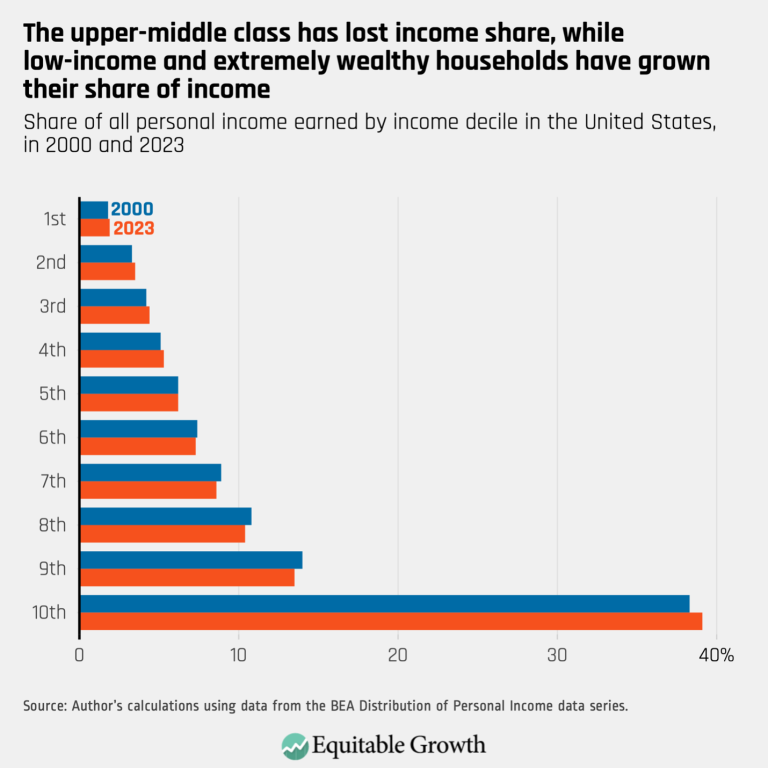
The upper-middle class has lost income share, while low-income and extremely wealthy households have grown their share of income (opens in a new tab)
Visualizations Jun 25, 2025
 View Chart
(opens in a new tab)
View Chart
(opens in a new tab)
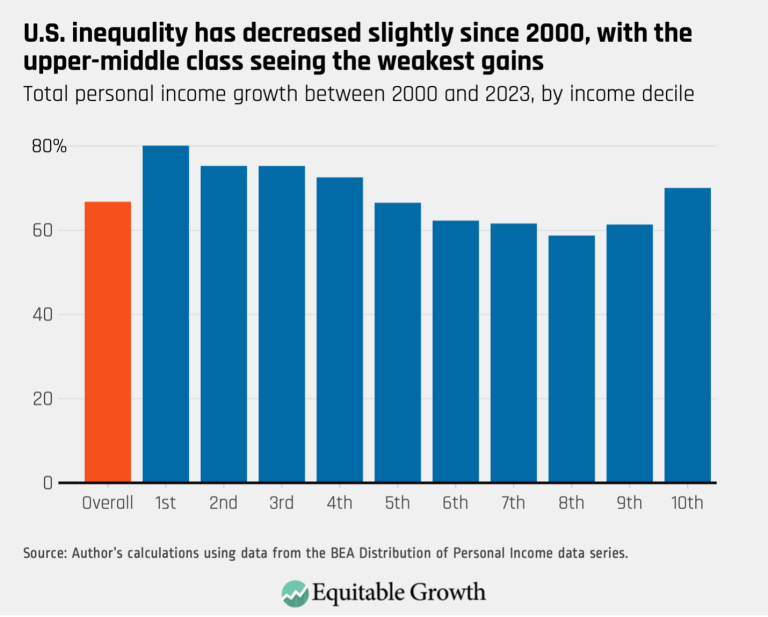
U.S. inequality has decreased slightly since 2000, with the upper-middle class seeing the weakest gains (opens in a new tab)
Visualizations Jun 25, 2025
 View Chart
(opens in a new tab)
View Chart
(opens in a new tab)
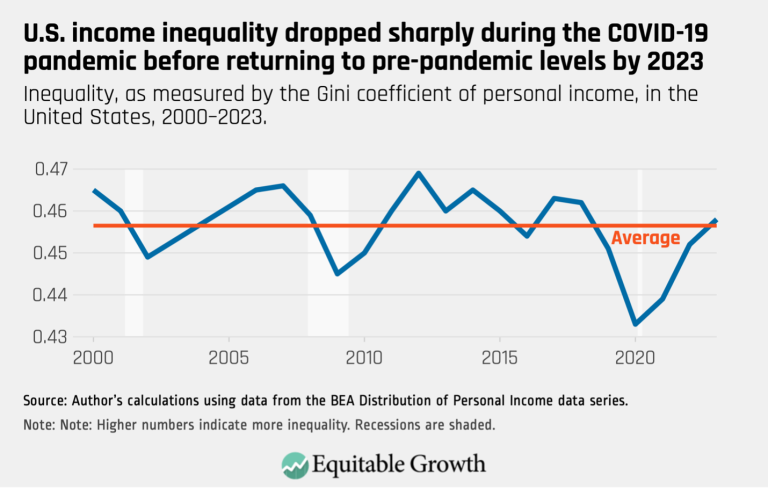
U.S. income inequality dropped sharply during the COVID-19 pandemic before returning to pre-pandemic levels by 2023 (opens in a new tab)
Visualizations Jun 25, 2025
 View Chart
(opens in a new tab)
View Chart
(opens in a new tab)
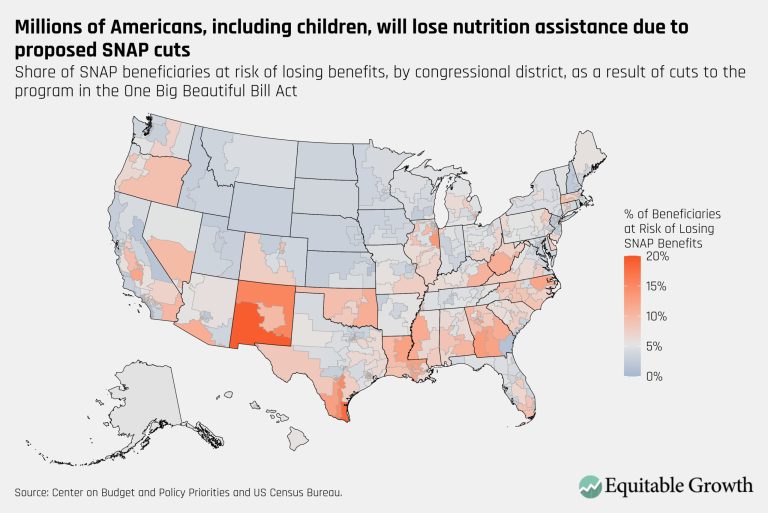
Millions of Americans, including children, will lose nutrition assistance due to proposed SNAP cuts – updated (opens in a new tab)
Visualizations Jun 24, 2025
 View Chart
(opens in a new tab)
View Chart
(opens in a new tab)
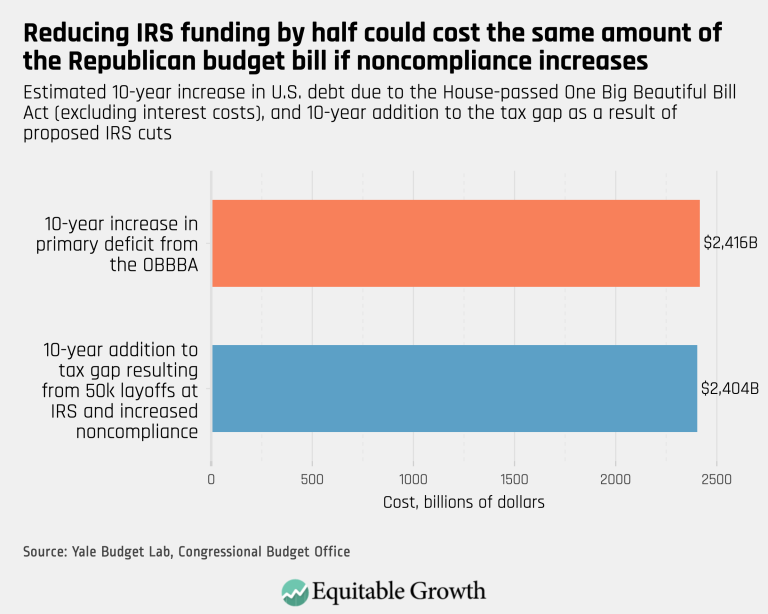
Reducing IRS funding by half could cost the same amount of the Republican budget bill in noncompliance increases (opens in a new tab)
Visualizations Jun 23, 2025
 View Chart
(opens in a new tab)
View Chart
(opens in a new tab)
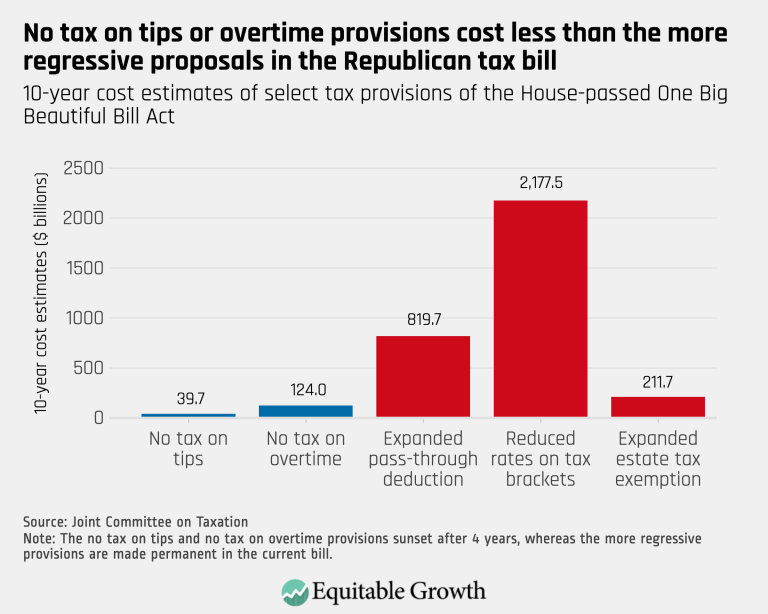
No tax on tips or overtime provisions cost less than the more regressive proposals in the Republican tax bill (opens in a new tab)
Visualizations Jun 23, 2025
 View Chart
(opens in a new tab)
View Chart
(opens in a new tab)
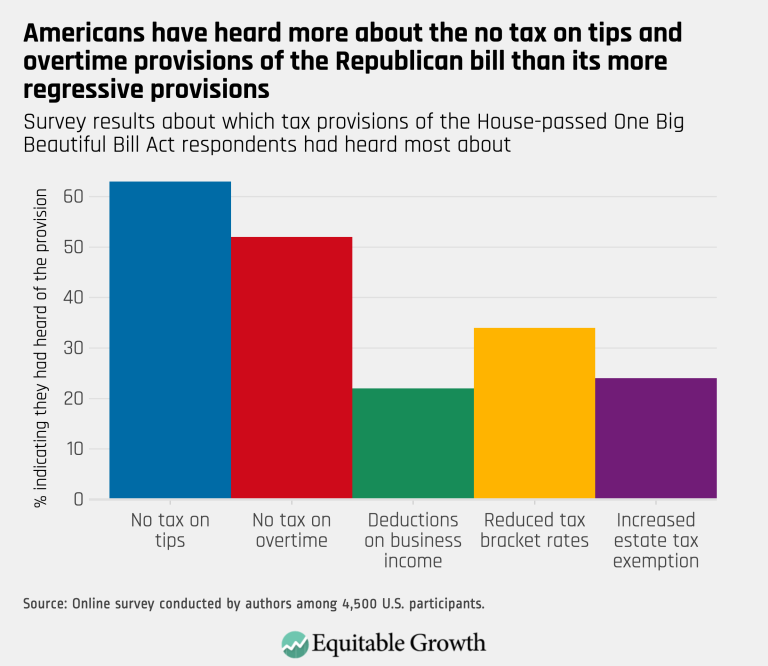
Americans have heard more about the no tax on tips and overtime provisions of the Republican bill than its more regressive provisions (opens in a new tab)
Visualizations Jun 23, 2025
 View Chart
(opens in a new tab)
View Chart
(opens in a new tab)
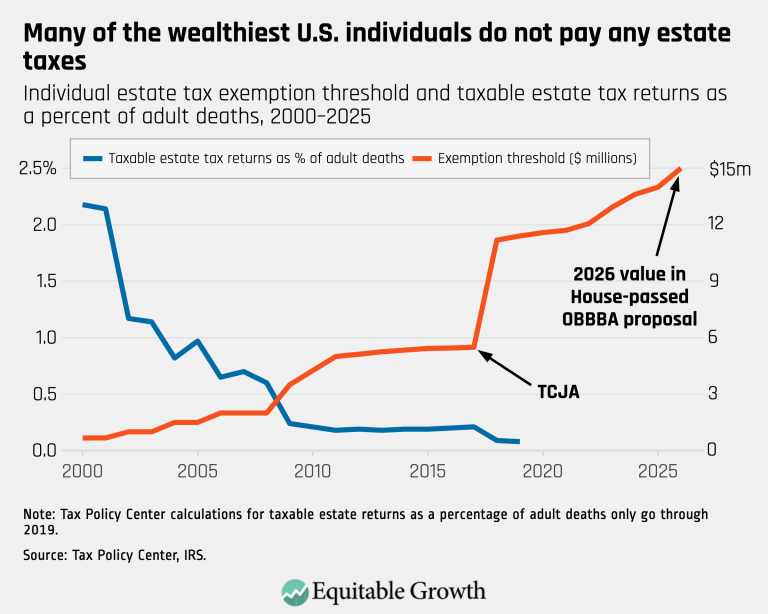
Many of the wealthiest U.S. individuals do not pay any estate taxes (opens in a new tab)
Visualizations Jun 23, 2025
 View Chart
(opens in a new tab)
View Chart
(opens in a new tab)
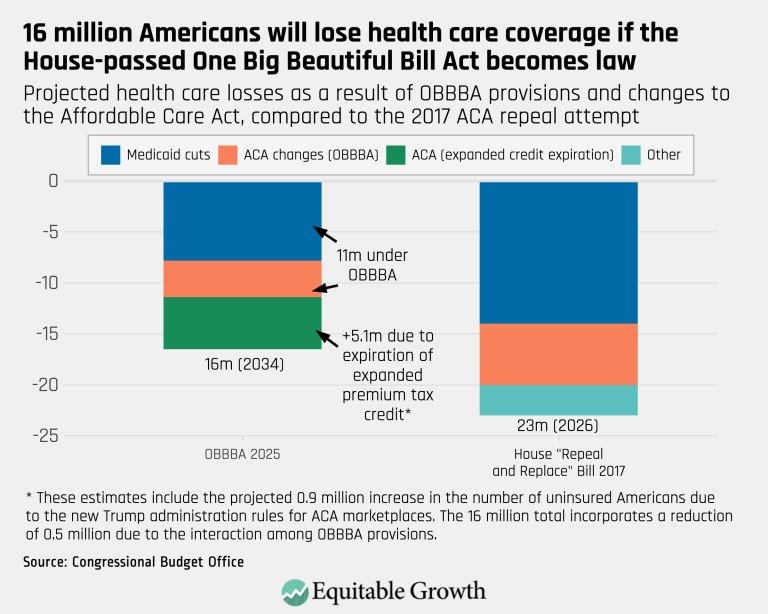
16 million Americans will lose health care coverage if the House-passed One Big Beautiful Bill Act becomes law (opens in a new tab)
Visualizations Jun 23, 2025
 View Chart
(opens in a new tab)
View Chart
(opens in a new tab)
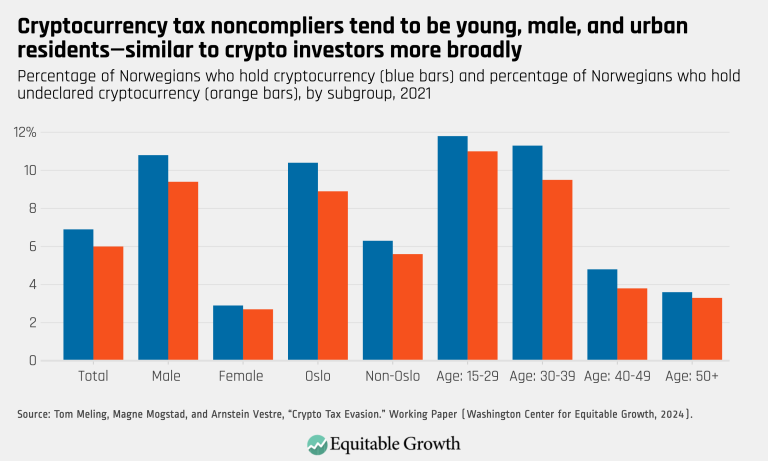
Cryptocurrency tax noncompliers tend to be young, male, and urban residents-similar to crypto investors more broadly (opens in a new tab)
Visualizations Nov 20, 2024
 View Chart
(opens in a new tab)
View Chart
(opens in a new tab)
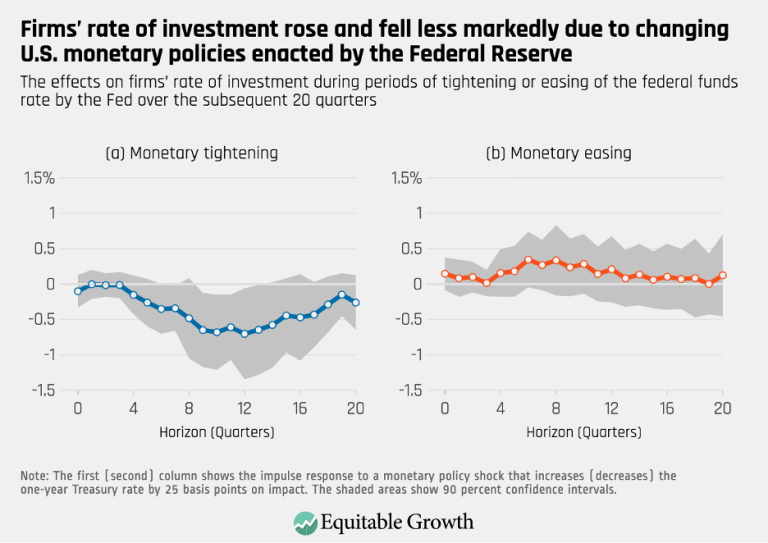
Firms’ rate of investment rose and fell less markedly due to changing U.S. monetary policies enacted by the Federal Reserve (opens in a new tab)
Visualizations Sep 15, 2024
 View Chart
(opens in a new tab)
View Chart
(opens in a new tab)
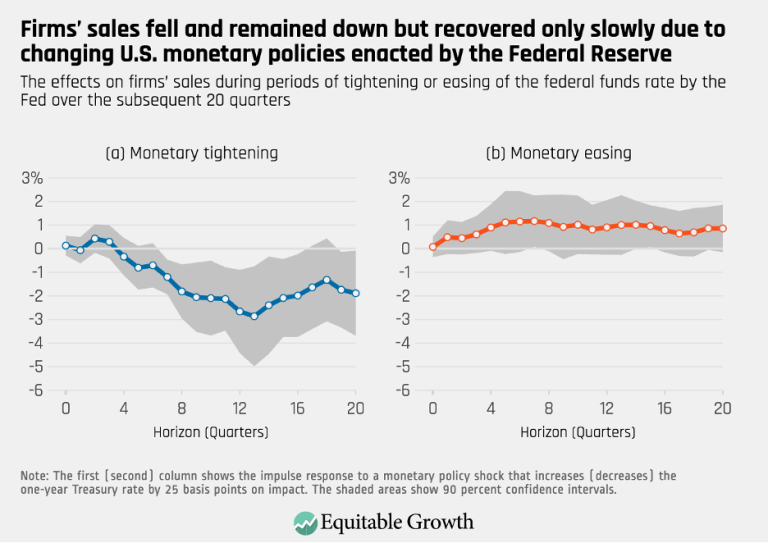
Firms’ sales fell and remained down but recovered only slowly due to changing U.S. monetary policies enacted by the Federal Reserve (opens in a new tab)
Visualizations Sep 15, 2024
 View Chart
(opens in a new tab)
View Chart
(opens in a new tab)
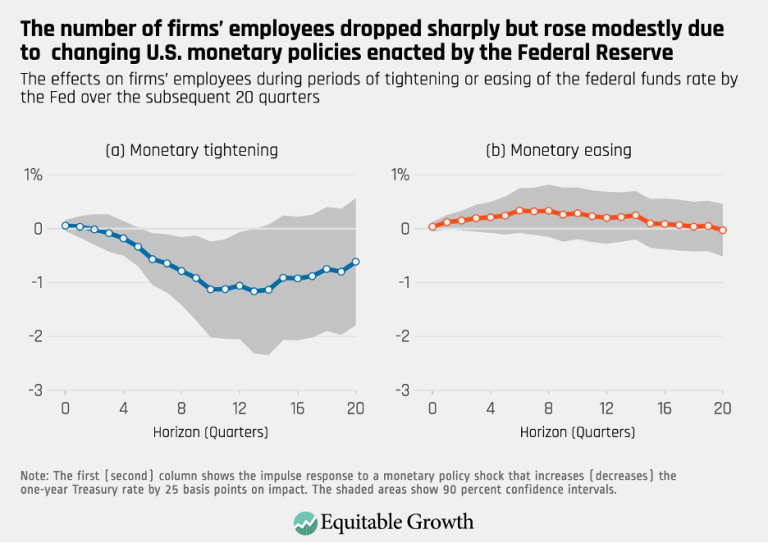
The number of firms’ employees dropped sharply but rose modestly due to changing U.S. monetary policies enacted by the Federal Reserve (opens in a new tab)
Visualizations Sep 15, 2024
 View Chart
(opens in a new tab)
View Chart
(opens in a new tab)
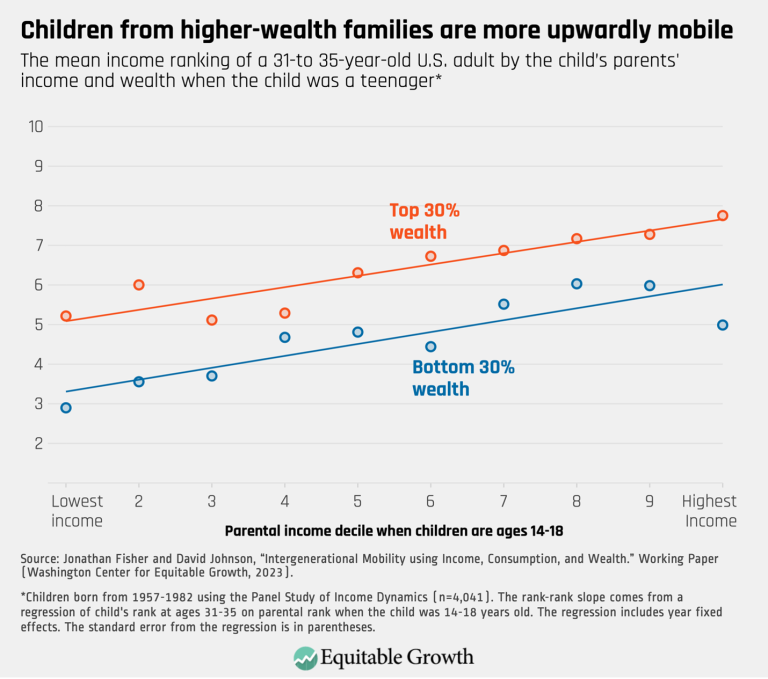
Children from higher-wealth families are more upwardly mobile (opens in a new tab)
Visualizations Apr 19, 2024
 View Chart
(opens in a new tab)
View Chart
(opens in a new tab)
Personal loan delinquency is low or within normal levels for all major loan types (opens in a new tab)
Visualizations Feb 20, 2024
 View Chart
(opens in a new tab)
View Chart
(opens in a new tab)
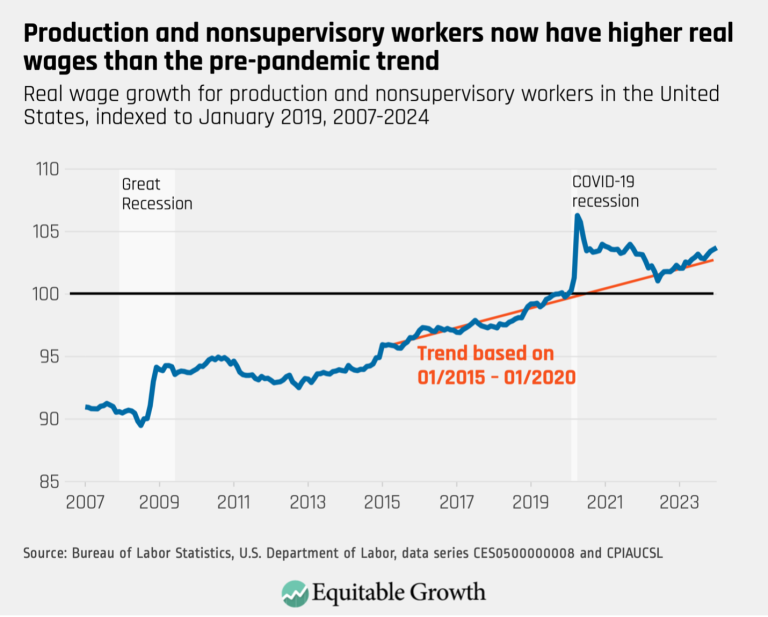
Production and nonsupervisory workers now have higher real wages than the pre-pandemic trend (opens in a new tab)
Visualizations Feb 20, 2024
 View Chart
(opens in a new tab)
View Chart
(opens in a new tab)
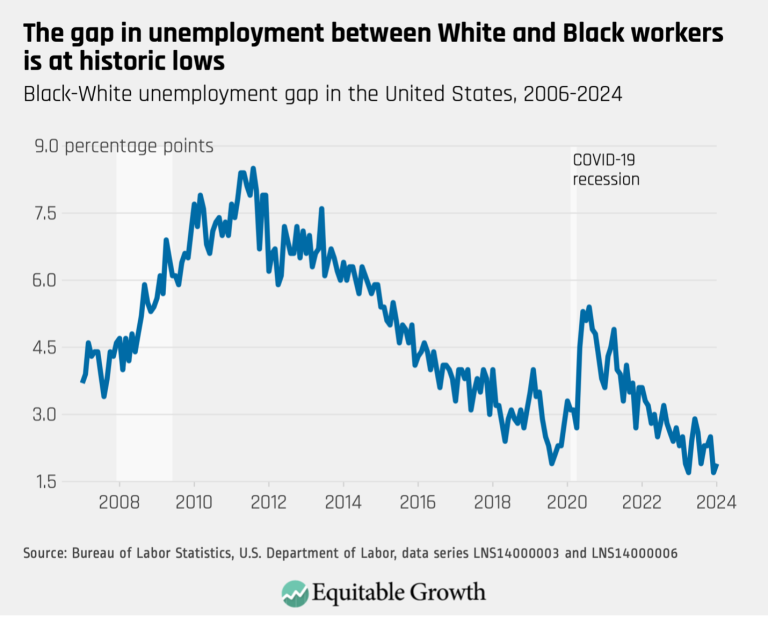
The gap in unemployment between White and Black workers is at historic lows (opens in a new tab)
Visualizations Feb 20, 2024
 View Chart
(opens in a new tab)
View Chart
(opens in a new tab)
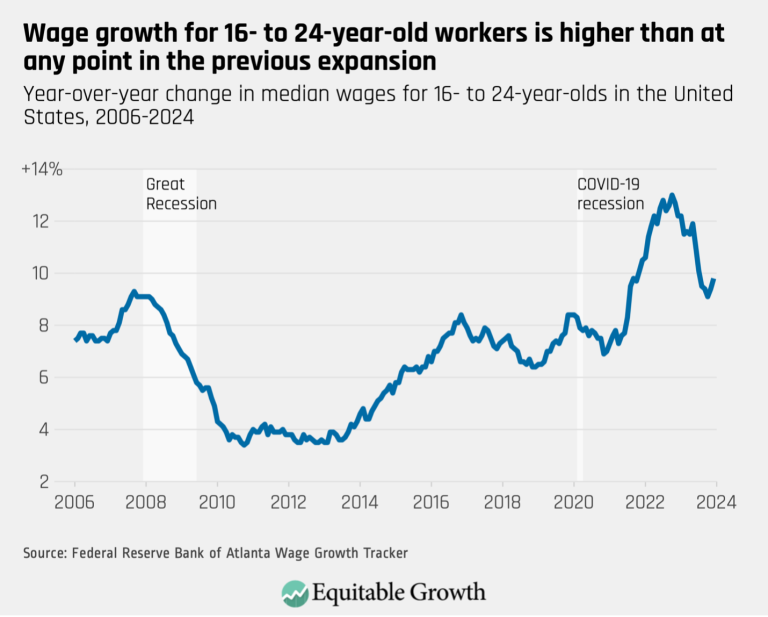
Wage growth for 16- to 24-year-old workers is higher than at any point in the previous expansion (opens in a new tab)
Visualizations Feb 20, 2024
 View Chart
(opens in a new tab)
View Chart
(opens in a new tab)
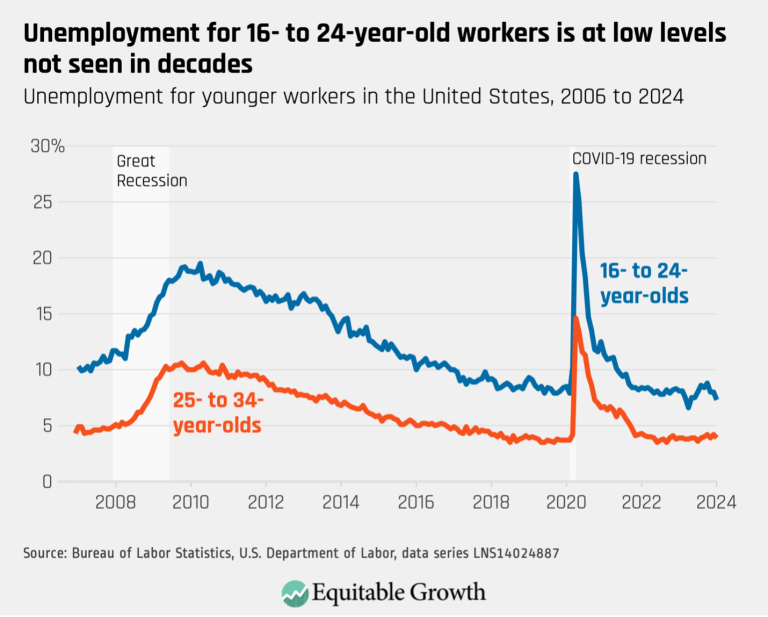
Unemployment for 16- to 24-year-old workers is at low levels not seen in decades (opens in a new tab)
Visualizations Feb 20, 2024
 View Chart
(opens in a new tab)
View Chart
(opens in a new tab)
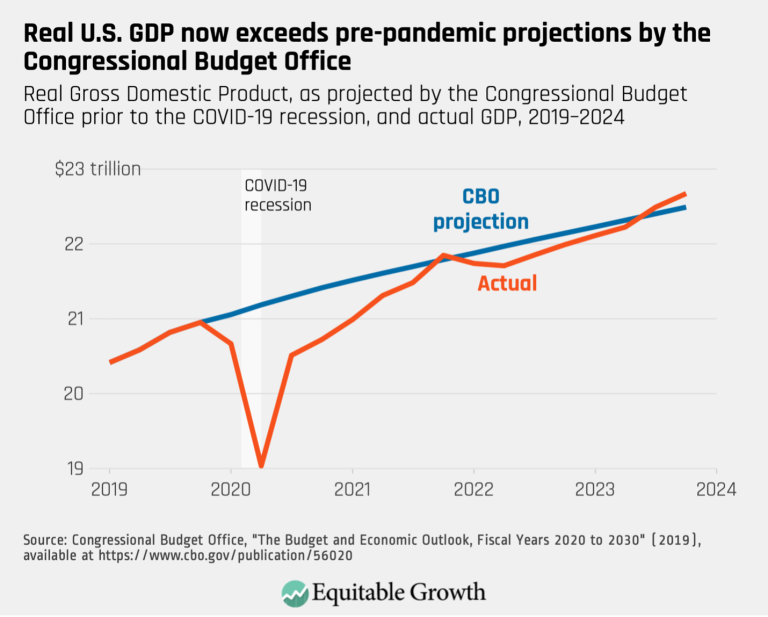
Real U.S. GDP now exceeds pre-pandemic projections by the Congressional budget Office (opens in a new tab)
Visualizations Feb 20, 2024
 View Chart
(opens in a new tab)
View Chart
(opens in a new tab)
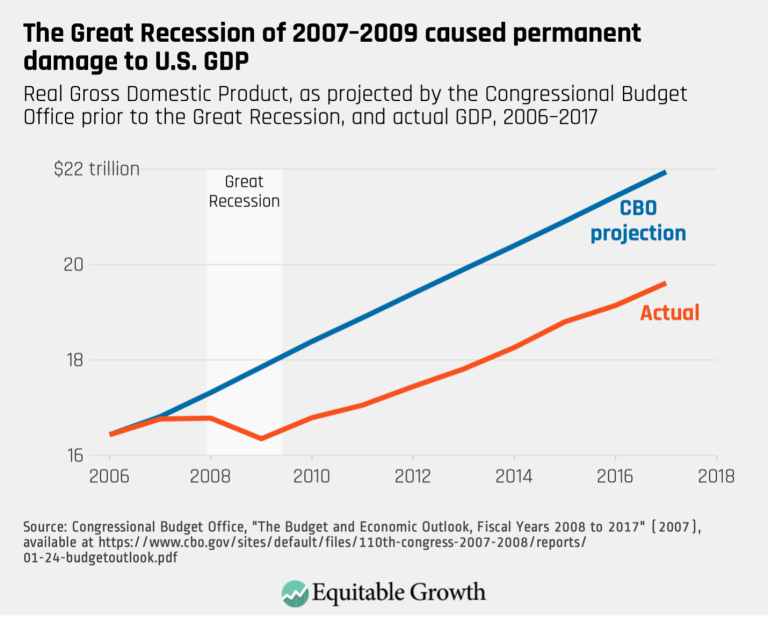
The Great Recession of 2007-2009 caused permanent damage to U.S. GDP (opens in a new tab)
Visualizations Feb 20, 2024
 View Chart
(opens in a new tab)
View Chart
(opens in a new tab)
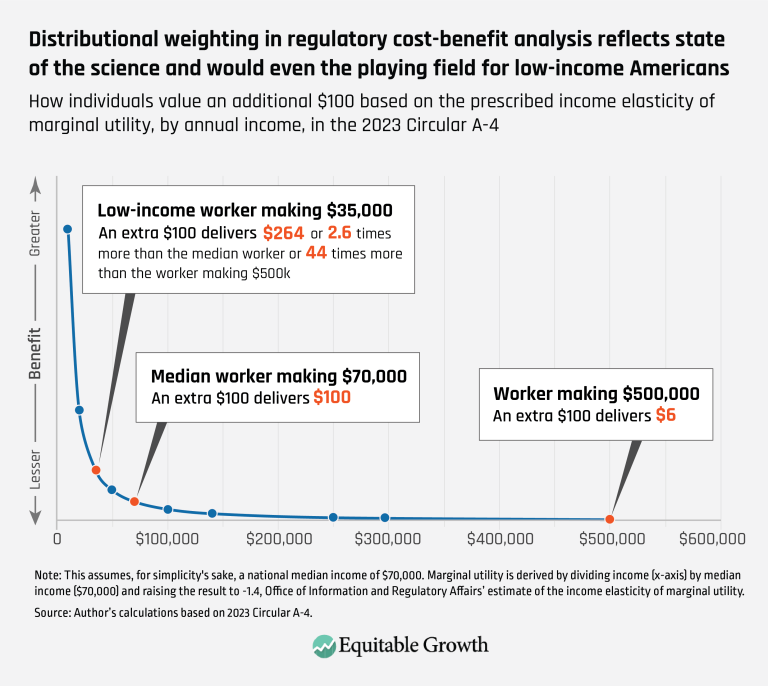
Distributional weighting in regulatory cost-benefit analysis reflects state of the science and would even the playing field for low-income Americans (opens in a new tab)
Visualizations Jan 31, 2024
 View Chart
(opens in a new tab)
View Chart
(opens in a new tab)
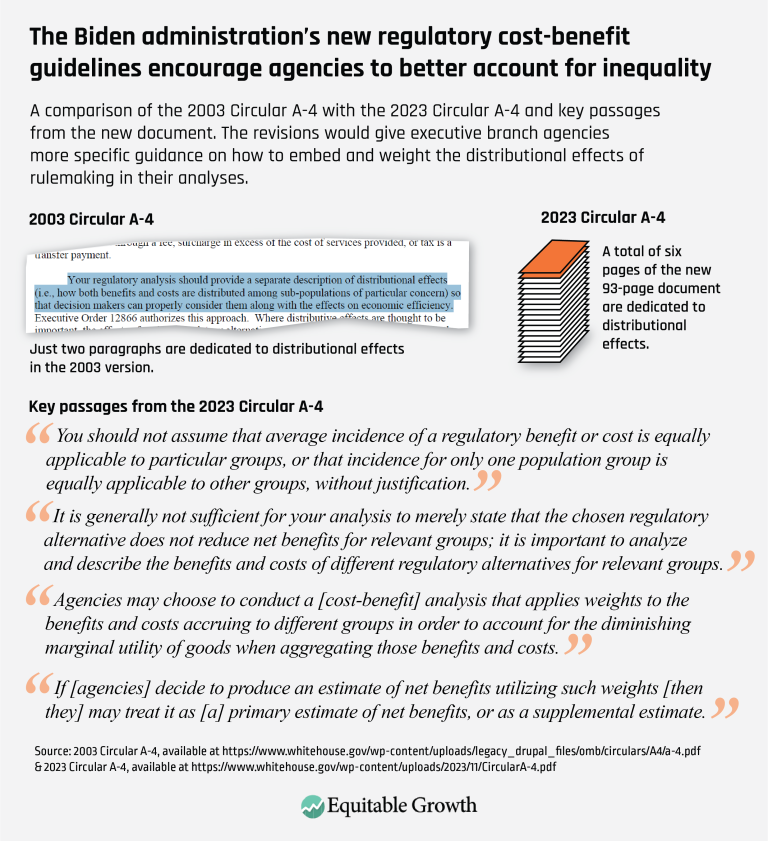
The Biden administration’s new regulatory cost-benefit guidelines encourage agencies to better account for inequality (opens in a new tab)
Visualizations Jan 31, 2024
 View Chart
(opens in a new tab)
View Chart
(opens in a new tab)
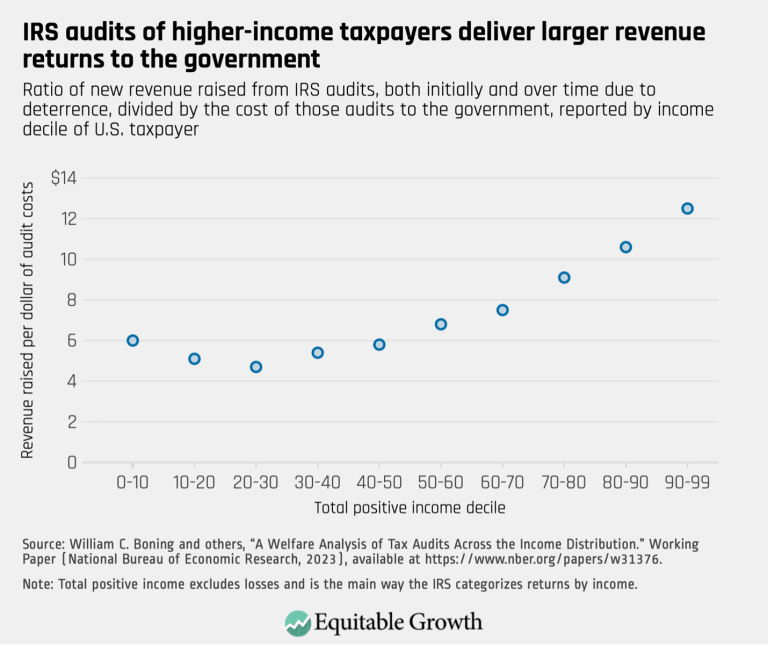
IRS audits of higher-income taxpayers deliver larger revenue returns to the government (opens in a new tab)
Visualizations Jan 9, 2024
 View Chart
(opens in a new tab)
View Chart
(opens in a new tab)
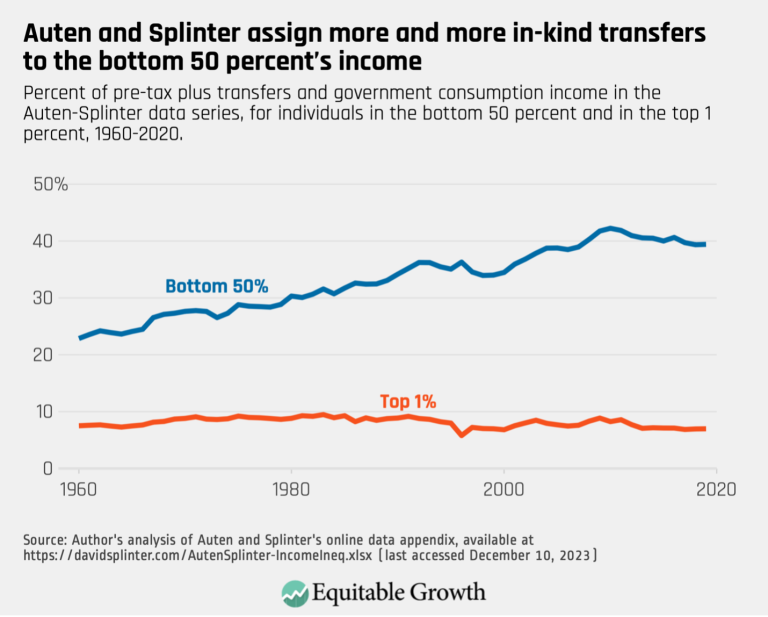
Auten and Splinter assign more and more in-kind transfers to the bottom 50 percent’s income (opens in a new tab)
Visualizations Jan 9, 2024
 View Chart
(opens in a new tab)
View Chart
(opens in a new tab)
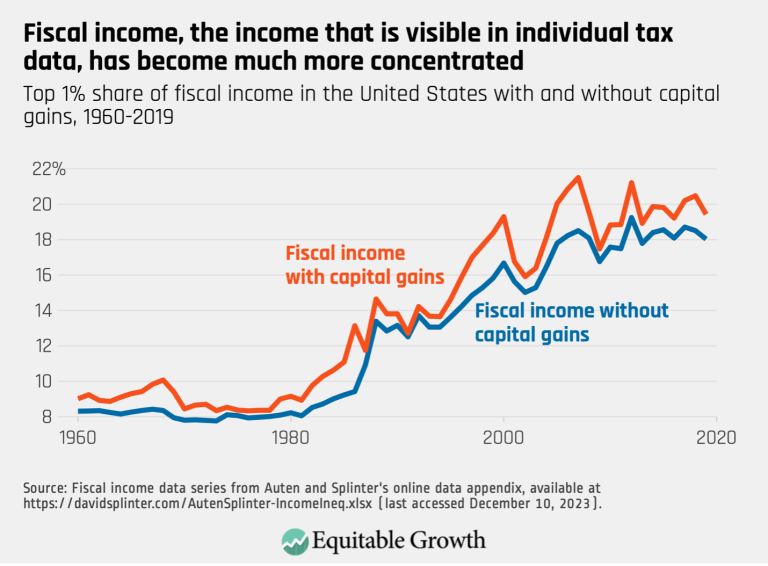
Fiscal income, the income that is visible in individual tax data, has become much more concentrated (opens in a new tab)
Visualizations Jan 9, 2024
 View Chart
(opens in a new tab)
View Chart
(opens in a new tab)
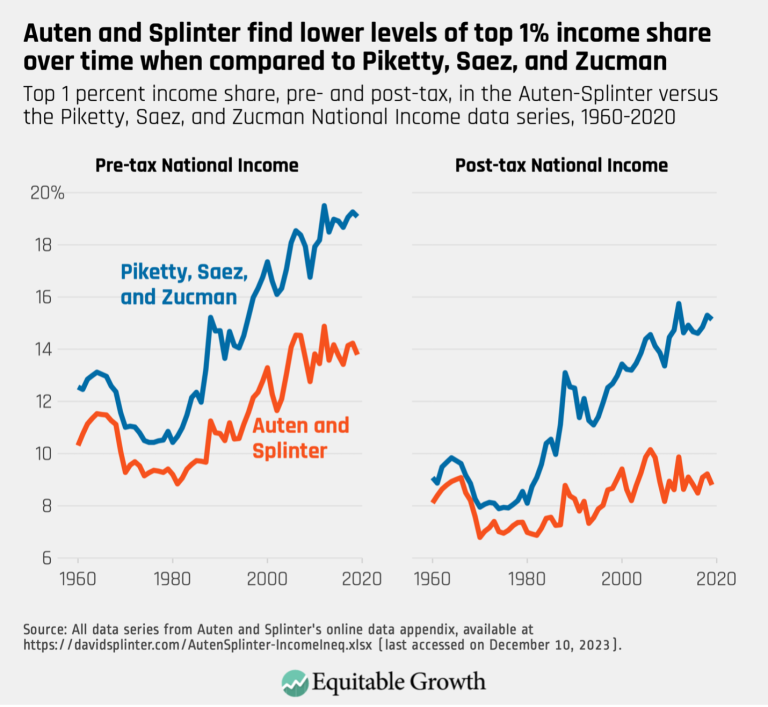
Auten and Splinter find lower levels of top 1% income share over time when compared to Piketty, Saez, and Zucman (opens in a new tab)
Visualizations Jan 9, 2024
 View Chart
(opens in a new tab)
View Chart
(opens in a new tab)
Investment Rate EG Graph 04 (opens in a new tab)
Visualizations Nov 20, 2023
 View Chart
(opens in a new tab)
View Chart
(opens in a new tab)
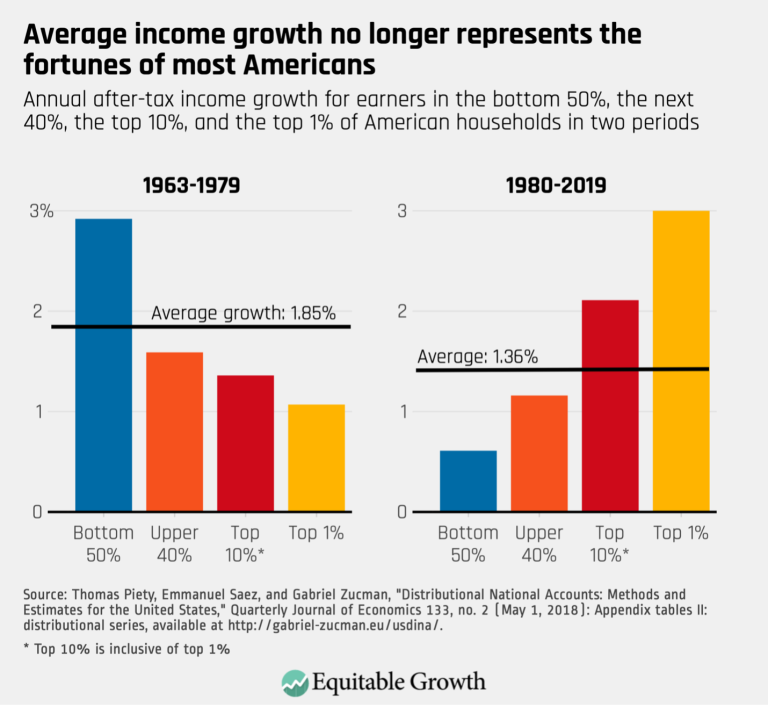
Average income growth no longer represents the fortunes of most Americans (opens in a new tab)
Visualizations Jul 11, 2023
 View Chart
(opens in a new tab)
View Chart
(opens in a new tab)
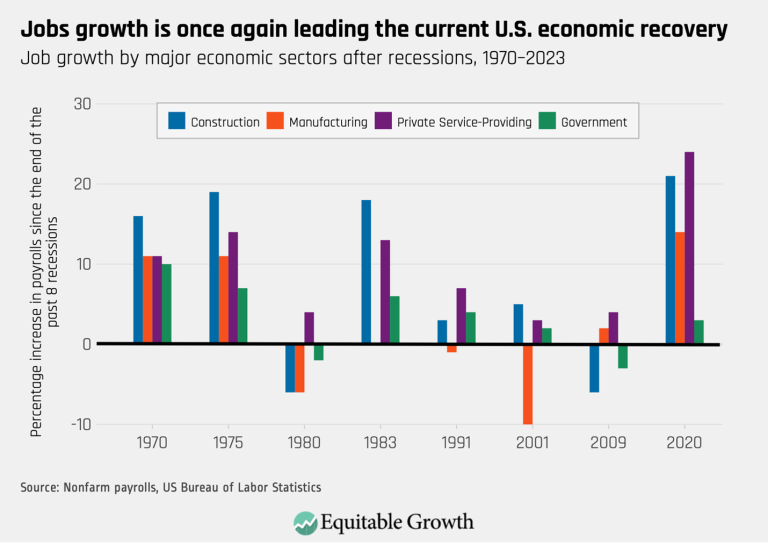
Jobs growth is once again leading the current U.S. economic recovery (opens in a new tab)
Visualizations Jun 14, 2023
 View Chart
(opens in a new tab)
View Chart
(opens in a new tab)
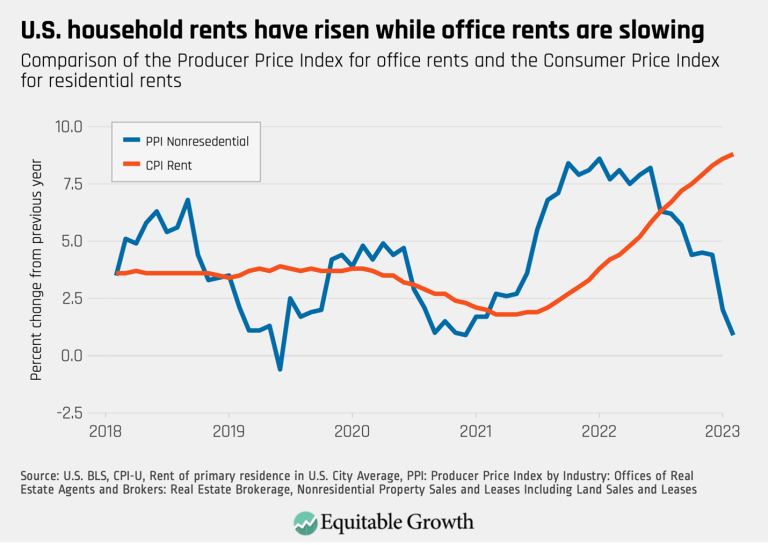
U.S. household rents have risen while office rents are slowing (opens in a new tab)
Visualizations Apr 4, 2023
 View Chart
(opens in a new tab)
View Chart
(opens in a new tab)
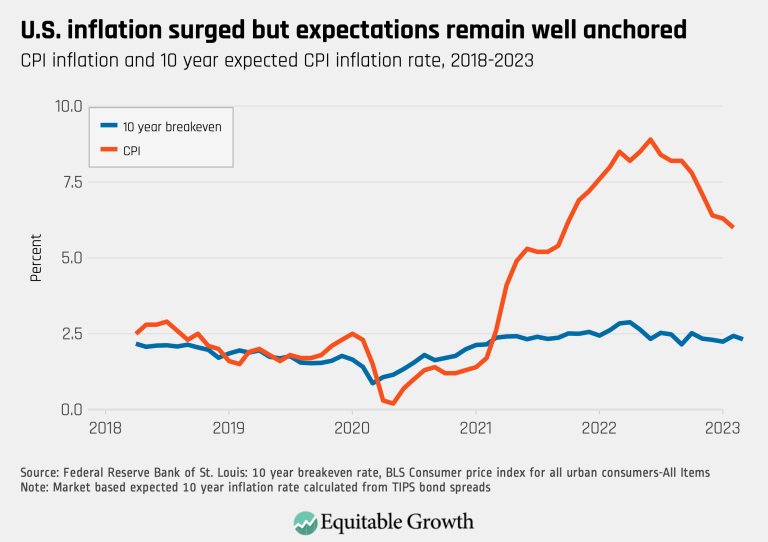
U.S. inflation surged but expectations remain well anchored (opens in a new tab)
Visualizations Apr 4, 2023
 View Chart
(opens in a new tab)
View Chart
(opens in a new tab)
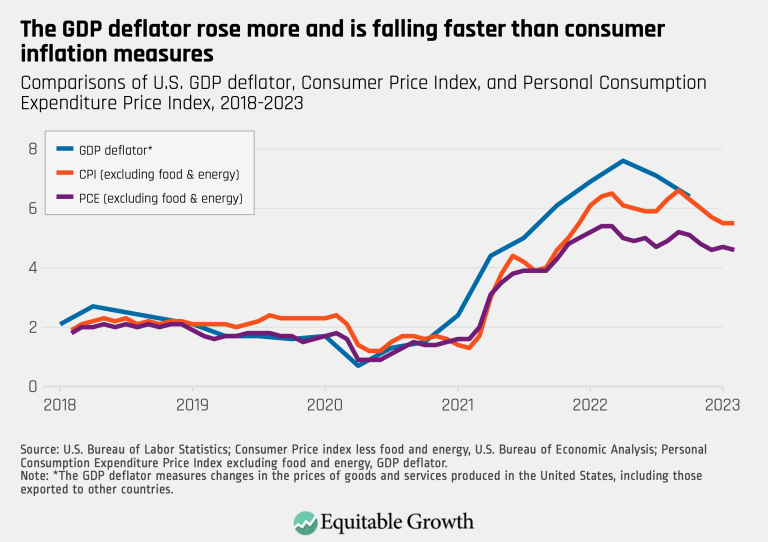
The GDP deflator rose more and is falling faster than consumer inflation measures (opens in a new tab)
Visualizations Apr 4, 2023
 View Chart
(opens in a new tab)
View Chart
(opens in a new tab)
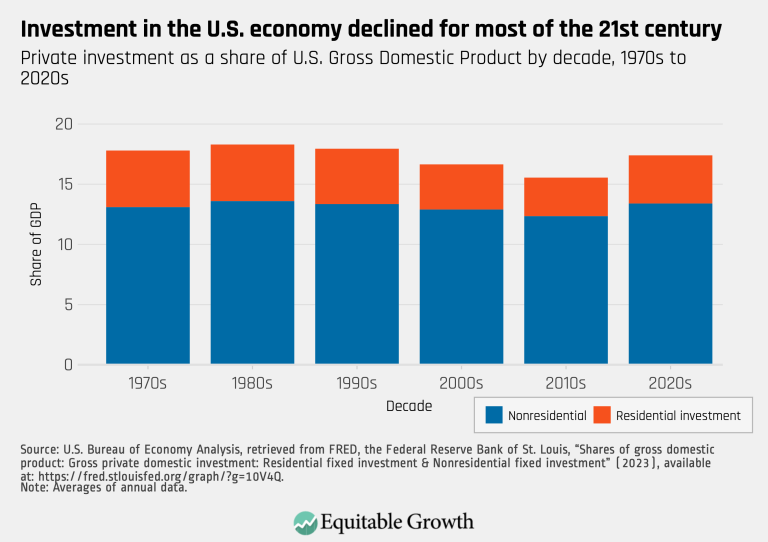
Investment in the U.S. economy declined for most of the 21st century (opens in a new tab)
Visualizations Mar 13, 2023
 View Chart
(opens in a new tab)
View Chart
(opens in a new tab)
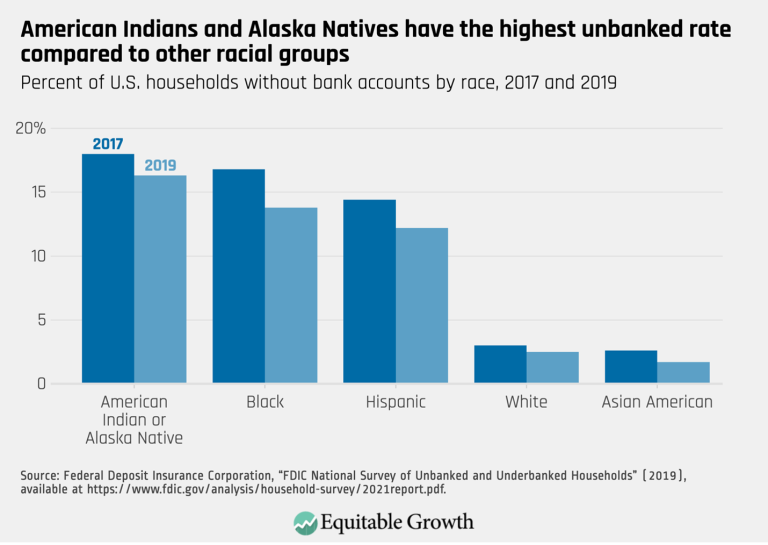
American Indians and Alaska Natives have the nighest unbanked rate compared to other racial groups (opens in a new tab)
Visualizations Mar 1, 2023
 View Chart
(opens in a new tab)
View Chart
(opens in a new tab)
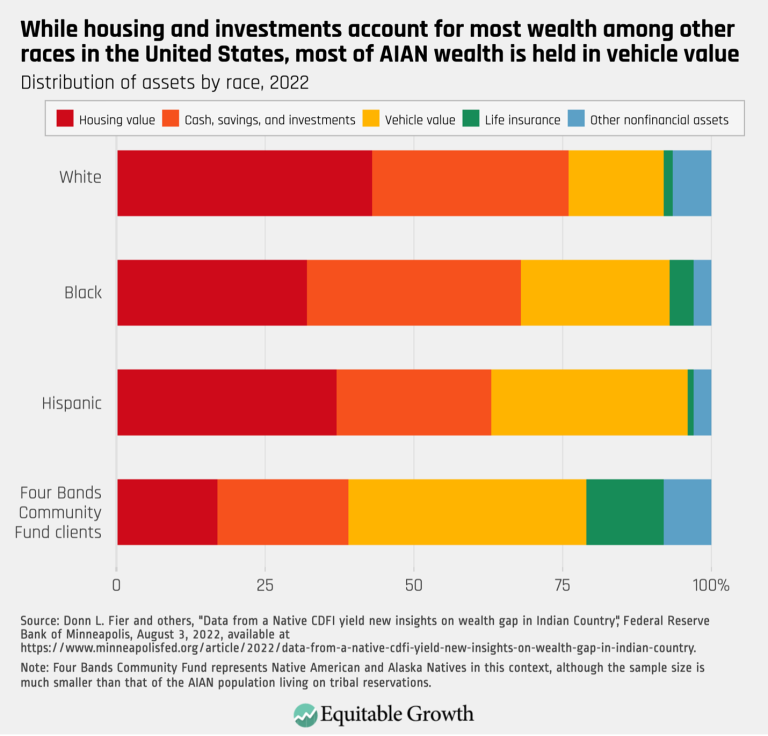
While housing and investments account for most wealth among other races in the United States, most of AIAN wealth is held in vehicle value (opens in a new tab)
Visualizations Mar 1, 2023
 View Chart
(opens in a new tab)
View Chart
(opens in a new tab)
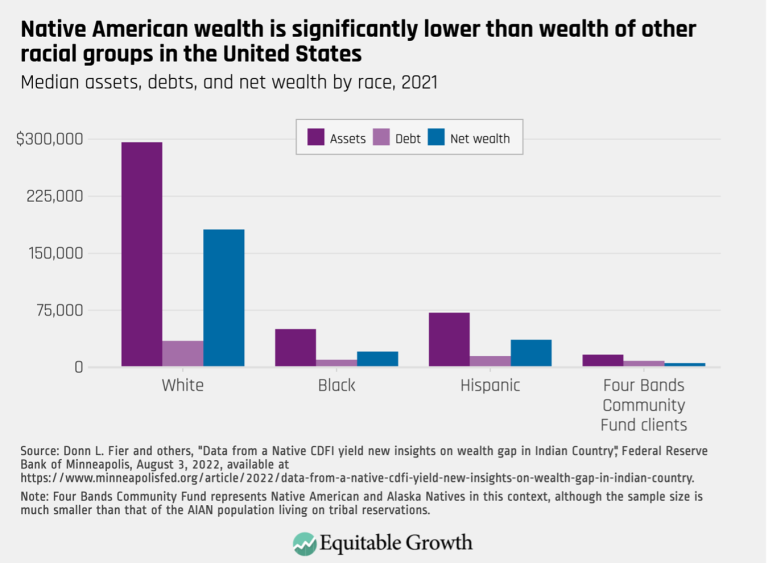
Native American wealth is significantly lower than wealth of other racial groups in the United States (opens in a new tab)
Visualizations Mar 1, 2023
 View Chart
(opens in a new tab)
View Chart
(opens in a new tab)
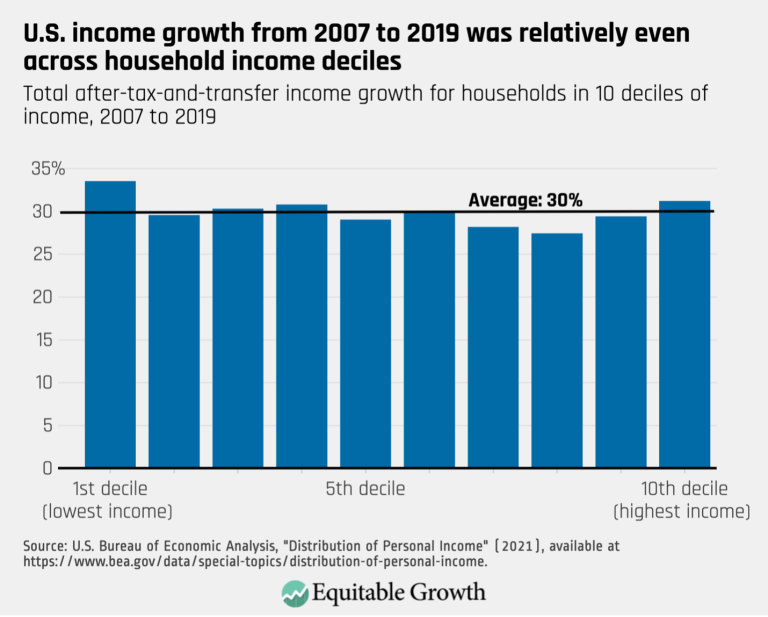
U.S. income growth from 2007 to 2019 was relatively even across household income deciles (opens in a new tab)
Visualizations Jan 17, 2023
 View Chart
(opens in a new tab)
View Chart
(opens in a new tab)
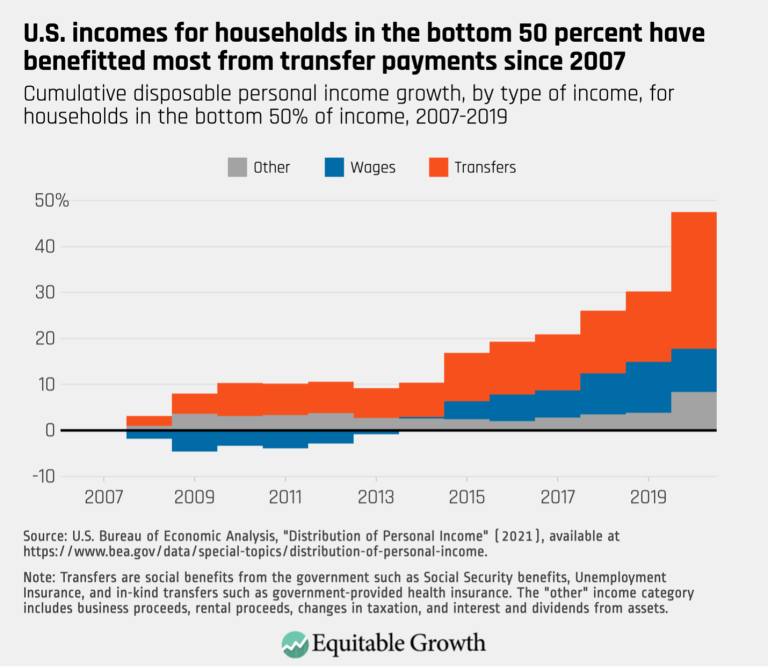
U.S. incomes for households in the bottom 50 percent have benefitted most from transfer payments since 2007 (opens in a new tab)
Visualizations Jan 17, 2023
 View Chart
(opens in a new tab)
View Chart
(opens in a new tab)
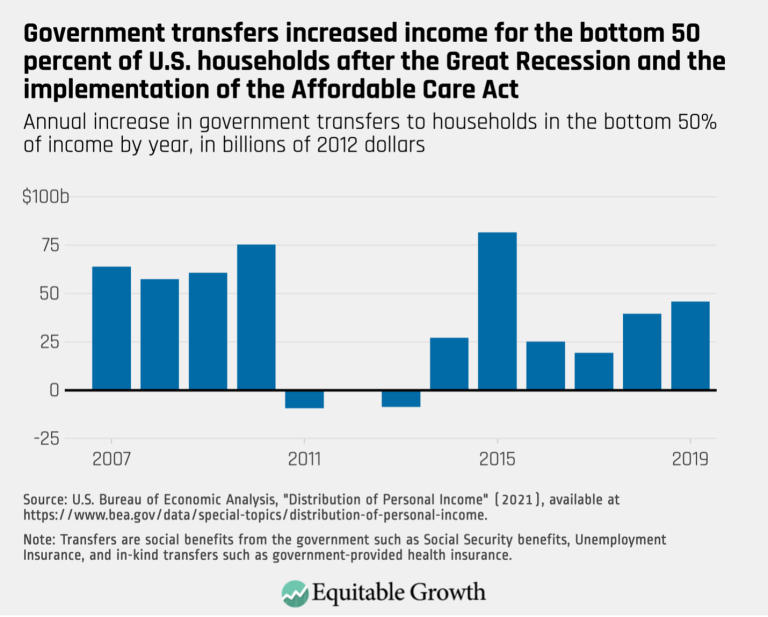
fig 3 (opens in a new tab)
Visualizations Jan 17, 2023
 View Chart
(opens in a new tab)
View Chart
(opens in a new tab)
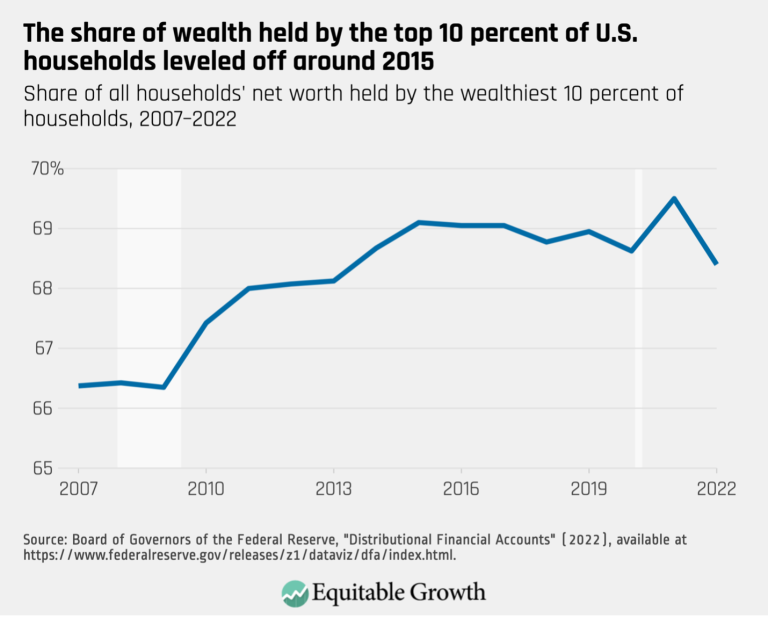
The share of wealth held by the top 10 percent of U.S. households leveled off around 2015 (opens in a new tab)
Visualizations Jan 17, 2023
 View Chart
(opens in a new tab)
View Chart
(opens in a new tab)
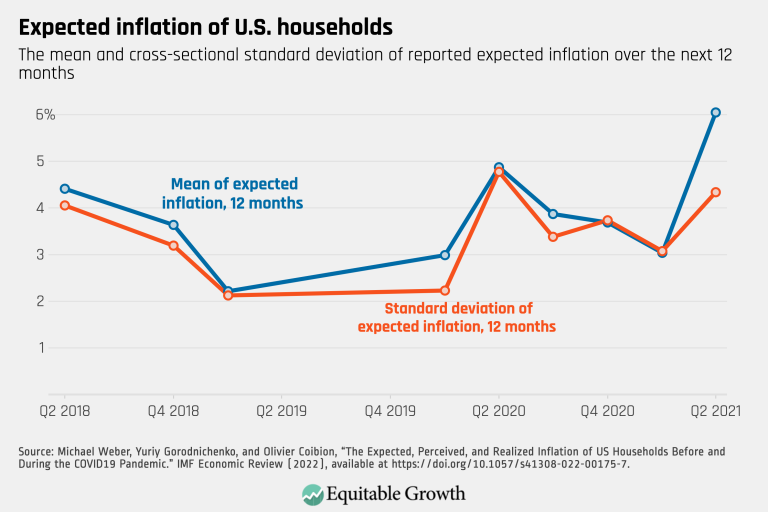
Expected inflation of U.S. households (opens in a new tab)
Visualizations Dec 9, 2022
 View Chart
(opens in a new tab)
View Chart
(opens in a new tab)
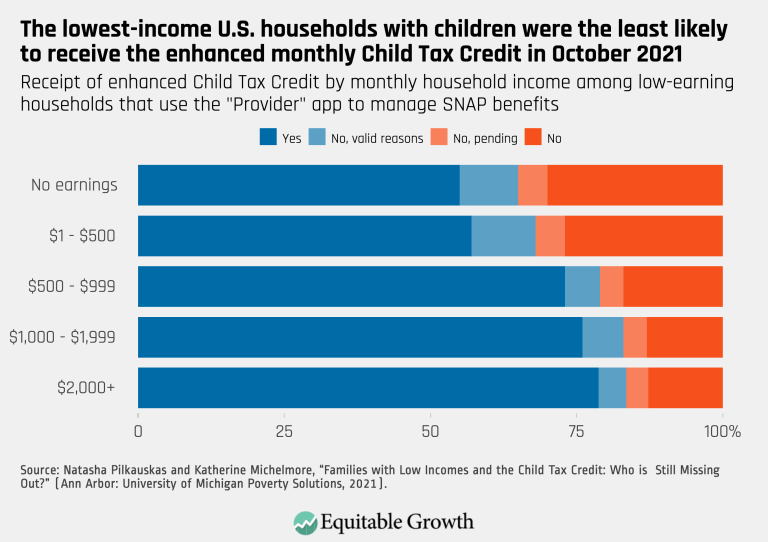
The lowest-income U.S. households with children were the least likely to receive the enhanced monthly Child Tax Credit in October 2021 (opens in a new tab)
Visualizations Nov 28, 2022
 View Chart
(opens in a new tab)
View Chart
(opens in a new tab)
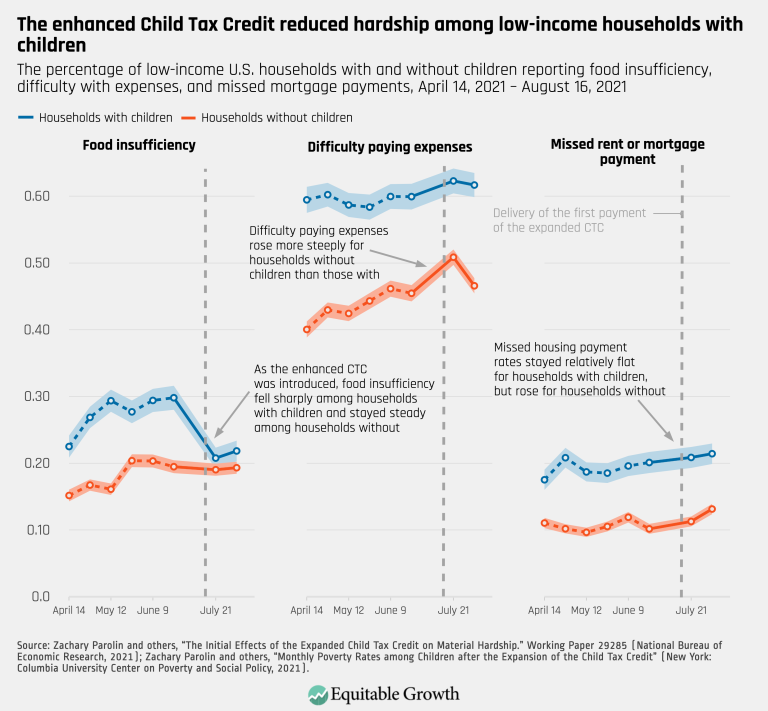
The enhanced Child Tax Credit reduced hardship among low-income households with children (opens in a new tab)
Visualizations Nov 28, 2022
 View Chart
(opens in a new tab)
View Chart
(opens in a new tab)
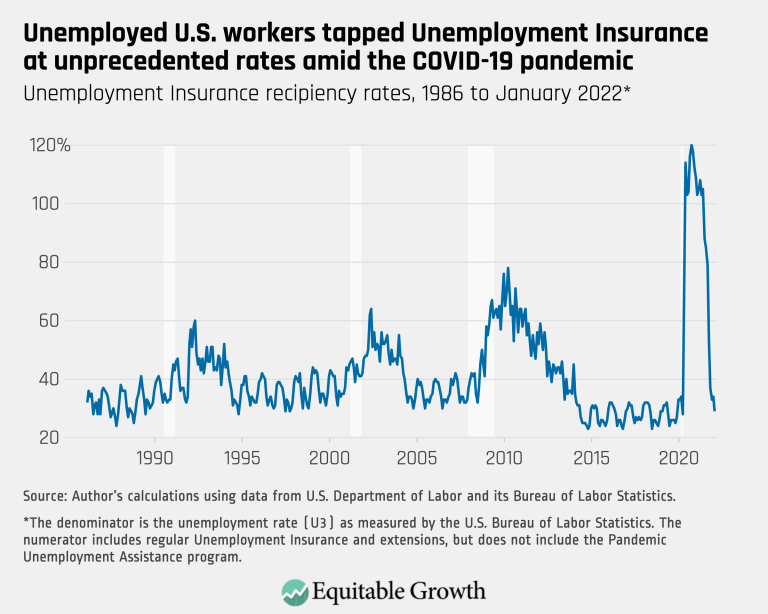
Unemployed U.S. workers tapped Unemployment Insurance at unprecedented rates amid the COVID-19 pandemic (opens in a new tab)
Visualizations Nov 17, 2022
 View Chart
(opens in a new tab)
View Chart
(opens in a new tab)
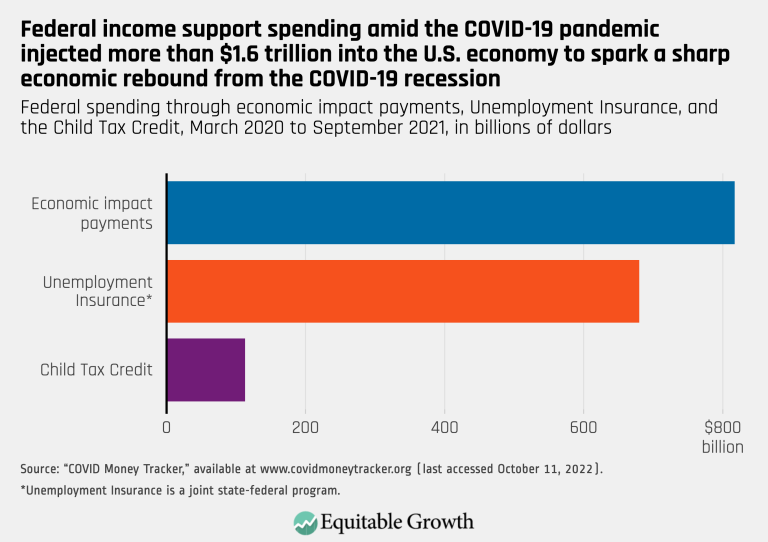
Federal income support spending amid the COVID-19 pandemic injected more than $1.6 trillion into the U.S. economy to spark a sharp economic rebound from the COVID-19 recession (opens in a new tab)
Visualizations Nov 14, 2022
 View Chart
(opens in a new tab)
View Chart
(opens in a new tab)
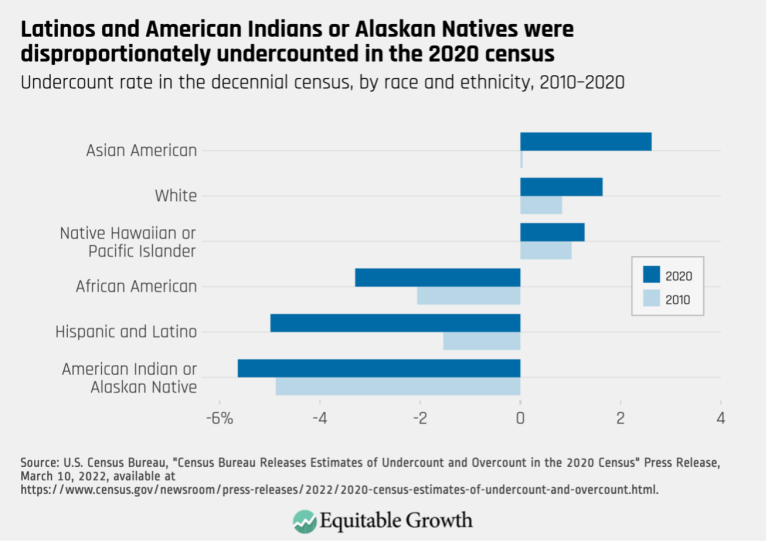
Latinos and American Indians or Alaskan Natives were disproportionately undercounted in the 2020 census (opens in a new tab)
Visualizations Oct 14, 2022
 View Chart
(opens in a new tab)
View Chart
(opens in a new tab)
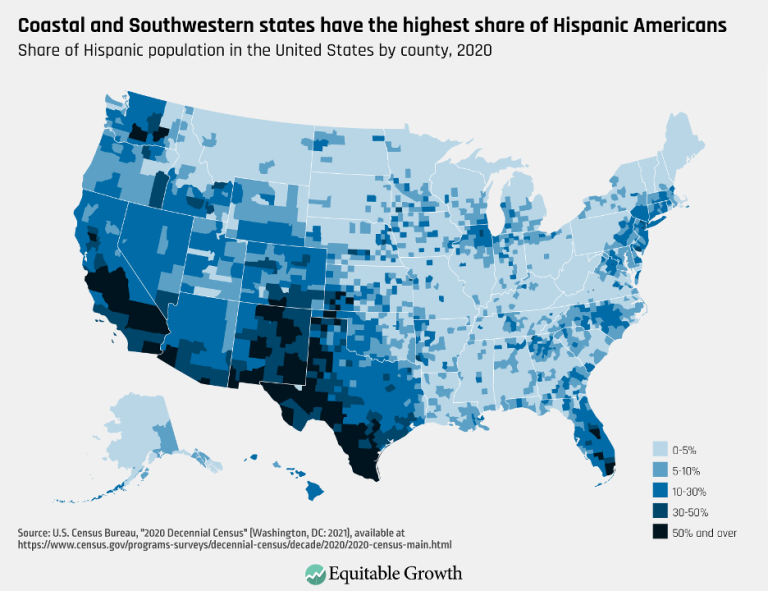
Coastal and Southwestern states have the highest share of Hispanic Americans (opens in a new tab)
Visualizations Oct 14, 2022
 View Chart
(opens in a new tab)
View Chart
(opens in a new tab)
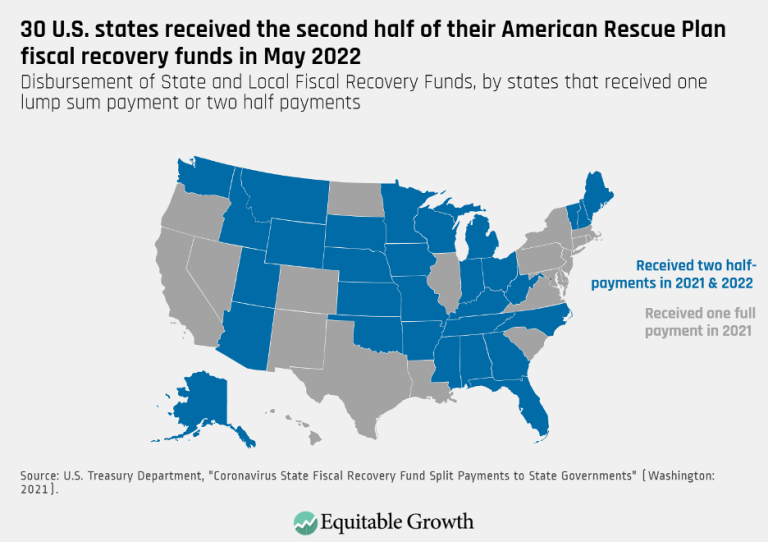
30 U.S. states received the second half of their American Rescue plan fiscal recovery funds in May 2022 (opens in a new tab)
Visualizations Sep 19, 2022
 View Chart
(opens in a new tab)
View Chart
(opens in a new tab)
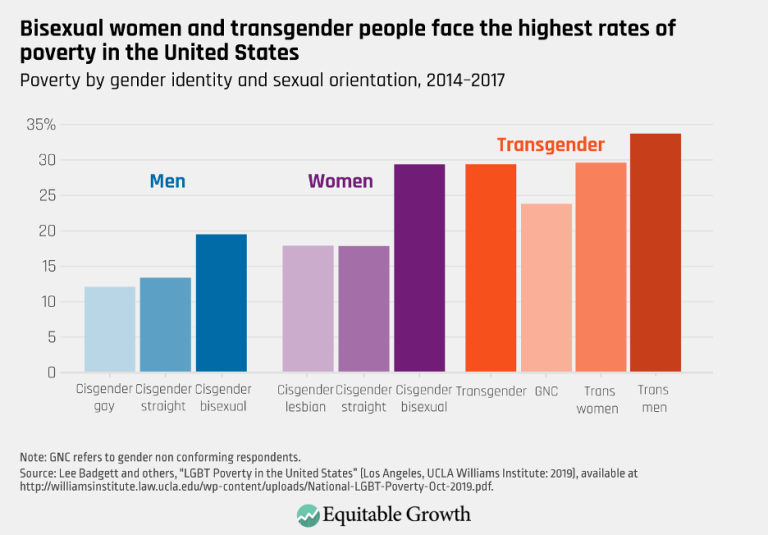
Bisexual women and transgender people face the highest rates of poverty in the United States (opens in a new tab)
Visualizations Sep 15, 2022
Equitable Growth responds to passage of the Inflation Reduction Act (opens in a new tab)
Press Releases AUG 16, 2022
 View Chart
(opens in a new tab)
View Chart
(opens in a new tab)
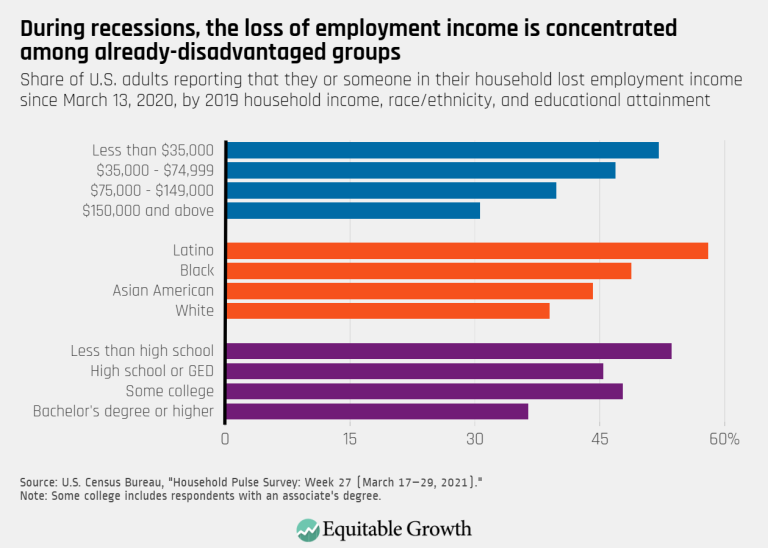
During recessions, the loss of employment income is concentrated among already-disadvantaged groups (opens in a new tab)
Visualizations Aug 12, 2022
 View Chart
(opens in a new tab)
View Chart
(opens in a new tab)
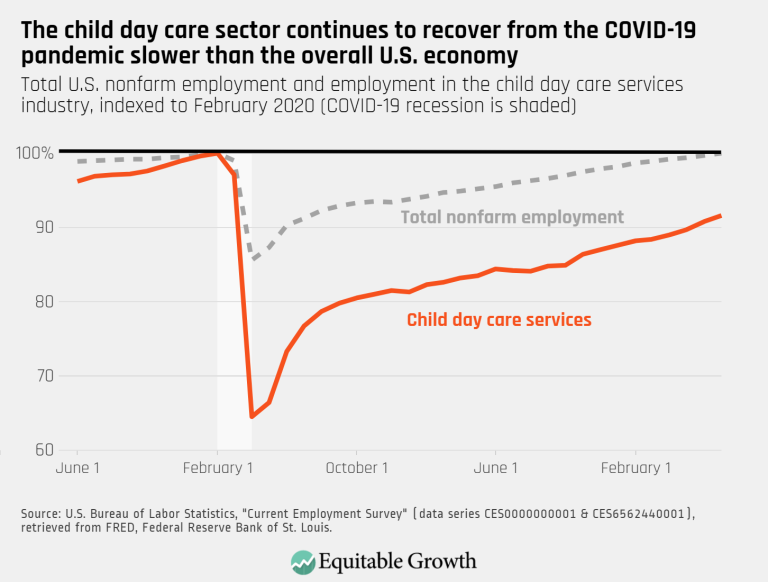
The child day care sector continues to recover from the COVID-19 pandemic slower than the overall U.S. economy (opens in a new tab)
Visualizations Aug 9, 2022
 View Chart
(opens in a new tab)
View Chart
(opens in a new tab)
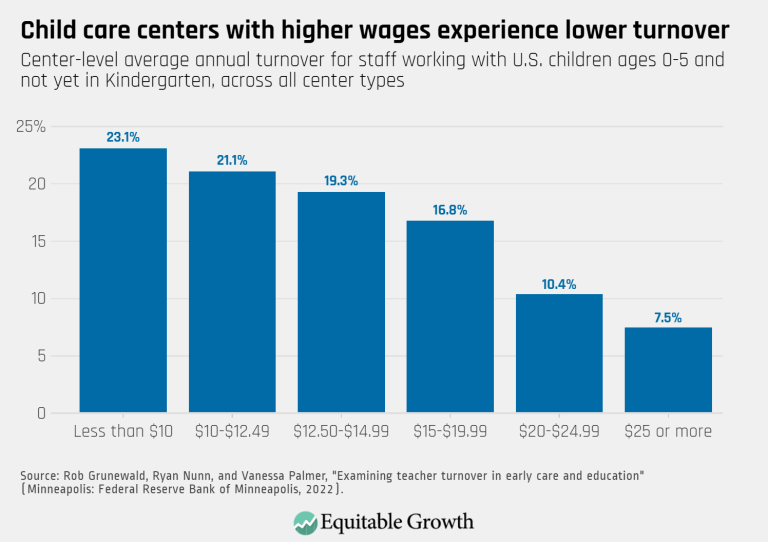
Child care centers with higher wages experience lower turnover (opens in a new tab)
Visualizations Aug 9, 2022
 View Chart
(opens in a new tab)
View Chart
(opens in a new tab)
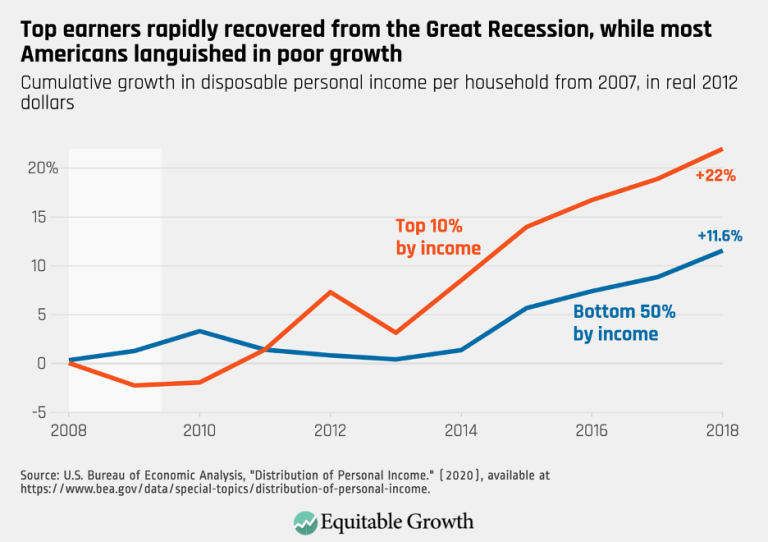
Top earners rapidly recovered from the Great Recession, while most Americans languished in poor growth (opens in a new tab)
Visualizations Aug 9, 2022
 View Chart
(opens in a new tab)
View Chart
(opens in a new tab)
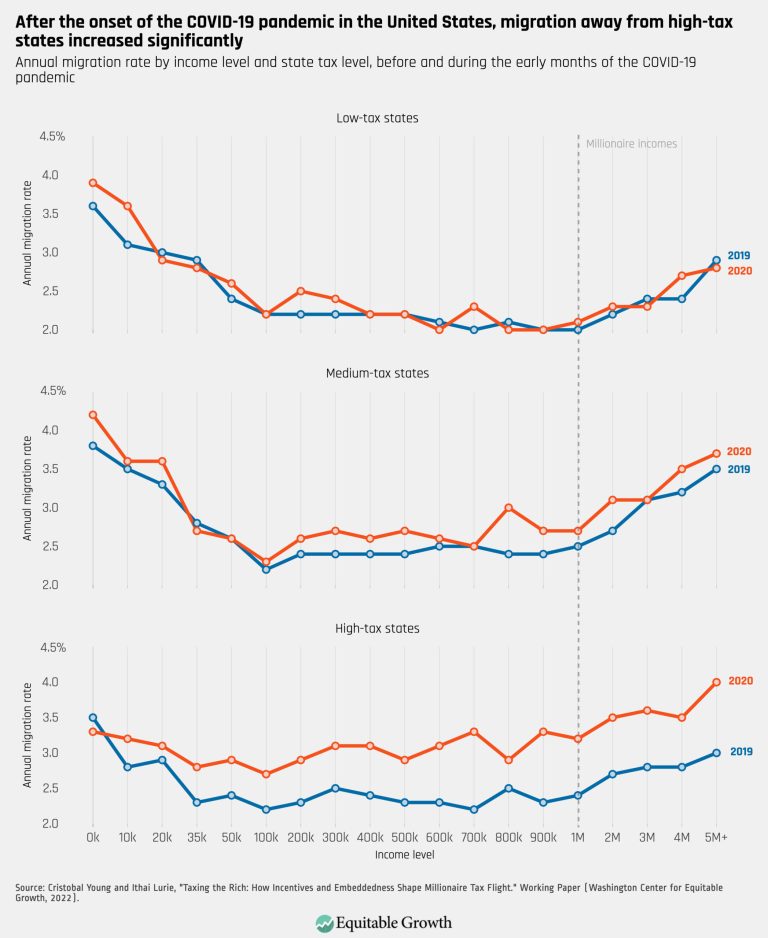
After the onset of the COVID-19 pandemic in the United States, migration away from high-tax states increased significantly – updated (opens in a new tab)
Visualizations Jul 28, 2022
 View Chart
(opens in a new tab)
View Chart
(opens in a new tab)
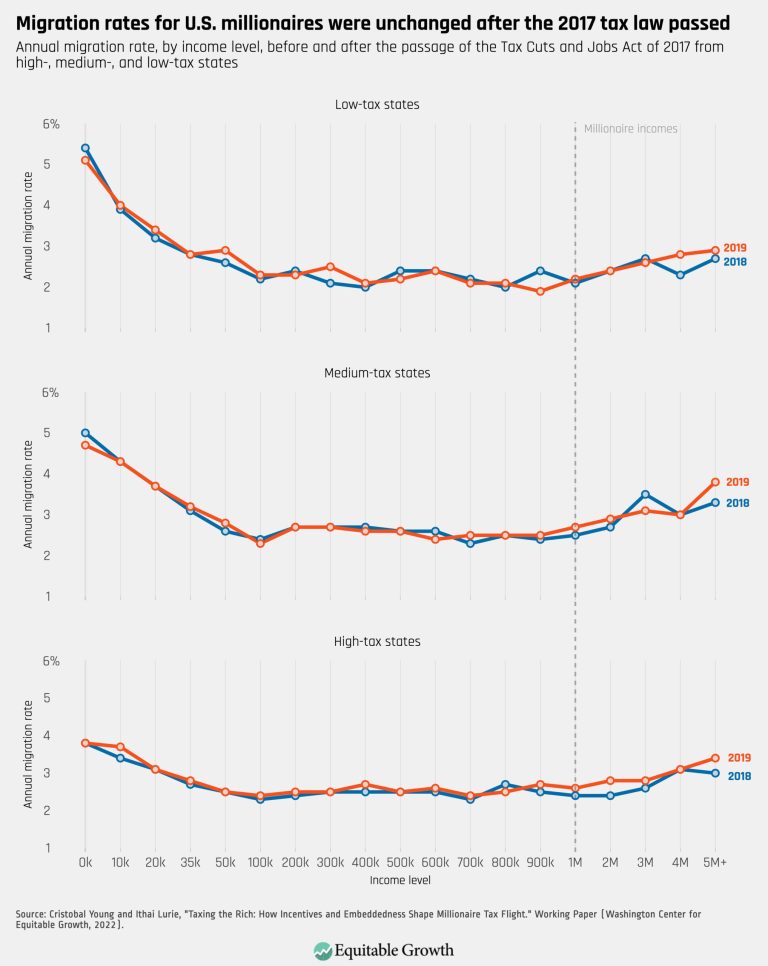
Migration rates for U.S. millionaires were unchanged after the 2017 tax law passed (opens in a new tab)
Visualizations Jul 28, 2022
 View Chart
(opens in a new tab)
View Chart
(opens in a new tab)
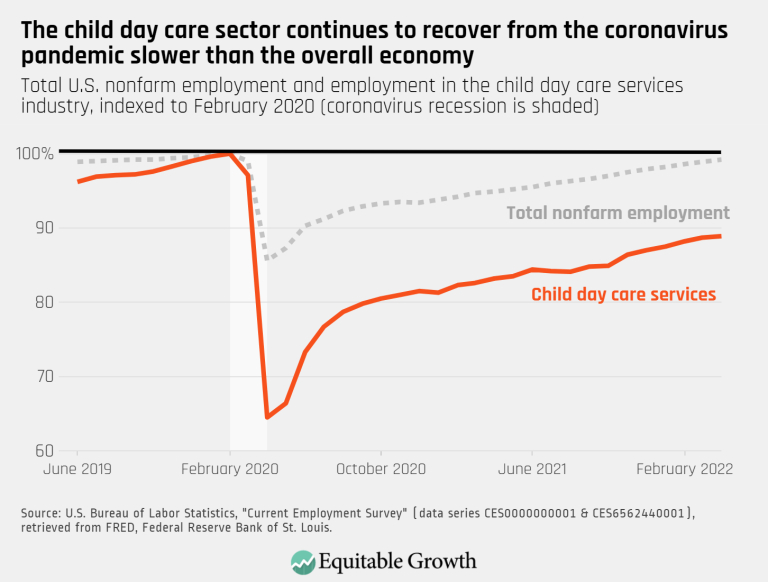
The child day care sector continues to recover from the COVID-19 pandemic slower than the overall economy (opens in a new tab)
Visualizations May 20, 2022
 View Chart
(opens in a new tab)
View Chart
(opens in a new tab)
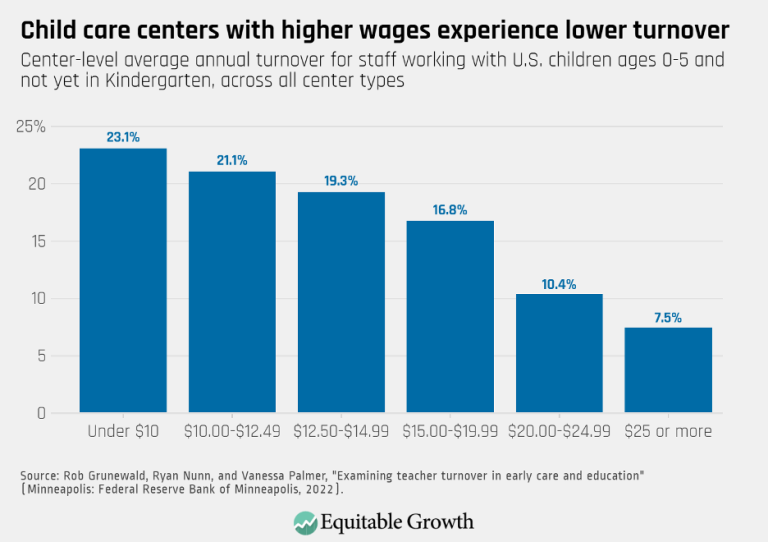
Child care centers with higher wages experience lower turnover (opens in a new tab)
Visualizations May 18, 2022
 View Chart
(opens in a new tab)
View Chart
(opens in a new tab)
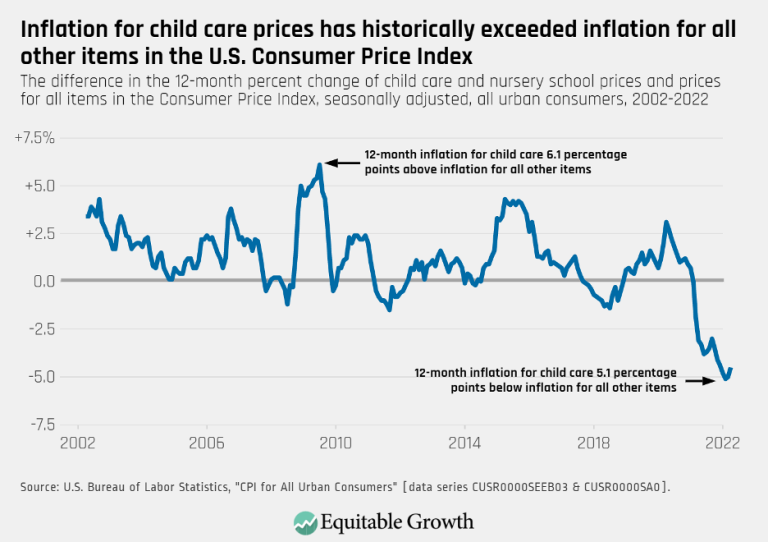
Inflation for child care prices has historically exceeded inflation for all other items in the U.S. Consumer Price Index (opens in a new tab)
Visualizations May 18, 2022
 View Chart
(opens in a new tab)
View Chart
(opens in a new tab)
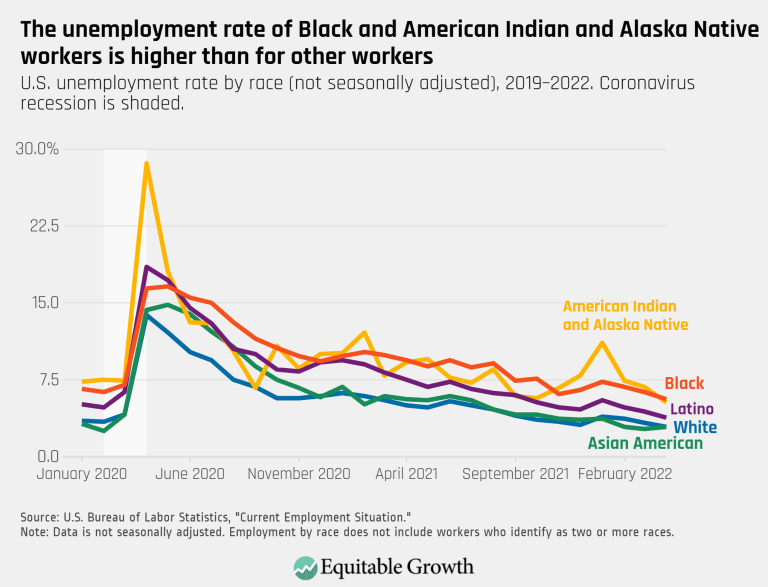
The unemployment rate of Black and American Indian and Alaska Native workers is higher than for other workers (opens in a new tab)
Visualizations May 6, 2022
 View Chart
(opens in a new tab)
View Chart
(opens in a new tab)
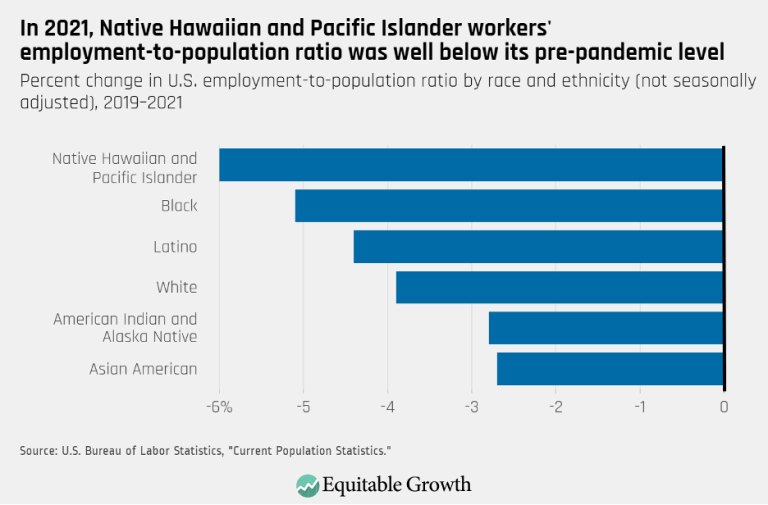
In 2021, Native Hawaiian and Pacific Islander workers’ employment-to-population ratio was well below its pre-pandemic level (opens in a new tab)
Visualizations May 6, 2022
 View Chart
(opens in a new tab)
View Chart
(opens in a new tab)
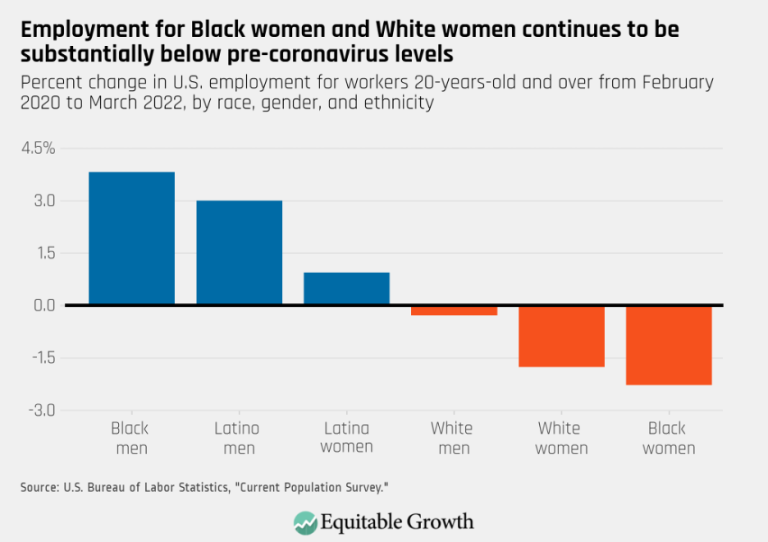
Employment for Black women and White women continues to be substantially below pre-coronavirus levels (opens in a new tab)
Visualizations Apr 26, 2022
 View Chart
(opens in a new tab)
View Chart
(opens in a new tab)
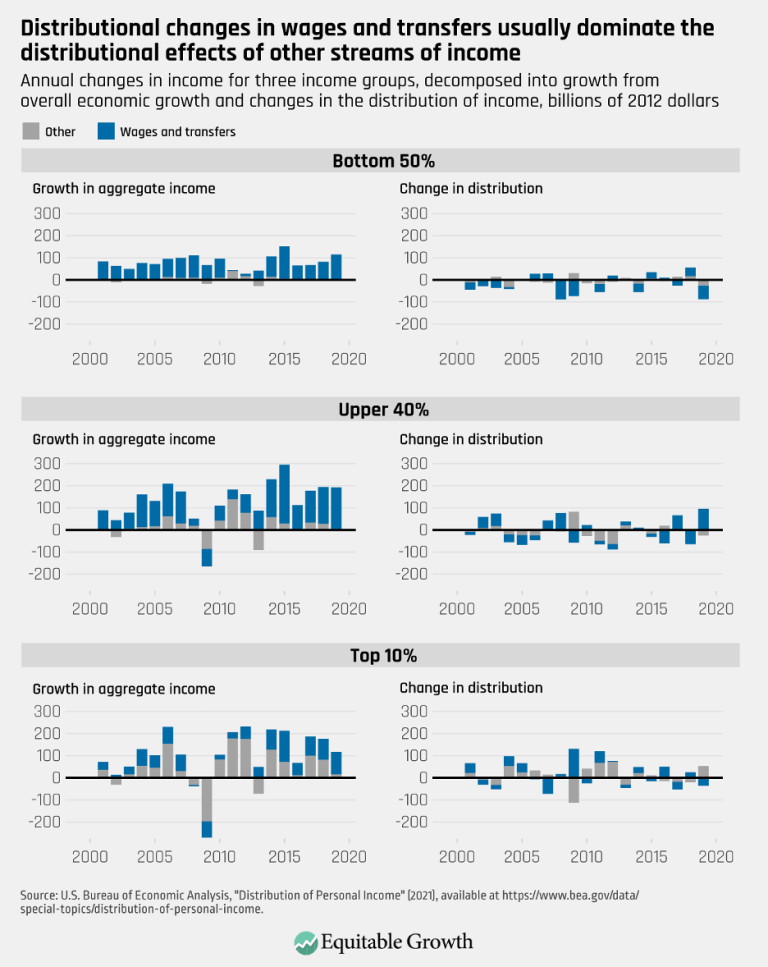
Distributional changes in wages and transfers usually dominate the distributional effects of other streams of income (opens in a new tab)
Visualizations Feb 23, 2022
 View Chart
(opens in a new tab)
View Chart
(opens in a new tab)
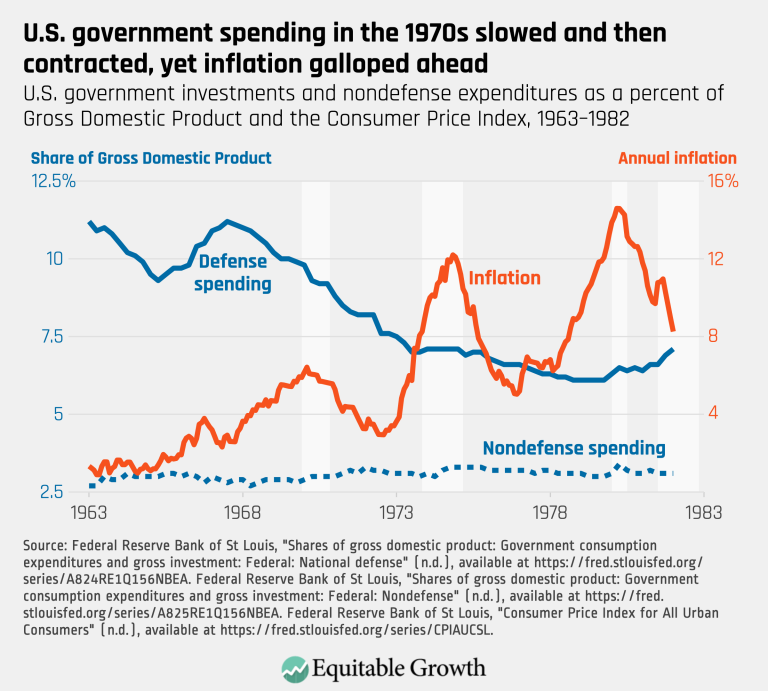
U.S. government spending in the 1970s slowed and then contracted, yet inflation galloped ahead (opens in a new tab)
Visualizations Jan 12, 2022
 View Chart
(opens in a new tab)
View Chart
(opens in a new tab)
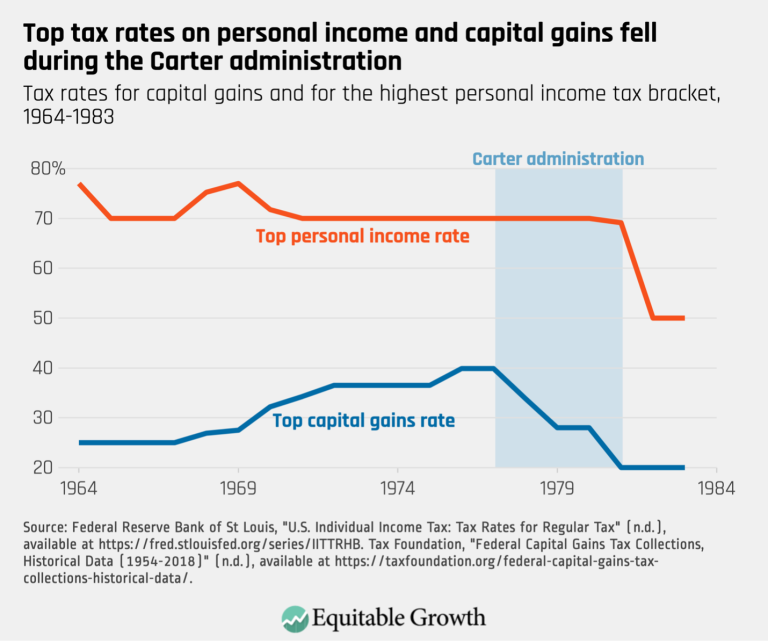
Top tax rates on personal income and capital gains fell during the Carter administration (opens in a new tab)
Visualizations Jan 10, 2022
 View Chart
(opens in a new tab)
View Chart
(opens in a new tab)
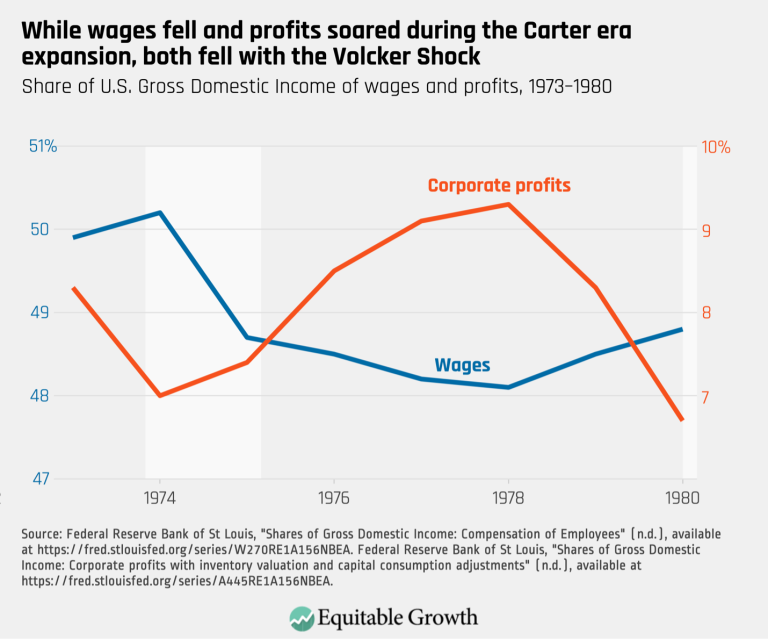
While wages fell and profits soared during the Carter era expansion, both fell with the Volcker Shock (opens in a new tab)
Visualizations Jan 10, 2022
 View Chart
(opens in a new tab)
View Chart
(opens in a new tab)
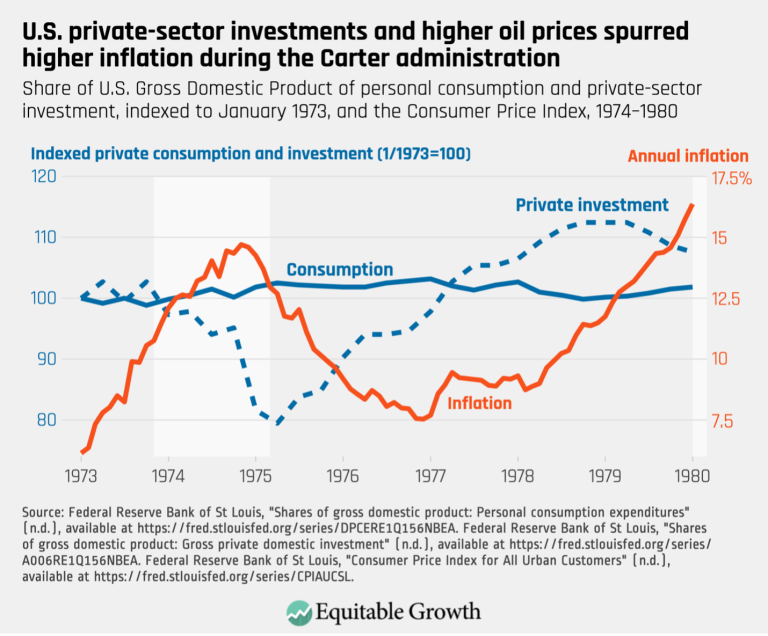
U.S. private-sector investment and higher oil prices spurred higher inflation during the Carter administration (opens in a new tab)
Visualizations Jan 10, 2022
 View Chart
(opens in a new tab)
View Chart
(opens in a new tab)
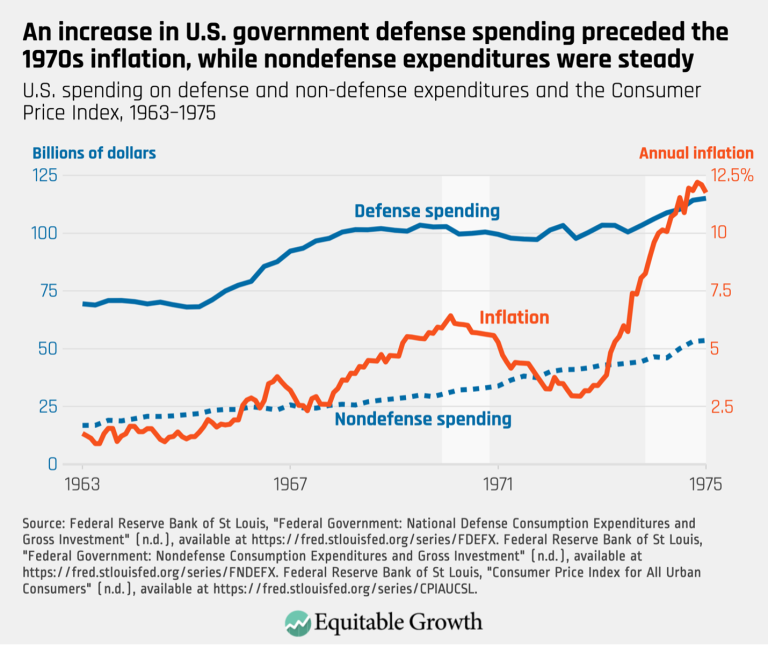
An increase in U.S. government defense spending preceded the 1970s inflation, while nondefense expenditures were steady (opens in a new tab)
Visualizations Jan 10, 2022
 View Chart
(opens in a new tab)
View Chart
(opens in a new tab)
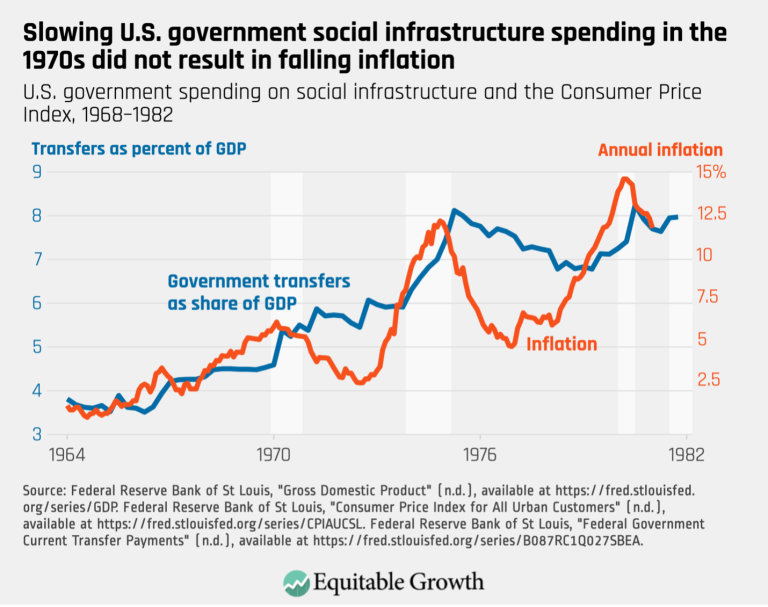
Slowing U.S. government social infrastructure spending in the 1970s did not result in falling inflation (opens in a new tab)
Visualizations Jan 10, 2022
 View Chart
(opens in a new tab)
View Chart
(opens in a new tab)
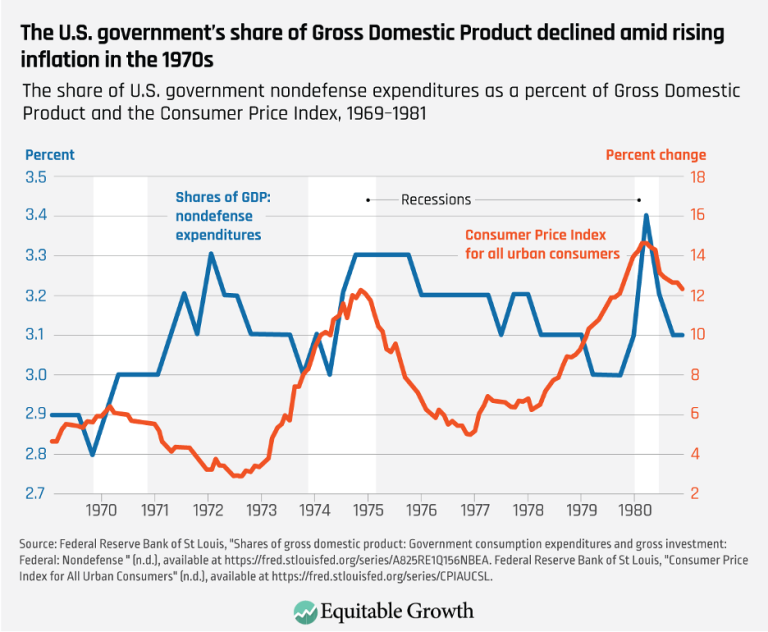
The U.S. government’s share of Gross Domestic Product declined amid rising inflation in the 1970s (opens in a new tab)
Visualizations Jan 10, 2022
 View Chart
(opens in a new tab)
View Chart
(opens in a new tab)
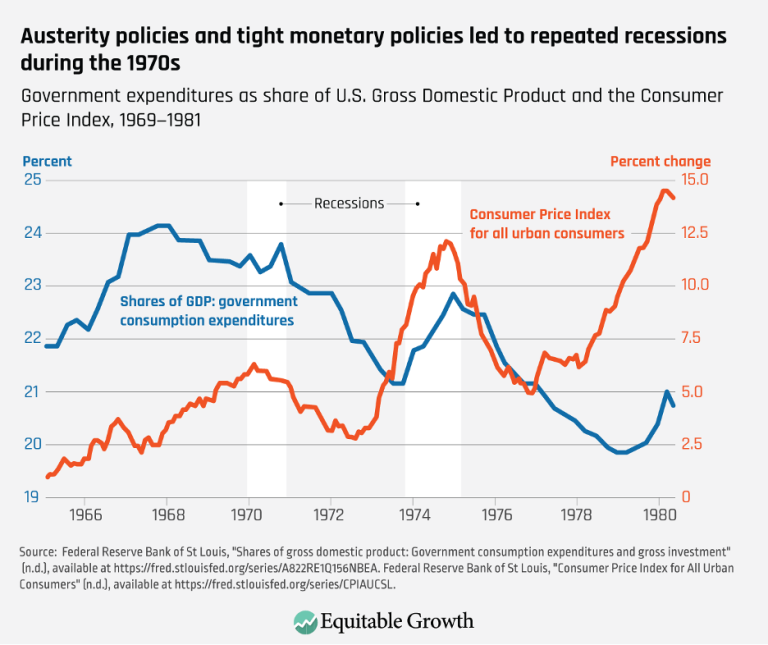
Austerity policies and tight monetary policies led to repeated recessions during the 1970s (opens in a new tab)
Visualizations Jan 10, 2022
 View Chart
(opens in a new tab)
View Chart
(opens in a new tab)
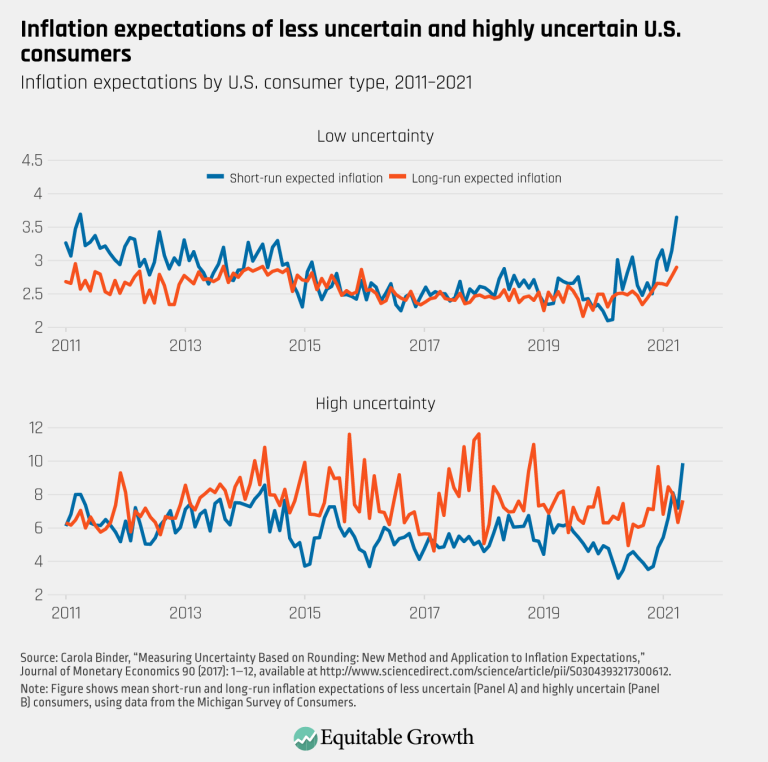
Inflation expectations of less uncertain and highly uncertain U.S. consumers (opens in a new tab)
Visualizations Jul 12, 2021
 View Chart
(opens in a new tab)
View Chart
(opens in a new tab)
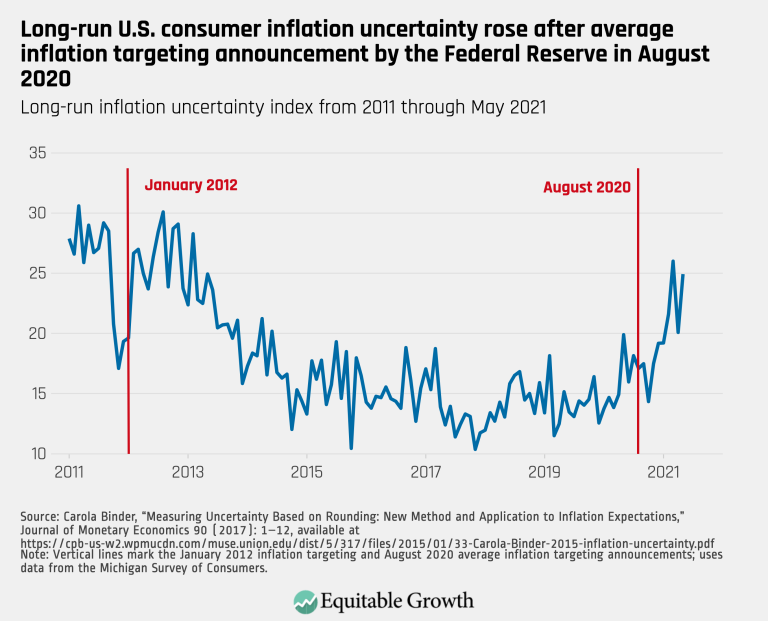
Long-run U.S. consumer inflation uncertainty rose after average inflation targeting announcement by the Federal Reserve in August 2020 (opens in a new tab)
Visualizations Jul 12, 2021
 View Chart
(opens in a new tab)
View Chart
(opens in a new tab)
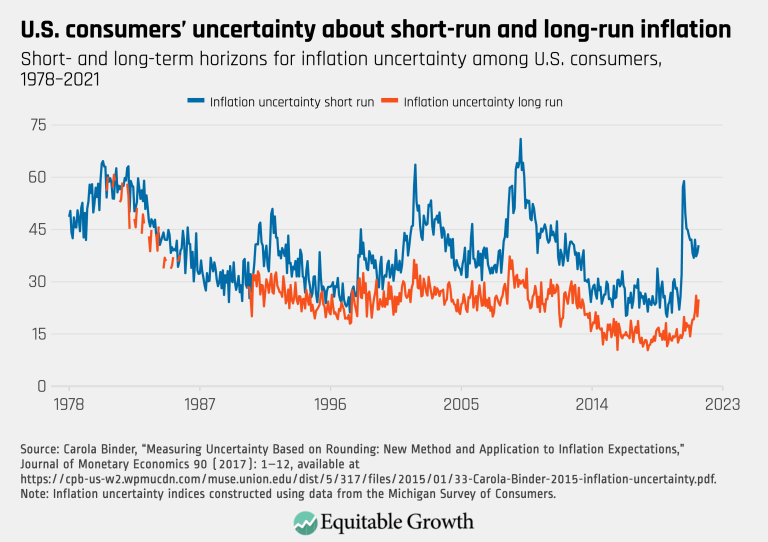
U.S. consumers’ uncertainty about short-run and long-run inflation (opens in a new tab)
Visualizations Jul 12, 2021
 View Chart
(opens in a new tab)
View Chart
(opens in a new tab)
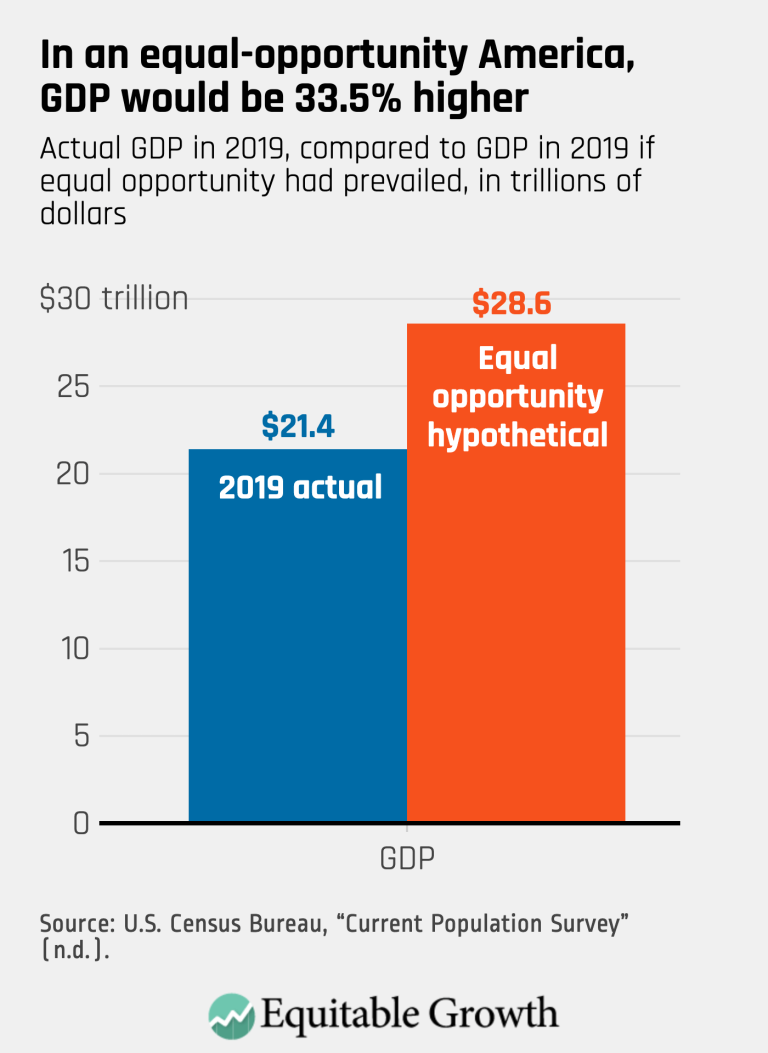
In an equal-opportunity America, GDP would be 33.5% higher (opens in a new tab)
Visualizations Jul 2, 2021
 View Chart
(opens in a new tab)
View Chart
(opens in a new tab)
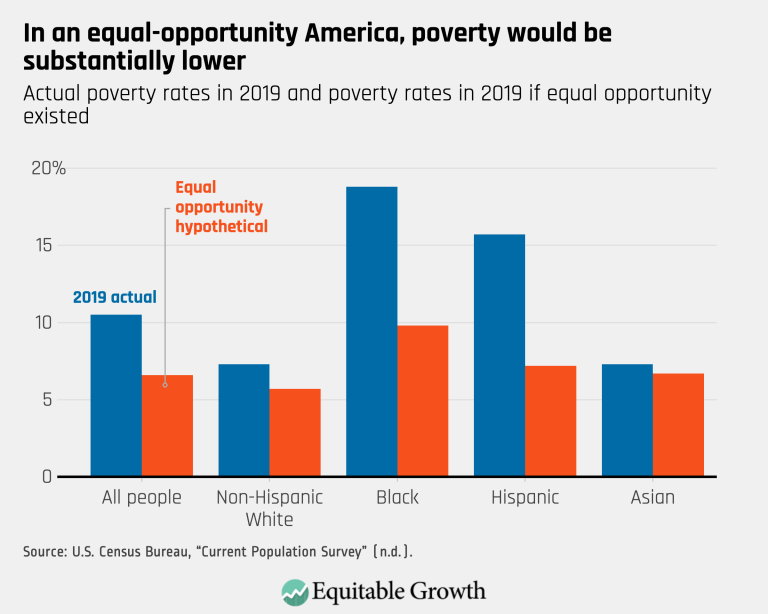
In an equal-opportunity America, poverty would be substantially lower (opens in a new tab)
Visualizations Jul 2, 2021
 View Chart
(opens in a new tab)
View Chart
(opens in a new tab)
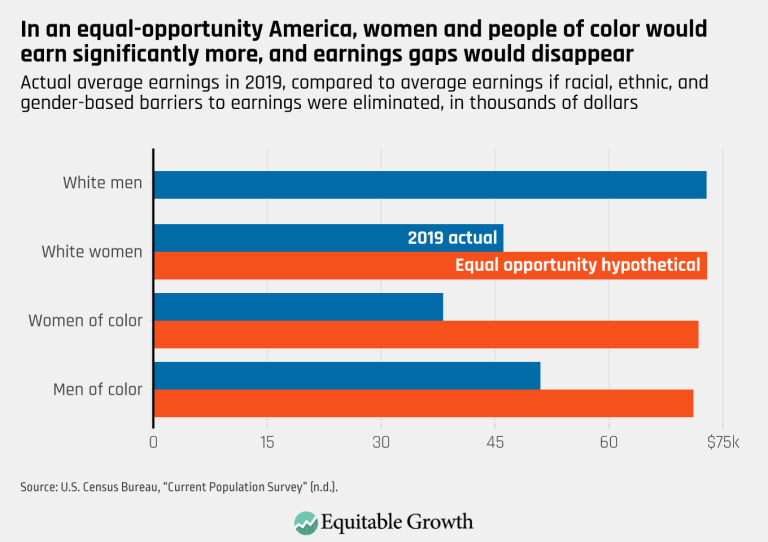
In an equal-opportunity America, women and people of color would earn significantly more, and earnings gaps would disappear (opens in a new tab)
Visualizations Jul 2, 2021
 View Chart
(opens in a new tab)
View Chart
(opens in a new tab)
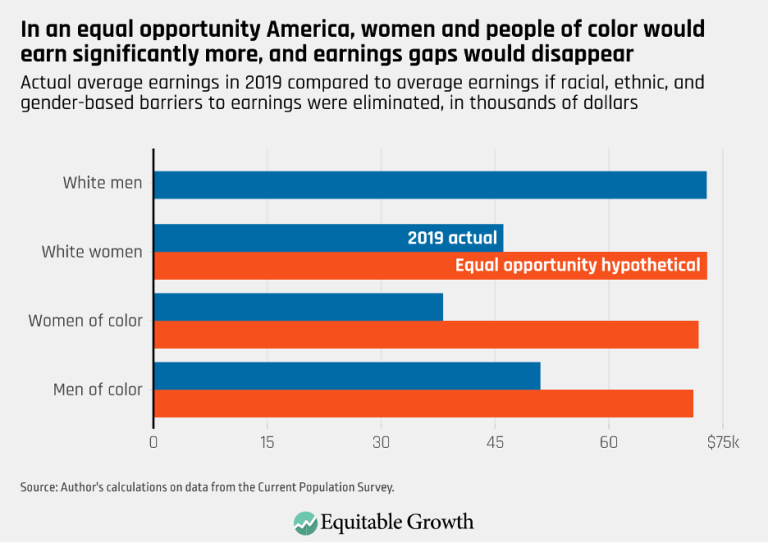
In an equal opportunity America, women and people of color would earn significantly more, and earnings gaps would disappear (opens in a new tab)
Visualizations Jun 7, 2021
 View Chart
(opens in a new tab)
View Chart
(opens in a new tab)
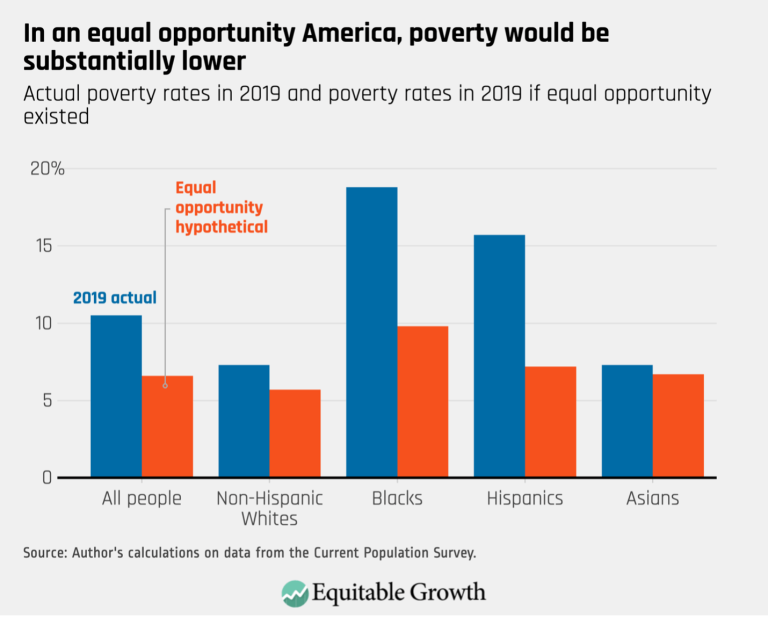
In an equal opportunity America, poverty would be substantially lower (opens in a new tab)
Visualizations Jun 7, 2021
 View Chart
(opens in a new tab)
View Chart
(opens in a new tab)
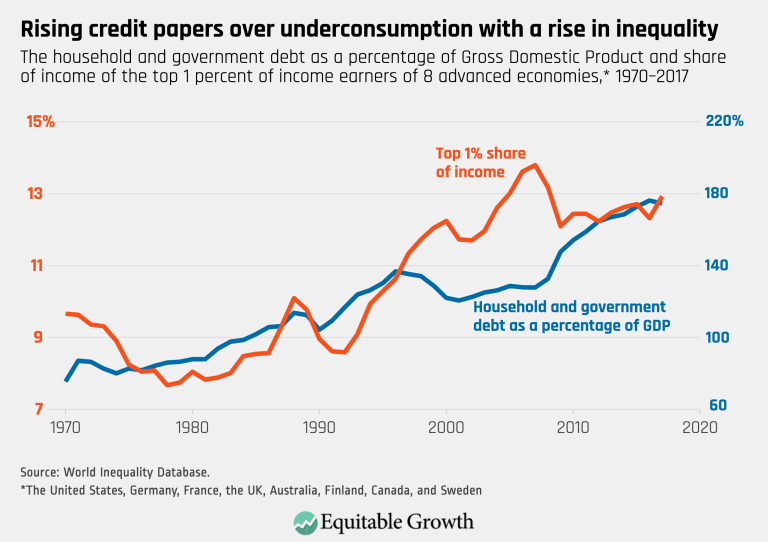
Rising credit papers over underconsumption with a rise in inequality (opens in a new tab)
Visualizations May 20, 2021
 View Chart
(opens in a new tab)
View Chart
(opens in a new tab)
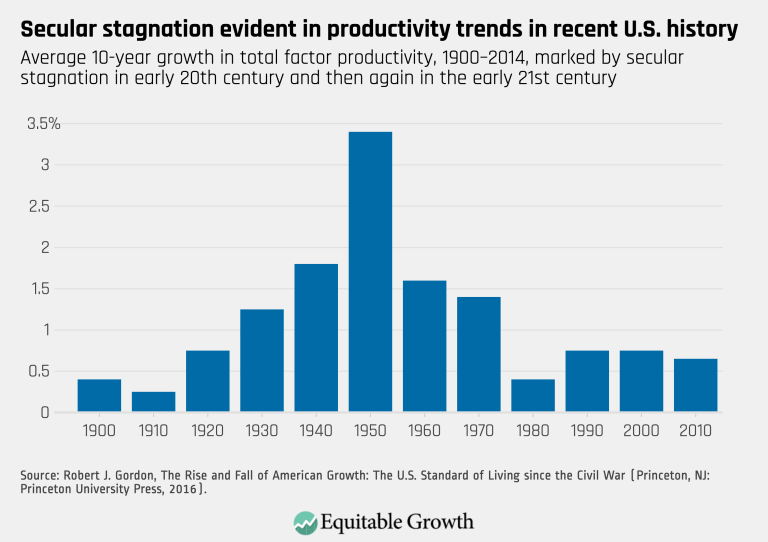
Secular stagnation evident in productivity trends in recent U.S. history (opens in a new tab)
Visualizations May 20, 2021
 View Chart
(opens in a new tab)
View Chart
(opens in a new tab)
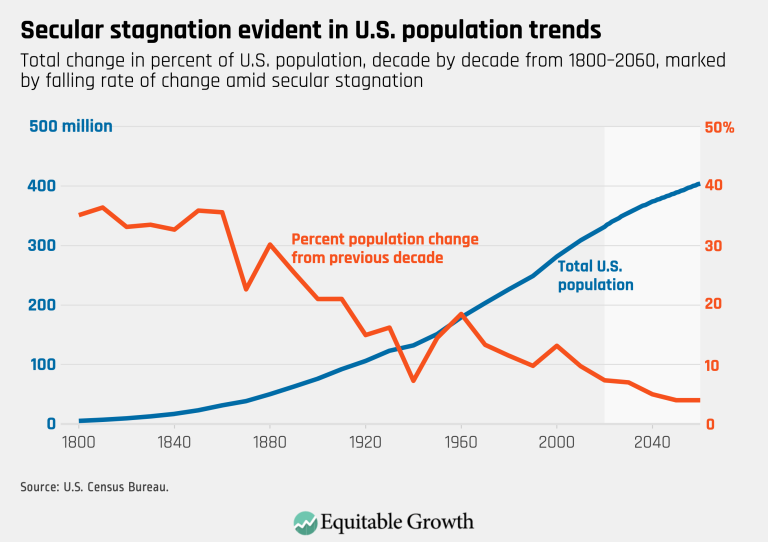
Secular stagnation evident in U.S. population trends (opens in a new tab)
Visualizations May 20, 2021
 View Chart
(opens in a new tab)
View Chart
(opens in a new tab)
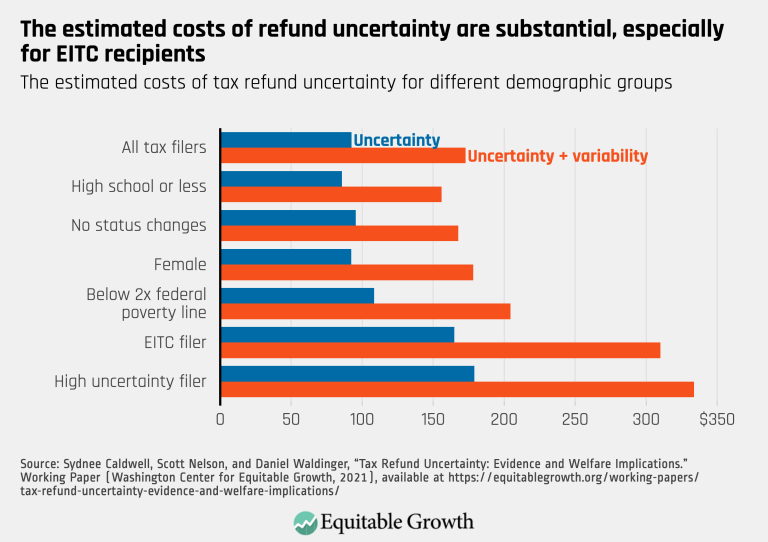
The estimated costs of refund uncertainty are substantial, especially for EITC recipients (opens in a new tab)
Visualizations Apr 13, 2021
 View Chart
(opens in a new tab)
View Chart
(opens in a new tab)
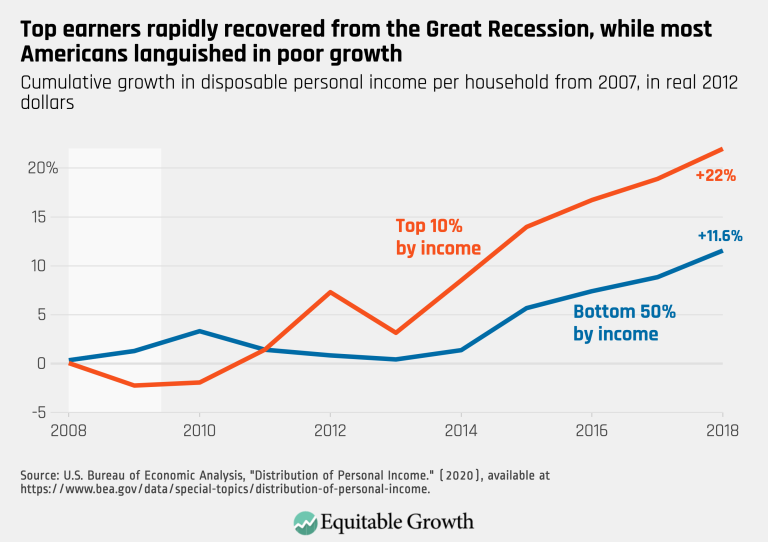
Top earners rapidly recovered from the Great Recession, while most Americans languished in poor growth (opens in a new tab)
Visualizations Mar 4, 2021
 View Chart
(opens in a new tab)
View Chart
(opens in a new tab)
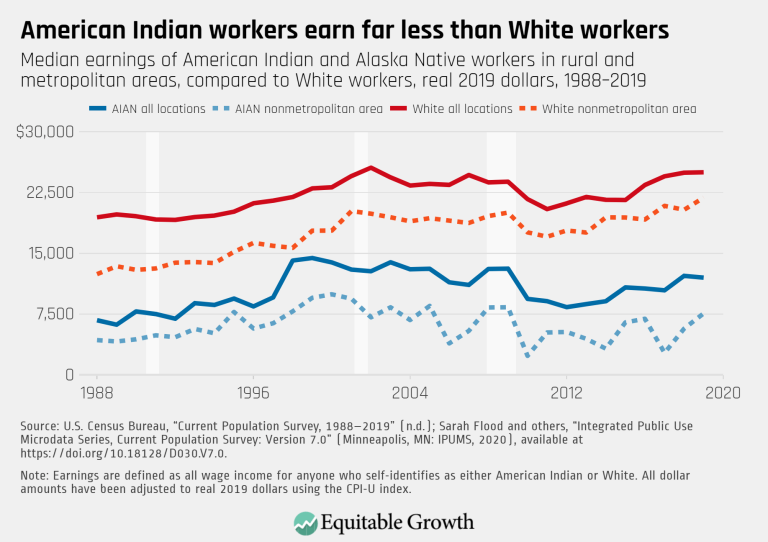
American Indian workers earn far less than White workers (opens in a new tab)
Visualizations Jan 11, 2021
 View Chart
(opens in a new tab)
View Chart
(opens in a new tab)
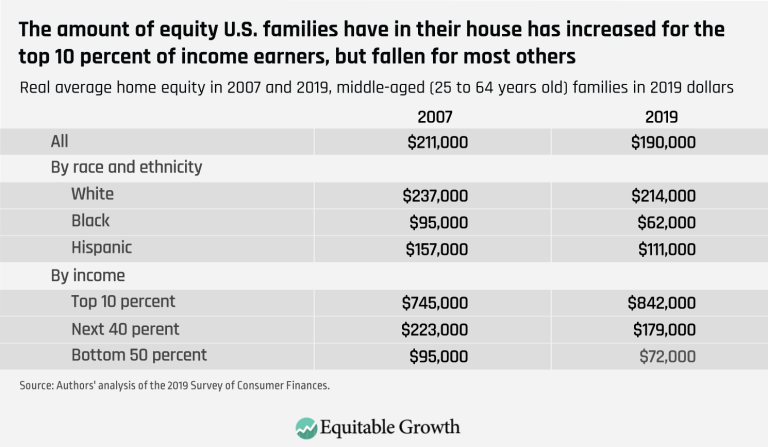
The amount of equity U.S. families have in their house has increased for the top 10 percent of income earners, but fallen for most others (opens in a new tab)
Visualizations Oct 13, 2020
 View Chart
(opens in a new tab)
View Chart
(opens in a new tab)
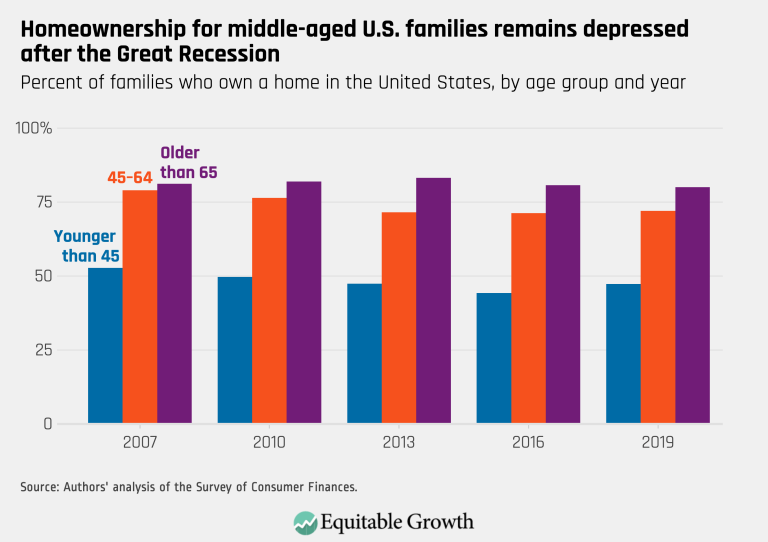
Homeownership for middle-aged U.S. families remains depressed after the Great Recession (opens in a new tab)
Visualizations Oct 9, 2020
 View Chart
(opens in a new tab)
View Chart
(opens in a new tab)
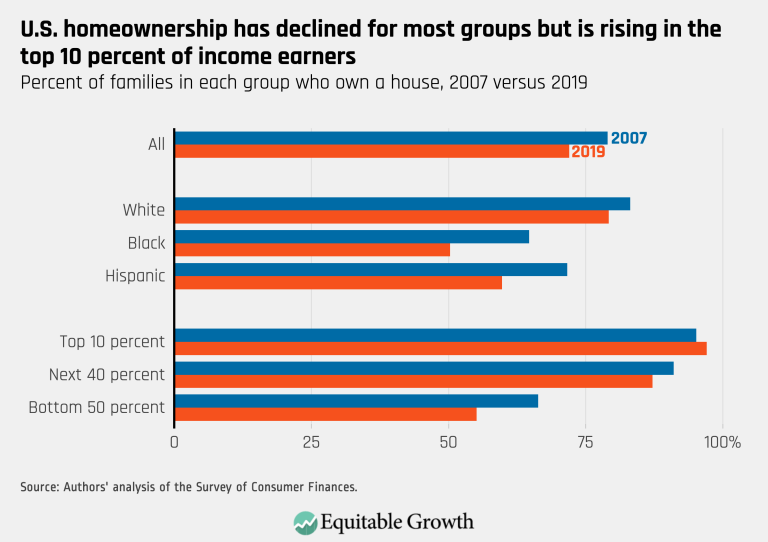
U.S. homeownership has declined for most groups but is rising in the top 10 percent of income earners (opens in a new tab)
Visualizations Oct 9, 2020
 View Chart
(opens in a new tab)
View Chart
(opens in a new tab)
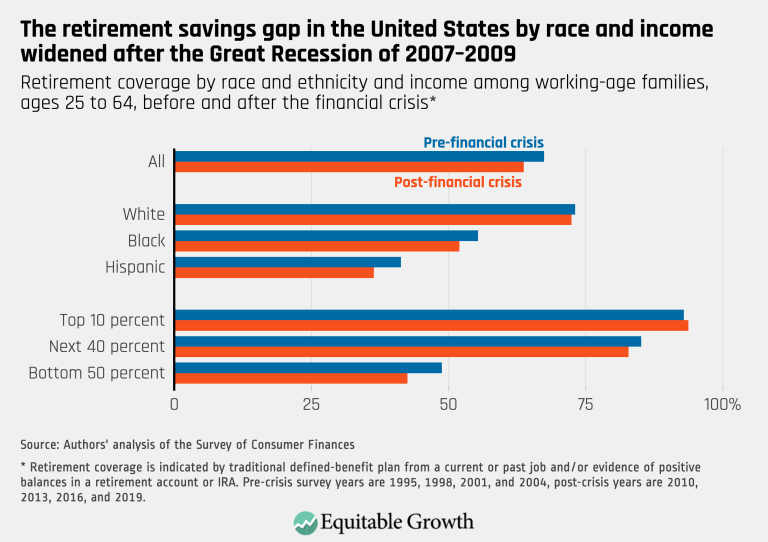
The retirement savings gap in the United States by race and income widened after the Great Recession of 2007–2009 (opens in a new tab)
Visualizations Oct 7, 2020
 View Chart
(opens in a new tab)
View Chart
(opens in a new tab)
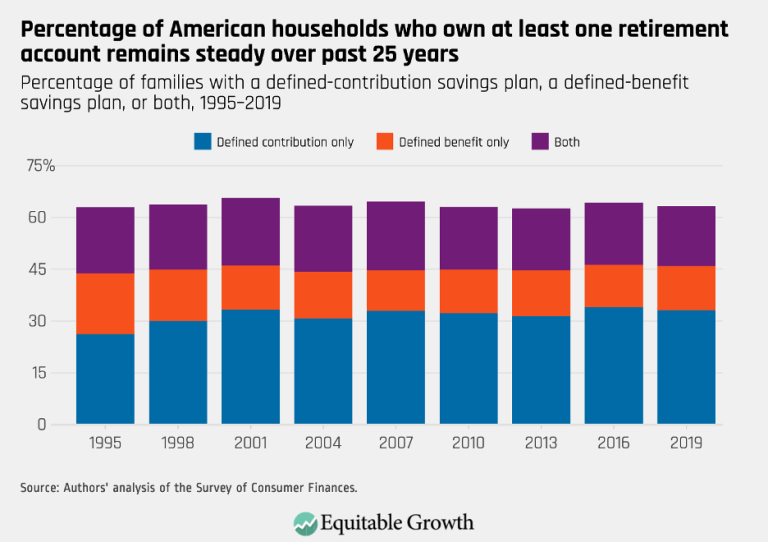
Percentage of American households who own at least one retirement account remains steady over past 25 years (opens in a new tab)
Visualizations Oct 6, 2020









































Your Source for the Latest Insights
Get updates on our latest research, event announcements, and policy insights delivered straight to your inbox. Stay connected with the leading voices on equitable growth.