



Policy
What Work Does Generative AI Do?
Essays SEP 8, 2026
By: Alexander Bick, Adam Blandin, David Deming, Tyler Schumacher
AI, Tech & Energy
Labor, Wages & Worker Power
 Browse All Resources
APR 7, 2023

On April 7, the U.S. Bureau of Labor Statistics released new data on the U.S. labor market during the month of March. Below are five graphs compiled by Equitable Growth staff highlighting important trends in the data.
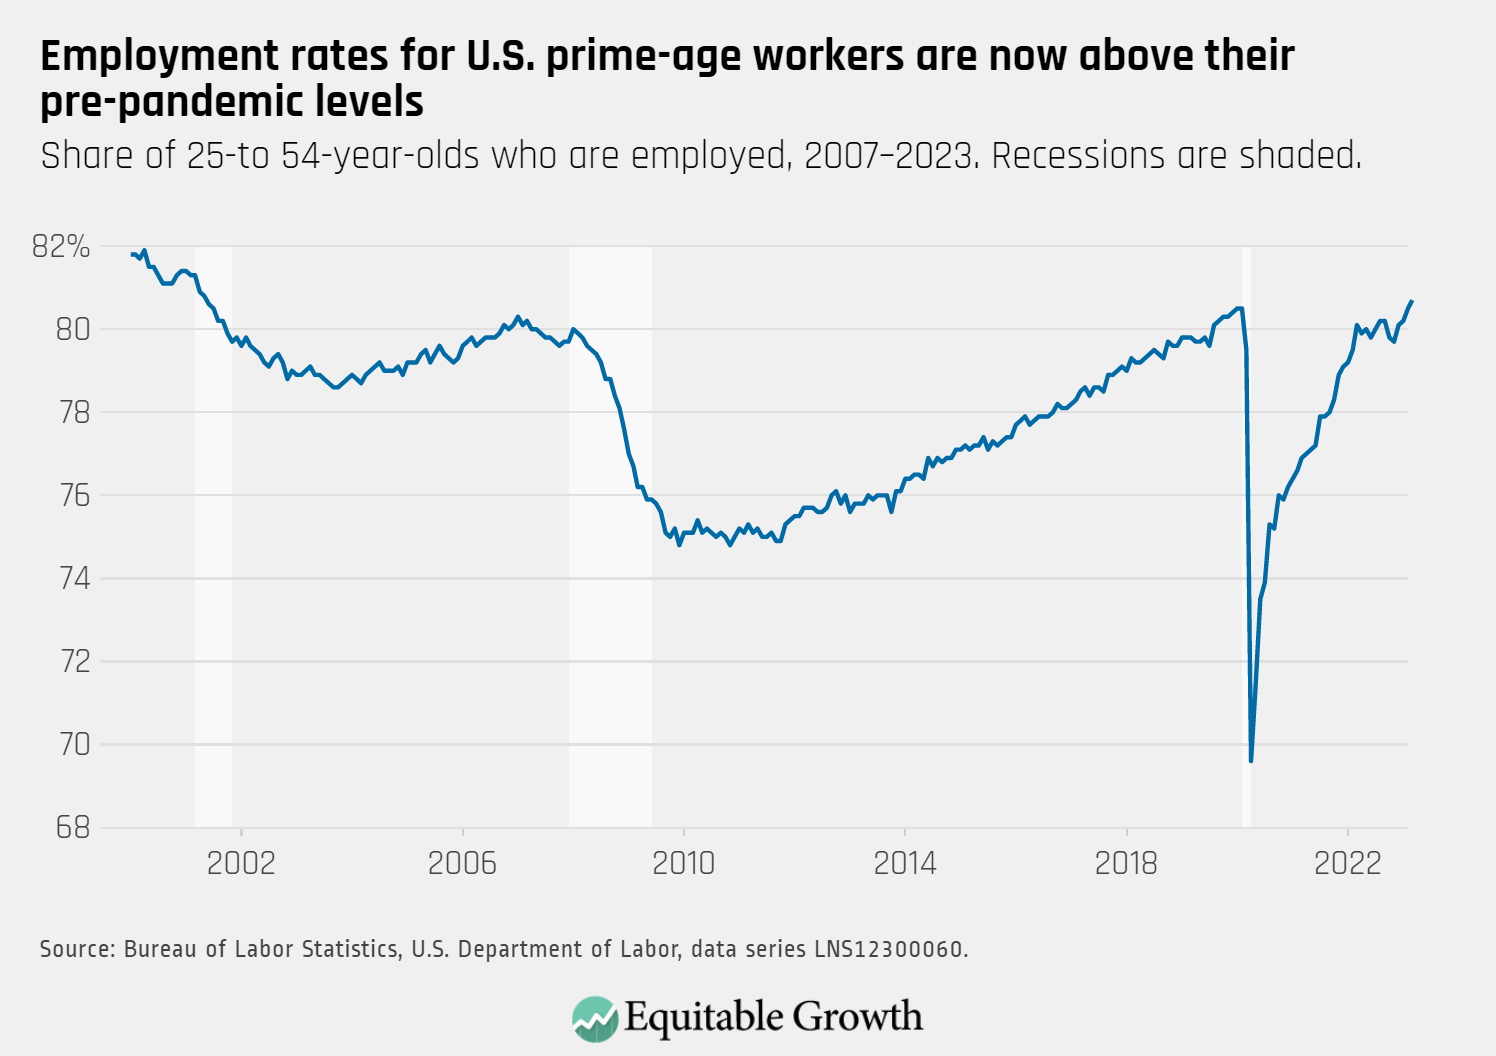
The employment rate for prime-age workers increased from 80.5 percent in February to 80.7 percent in March as total nonfarm employment rose by 236,000.
The unemployment rate declined slightly to 3.5 percent in March, and remains high for Black workers (5.0 percent) and Hispanic workers (4.6 percent) compared to White workers (3.2 percent) and Asian American workers (2.8 percent).
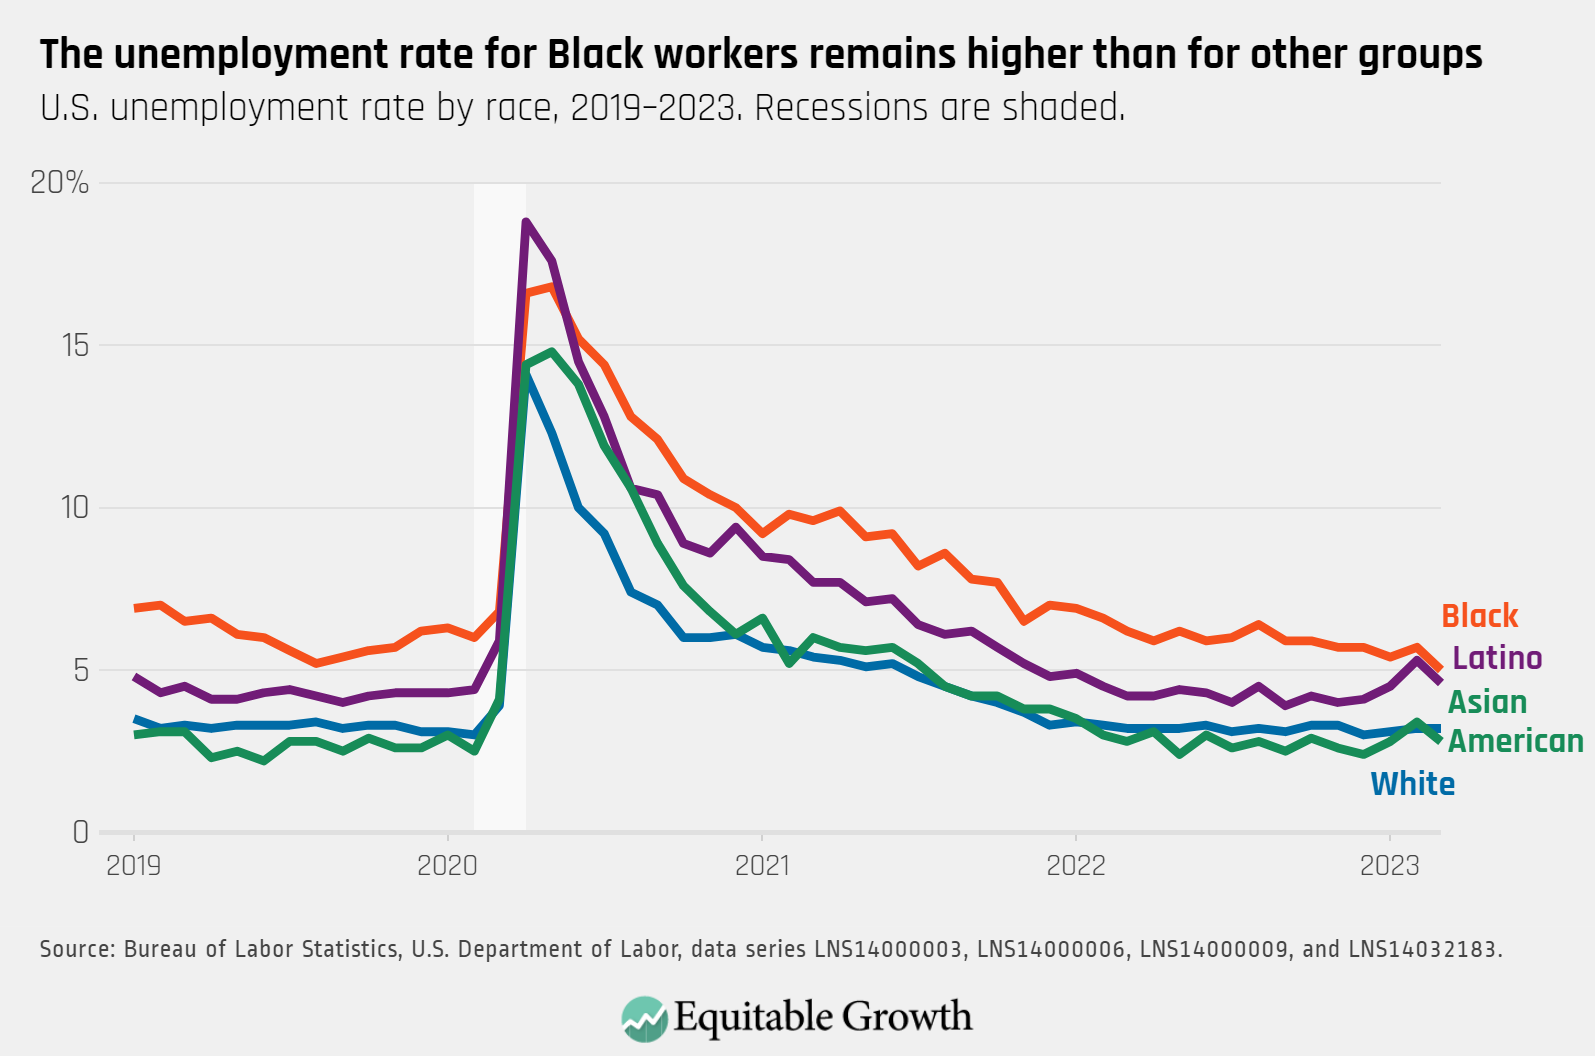
U.S. unemployment rate by race, 2019–2023. Recessions are shaded.
Both public-sector and private-sector employment rose in March, though public-sector employment has recovered more slowly and remains below pre-pandemic levels.
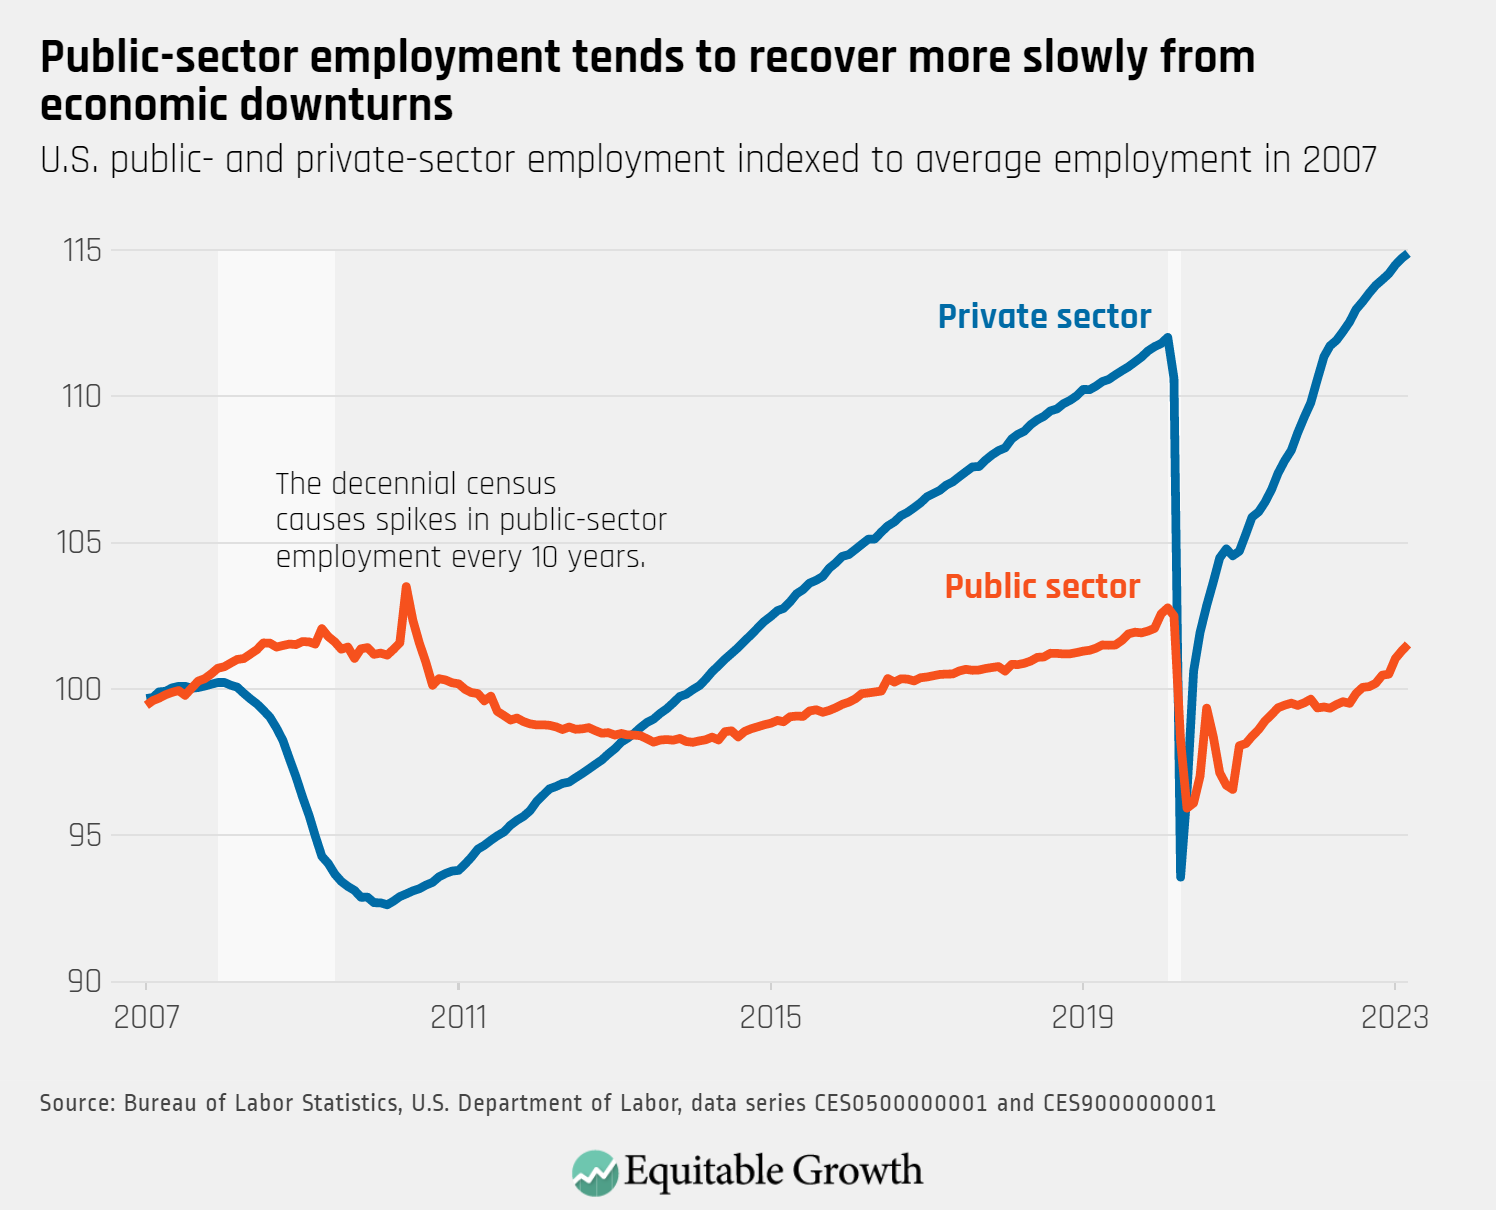
U.S. public- and private-sector employment indexed to average employment in 2007
Nominal wage growth (not accounting for inflation) declined in March, with average hourly earnings growth at 4.2 percent over the past 12 months, down from 4.6 percent in February.
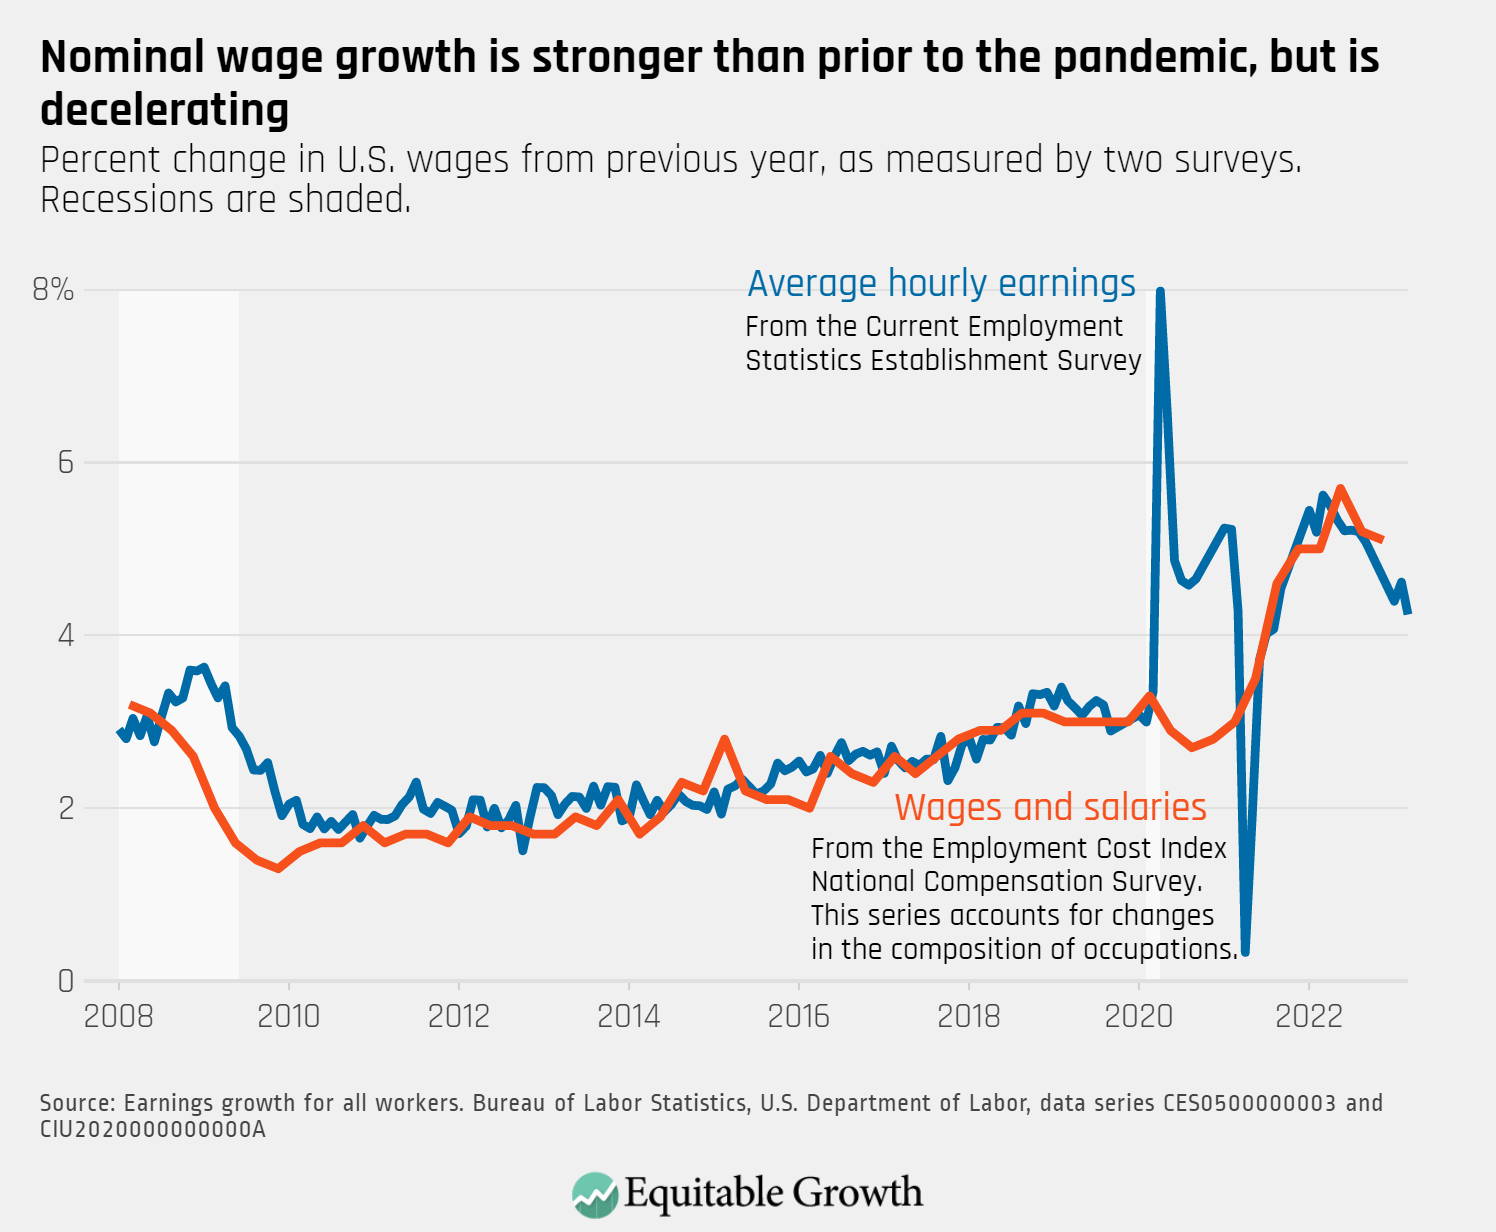
Percent change in U.S. wages from previous year, as measured by two surveys. Recessions are shaded.
Top-line unemployment (known as U-3) and a broader measure of labor underutilization (known as U-6) declined slightly in March, as both overall unemployment and underemployment are around pre-pandemic levels.
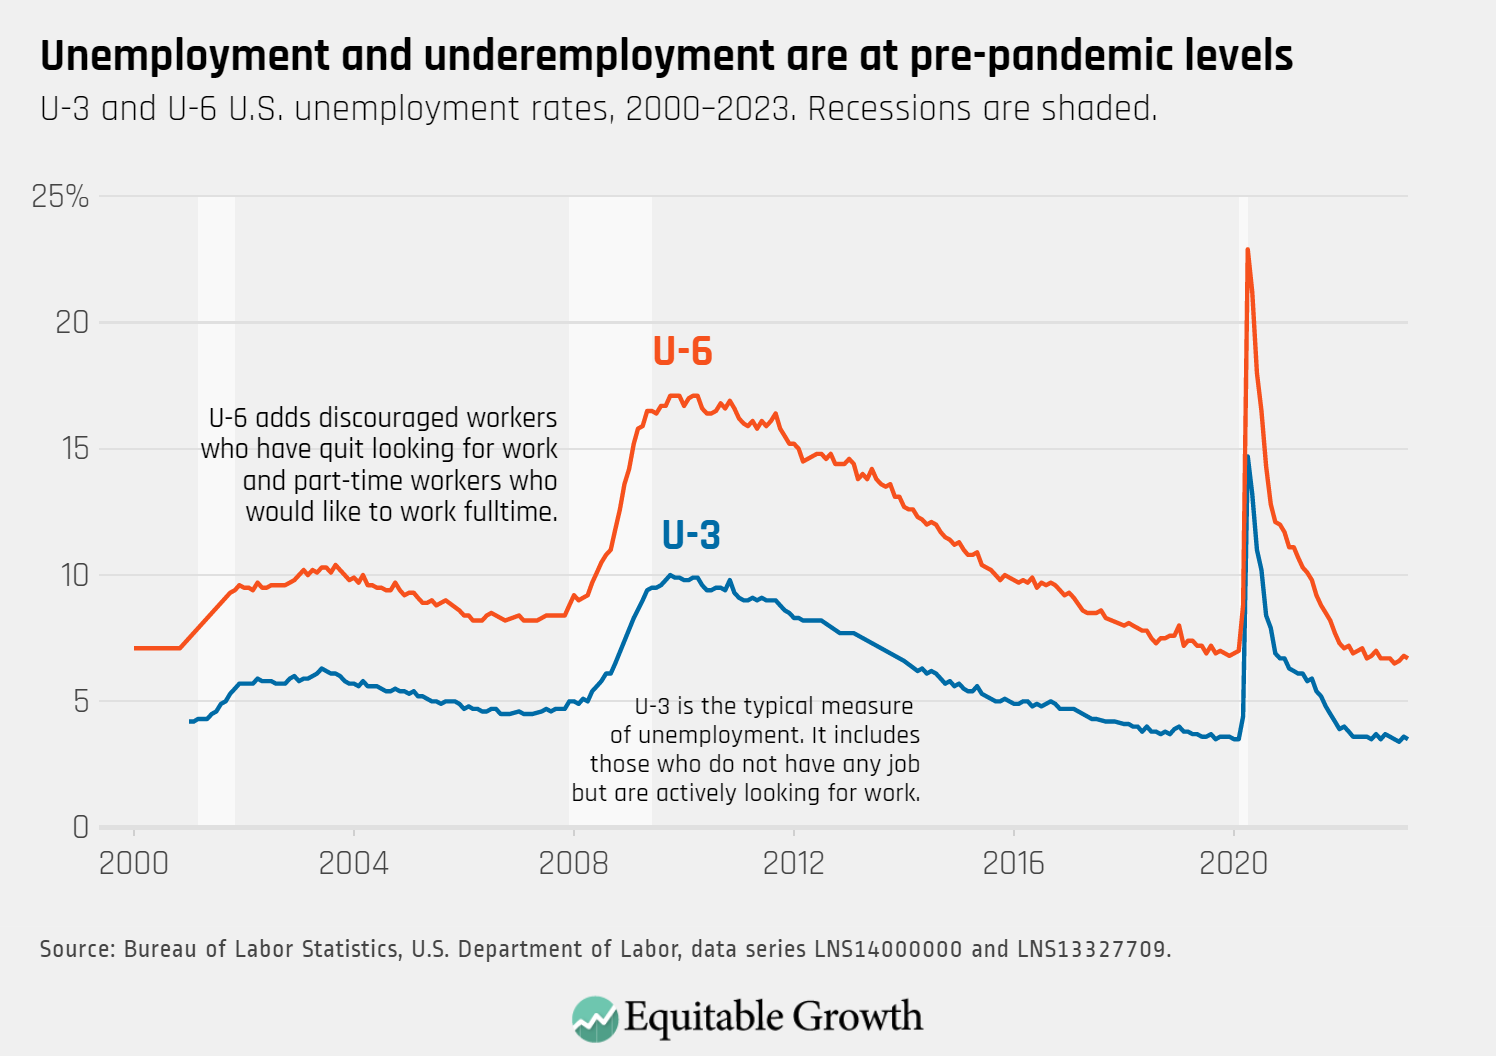
U-3 and U-6 U.S. unemployment rates, 2000–2023. Recessions are shaded.
Essays SEP 8, 2026
By: Alexander Bick, Adam Blandin, David Deming, Tyler Schumacher
Working Papers SEP 8, 2026
By: Alexander Bick, Adam Blandin, David Deming, Tyler Schumacher

Essays SEP 2, 2026
By: Megan Rivera
Get updates on our latest research, event announcements, and policy insights delivered straight to your inbox. Stay connected with the leading voices on equitable growth.


