




Policy
What Work Does Generative AI Do?
Essays SEP 8, 2026
By: Alexander Bick, Adam Blandin, David Deming, Tyler Schumacher
AI, Tech & Energy
Labor, Wages & Worker Power
 Browse All Resources
JUN 29, 2016
By: Heather Boushey and Kavya Vaghul
For families in the United States with children ages five and under—whether in married- or single-parent homes—mothers have been essential to bolstering economic security. Mothers’ increased working hours helped stabilize and boost family income. In the face of decreasing economic security, though, these large increases in hours worked by mothers, especially in households with young children who require physical and emotional care and nurturing, comes at a price: time.
As more mothers spend their days outside of the home trying to deliver much-needed financial stability, we need to understand the consequences of their work. As Heather Boushey documents in her book, “Finding Time: The Economics of Work-Life Conflict,” families now rely on those added hours and earnings of women. But for different types of families the transformations in the women’s role at home and at work mean different things. Especially for families with an infant or pre-school aged child, the challenges of how to address work-life conflicts can be acute. Without sufficient social infrastructure to help while parents are at work —such as paid family leave, paid sick days, flextime, predictable schedules, childcare, or universal high-quality prekindergarten programs—families are increasingly struggling to balance economic security with caregiving at home.
Read the full pdf in your browser (opens in a new tab)
This issue brief builds on the findings from “Finding Time” and explores how women’s increased hours of work and higher earnings have affected the incomes for families with young children. We unpack the role that women have played in helping stabilize family incomes across married-parents and single-parents with children age five or younger. Our findings are telling:
Over the past four decades in United States, the composition of families with children has changed markedly. Most importantly, there is an increase in diversity of family types. There is no longer a dominant “typical” family, especially not one with a breadwinning father, a care-taking mother, and their dependent children. Instead, there is a wide array of family types. Our definition of who comprises a family now—more than ever before—has expanded to include singles living alone, biologically unrelated individuals, or even a boarder who joins in on family dinner and helps out with homework.
Trends in marriage and fertility have both contributed to greater family complexity. Marriage (if it happens at all) happens later in life, and the median age of first marriage is now 29 for men and 27 for women—higher than at any point since the 1950s. And, of course, same sex marriage is now legal across the nation. At the same time, many women are delaying childbearing and the typical woman has her first child now at age 26. Further, children are increasingly being born into families with unmarried parents; in 2014, 40.3 percent of all births in 2014 were to an unmarried mother. What this means is that there is more complexity of family types.
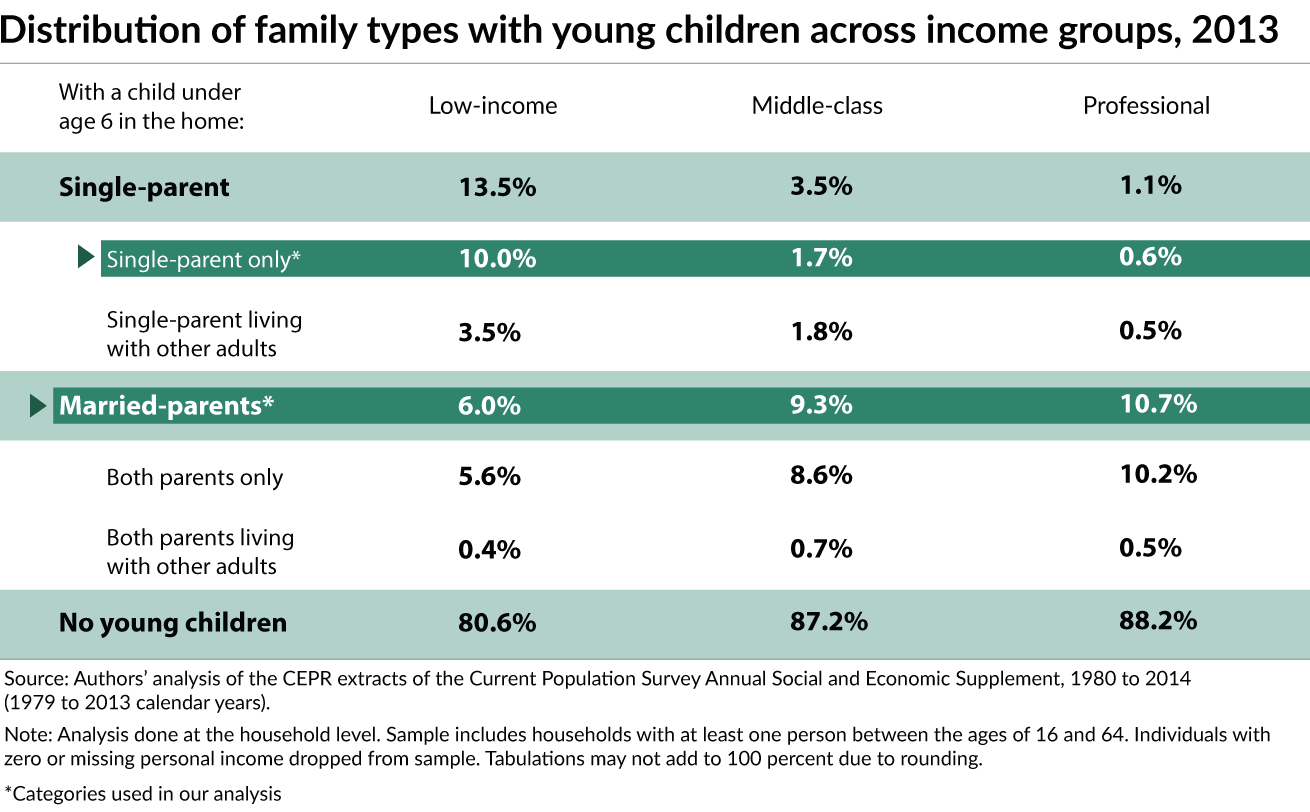
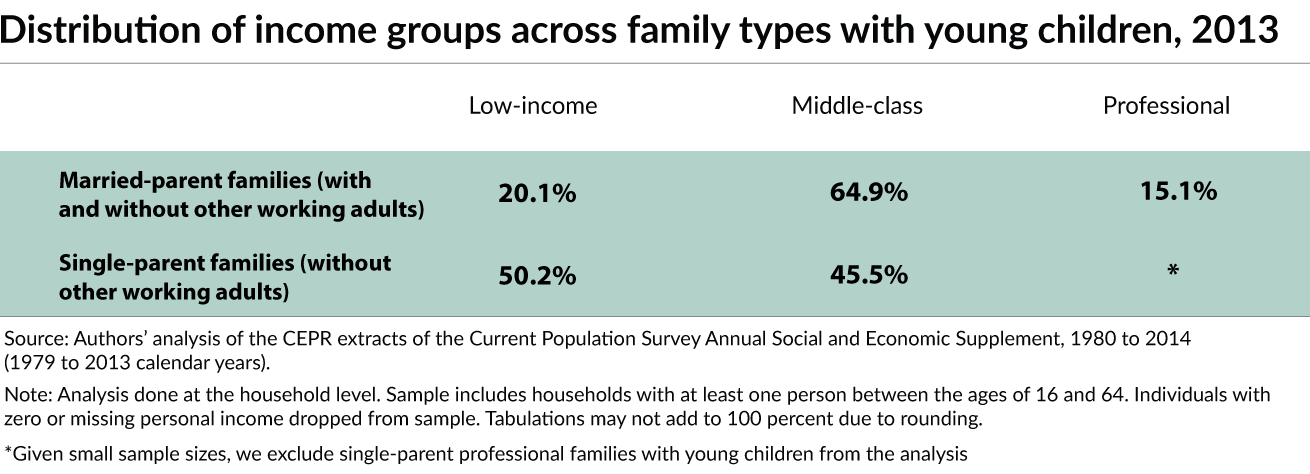
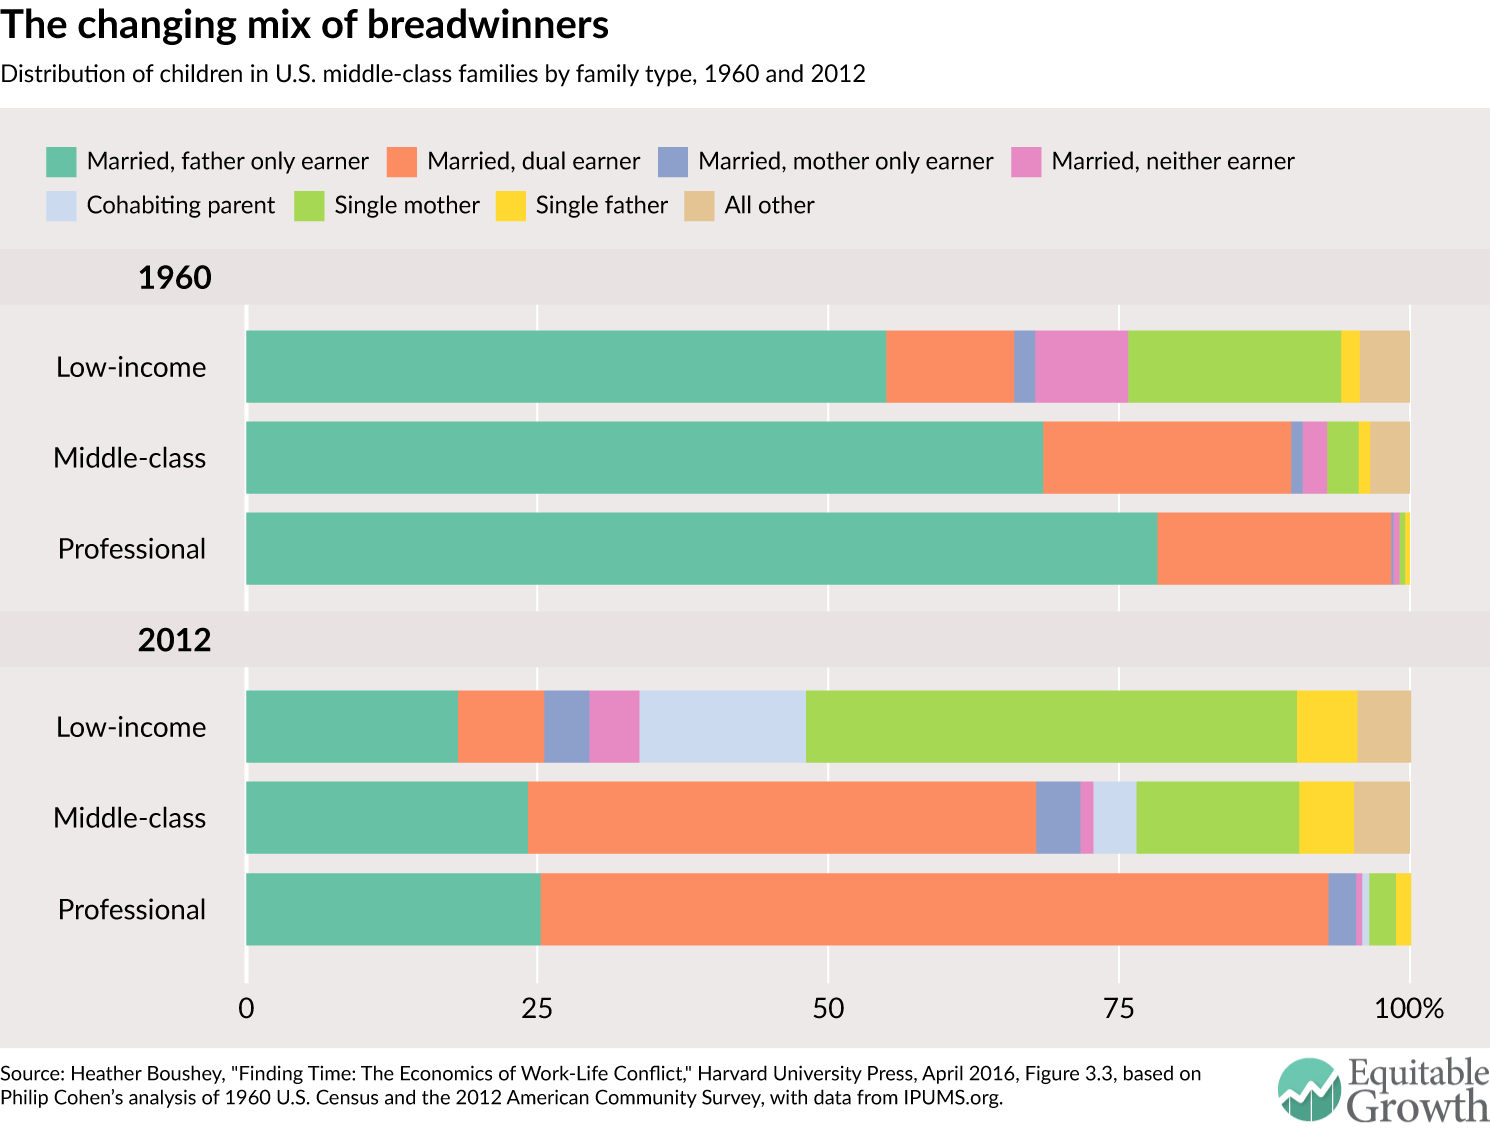
A second set of changes is who works and what this looks like across the income spectrum. While it used to be that most children were raised in married-couple families, be they at the top or the bottom of the income ladder. Now, however, while families at the top continue to raise children inside marriage—typically with both parents holding down a fairly high-paying job—children in families at the bottom of the income distribution—and now many in the middle—are living with a single, working parent, most often a mother. (See Figure 1.)
While families have become more complex, incomes have become more unequal. Faced with greater economic insecurity, families had to find ways to cope. One strategy was for women to increase their engagement with the economy. Initially, the “American wife” with school-age children migrated to the workforce, and soon after those with even younger children joined in. As women became more integrated into the workforce, they eventually became their families’ breadwinners, with two-thirds now either the main breadwinner or sharing that responsibility with their husband.
Using data from the Current Population Survey, we chronicle how family incomes changed between 1979 and 2013 for low-income, middle-class, and professional families by family type. Specifically, we decompose these changes over time into differences in male earnings, female earnings from higher wages, female earnings from more hours worked, and other sources of income, which include Social Security and pensions. (See Box.)
Defining income groups and family types
|
Before turning to the decomposition analysis, let’s first set some broad context for how family incomes and women’s hours changed between 1979 and 2013 for low-income, middle-class, and professional families with young children.
Between 1979 and 2013, while married-parent families had higher family income than single-parent families with young children, both types of families saw similar rates of growth in their income. (See Figure 2.)
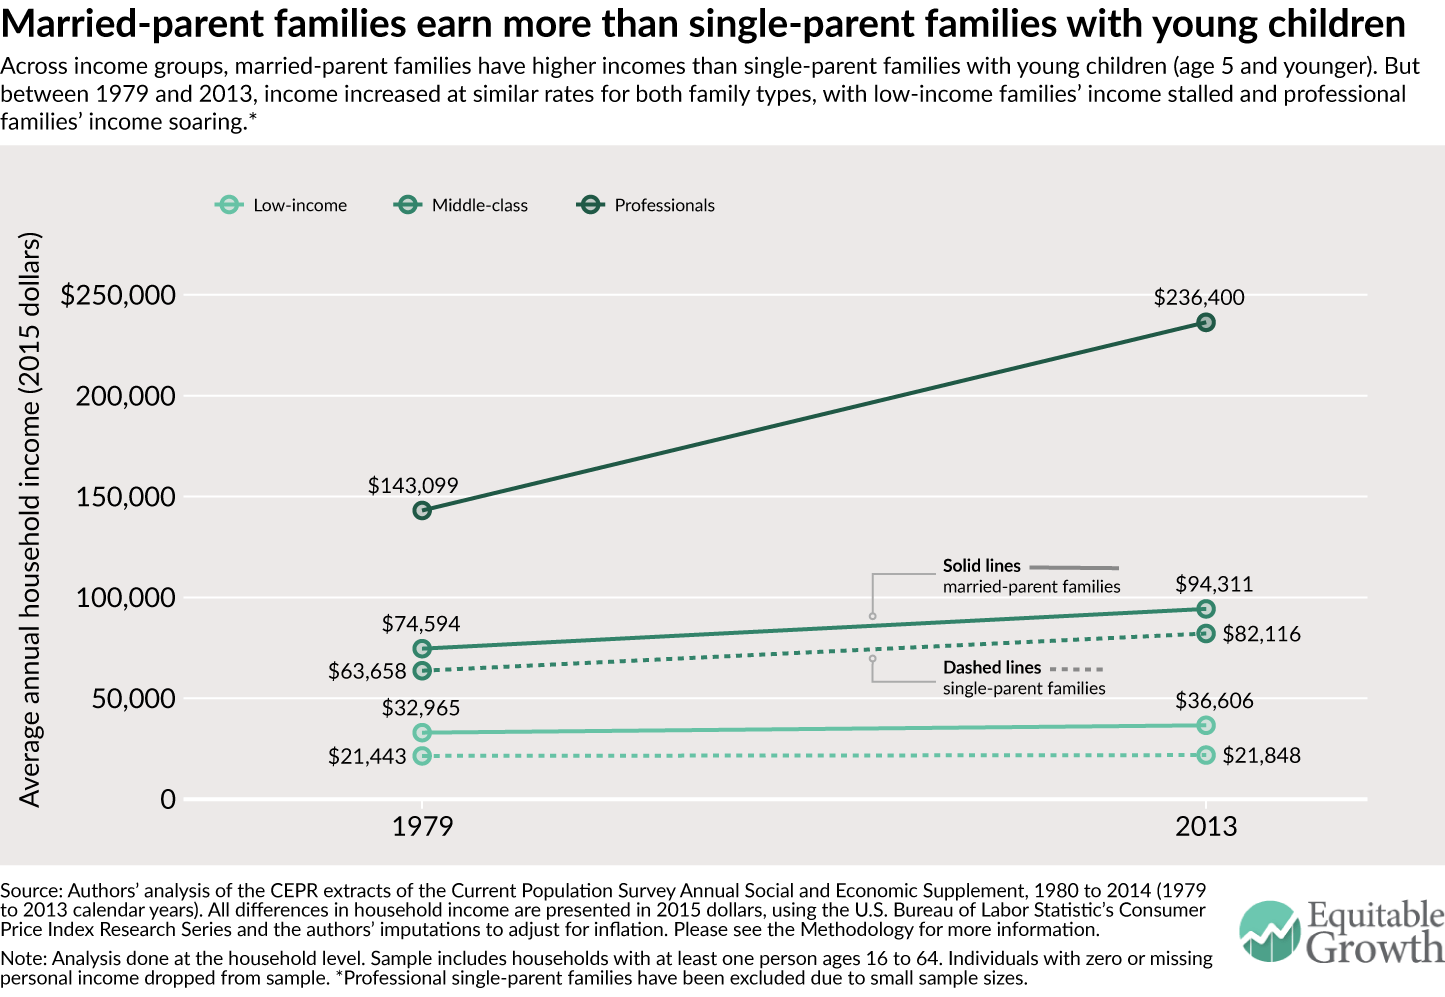
Figure 2 shows that between 1979 and 2013, low-income families with young children—both married and unmarried—saw a slight rise in their incomes. Married-parent families with young children earned substantially more than single-parent families. In 1979, low-income married-parent homes, on average, brought in $32,965 annually compared to the $22,443 earned by single-parent families with children age five and under. By 2013, these disparities still persisted, with married-parent families earning $36,606 and single-parent families earning $21,848 annually.
The gap in average annual income between married-parent and single-parent family types can be often—but not always—explained by simple addition: Married-couples, now more than ever before, often have two sources of income. Although low-income single-parent families had a smaller annual income, on average, than married-parent families, between 1979 and 2013, both their incomes grew at relatively small rates (1.9 percent and 11.0 percent, respectively). These rates of income growth for families with young children indicate that income stalled.
Figure 2 also shows that for middle-class families with young children, income rose between 1979 and 2013. As was the case for families across the low-income group, middle-class married-parent families with young children earned more, on average, in 1979 and 2013 than single-parent families. Yet, despite earning more, married-parent families’ income had similar rates of growth to single-parent families’; between 1979 and 2013, both married- and single-parent families with children age five and under grew their incomes by 26.4 percent and 29.0 percent, respectively.
Across the board, Figure 2 also shows that between 1979 and 2013, professional families with young children have seen their incomes soar, and married-families with young children, in particular, have seen outstanding gains. In 1979, professional married couple families with young children earned, on average, $143,099. By 2013, their average annual income had grown by 65.2 percent to $236,400. The gap between married-parent professional families’ income and low-income and middle-class families’ income has widened markedly over the past four decades.
Taking a look at the hours that women from different families and income groups work gives us some insight into why families with young children increased their incomes between 1979 and 2013. Across the board, over the past four decades, women from married-parent and single-parent families grew their hours of work markedly. (See Figure 3.)
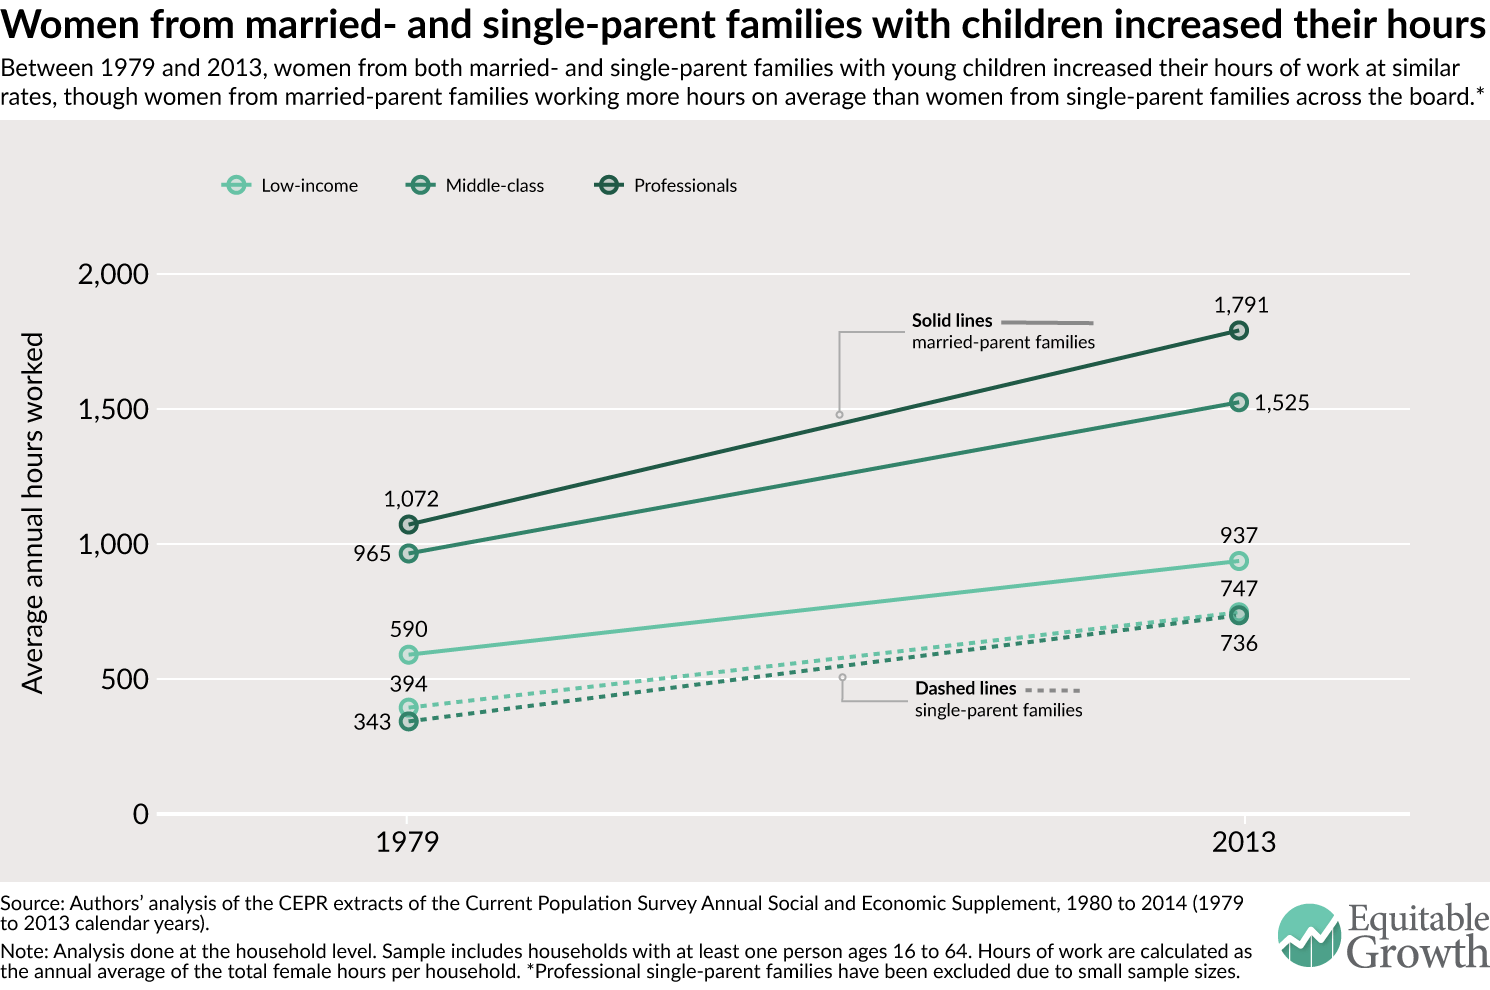
Figure 3 shows that in 1979, mothers of young children (and other working women) in married-couple families worked 590 hours annually (about 11.4 hours per week) and single-mothers worked 394 hours (7.6 hours per week). By 2013, women from both low-income married- and single-parent families with young children had grown their annual hours of work by 67.0 percent and 89.8 percent to 937 hours (18.0 hours per week) and 747 hours (14.4 hours per week), respectively.
Just like women from low-income families, Figure 3 shows that women from middle-class families with young children greatly increased their hours at work between 1979 and 2013. In 1979, women from middle-class married-parent and single-parent families with children age five and under worked an annual average of 965 hours (or 18.6 hours per week) and 343 hours (6.6 hours per week), respectively. In 2013, women from married-parent families with young children had increased their hours of work by 58.1 percent to 1,525 hours annually (29.3 hours weekly), and mothers in middle-class single-parent families had more than doubled their hours (an increase of 114.5 percent) to 736 (14.2 hours weekly).
Again, like we noted for other income groups, for professional families, women from homes with children age five and under had large increases in their hours of employment. Figure 3 shows that among professional families in 1979, women in married-couple families worked an annual average of 1,072 hours (20.6 hours per week), growing their hours by 67.0 percent to 1,791 annually (34.4 hours weekly) by 2013.
Though mothers (and other women) in professional married-couple families work more hours than middle-class and low-income, the rates of increase are relatively comparable across the board, corroborating the narrative that more and more women with young children have joined the workforce.
In Figure 2, we saw that between 1979 and 2013, across the board, married-parent families have higher incomes but similar rates of increase in income to single-parent families with young children. Figure 3 highlights that women from families with young children have been working more hours and perhaps have seen some of the largest increases in their hours at work.
Given these broad trends, a natural question arises about how the large increases in women’s hours relate to the large increases in family income for these families with young children. To unpack this correlation, we decompose the changes in families’ average household income between 1979 and 2013 into male earnings, female earnings, and income from other non-employment-related sources, which include Social Security and pensions and other sources.
Specifically, we divide female earnings into two parts: the portion due to women working more hours per year and that due to women earning more per hour. To calculate female earnings stemming directly from the additional hours worked, we take the difference between the 2013 female earnings and the hypothetical earnings of women if they earned 2013 hourly wages but worked the same hours as women did in 1979. (For more on how we did this calculation, please see our Methodology.) We find that within families with young children across the income ladder, the added hours of mothers have near single-handedly been a large and positive factor for income growth for low-income and middle-class families while women’s earnings overall have outweighed men’s positive earnings at the top. (See Figure 4.)
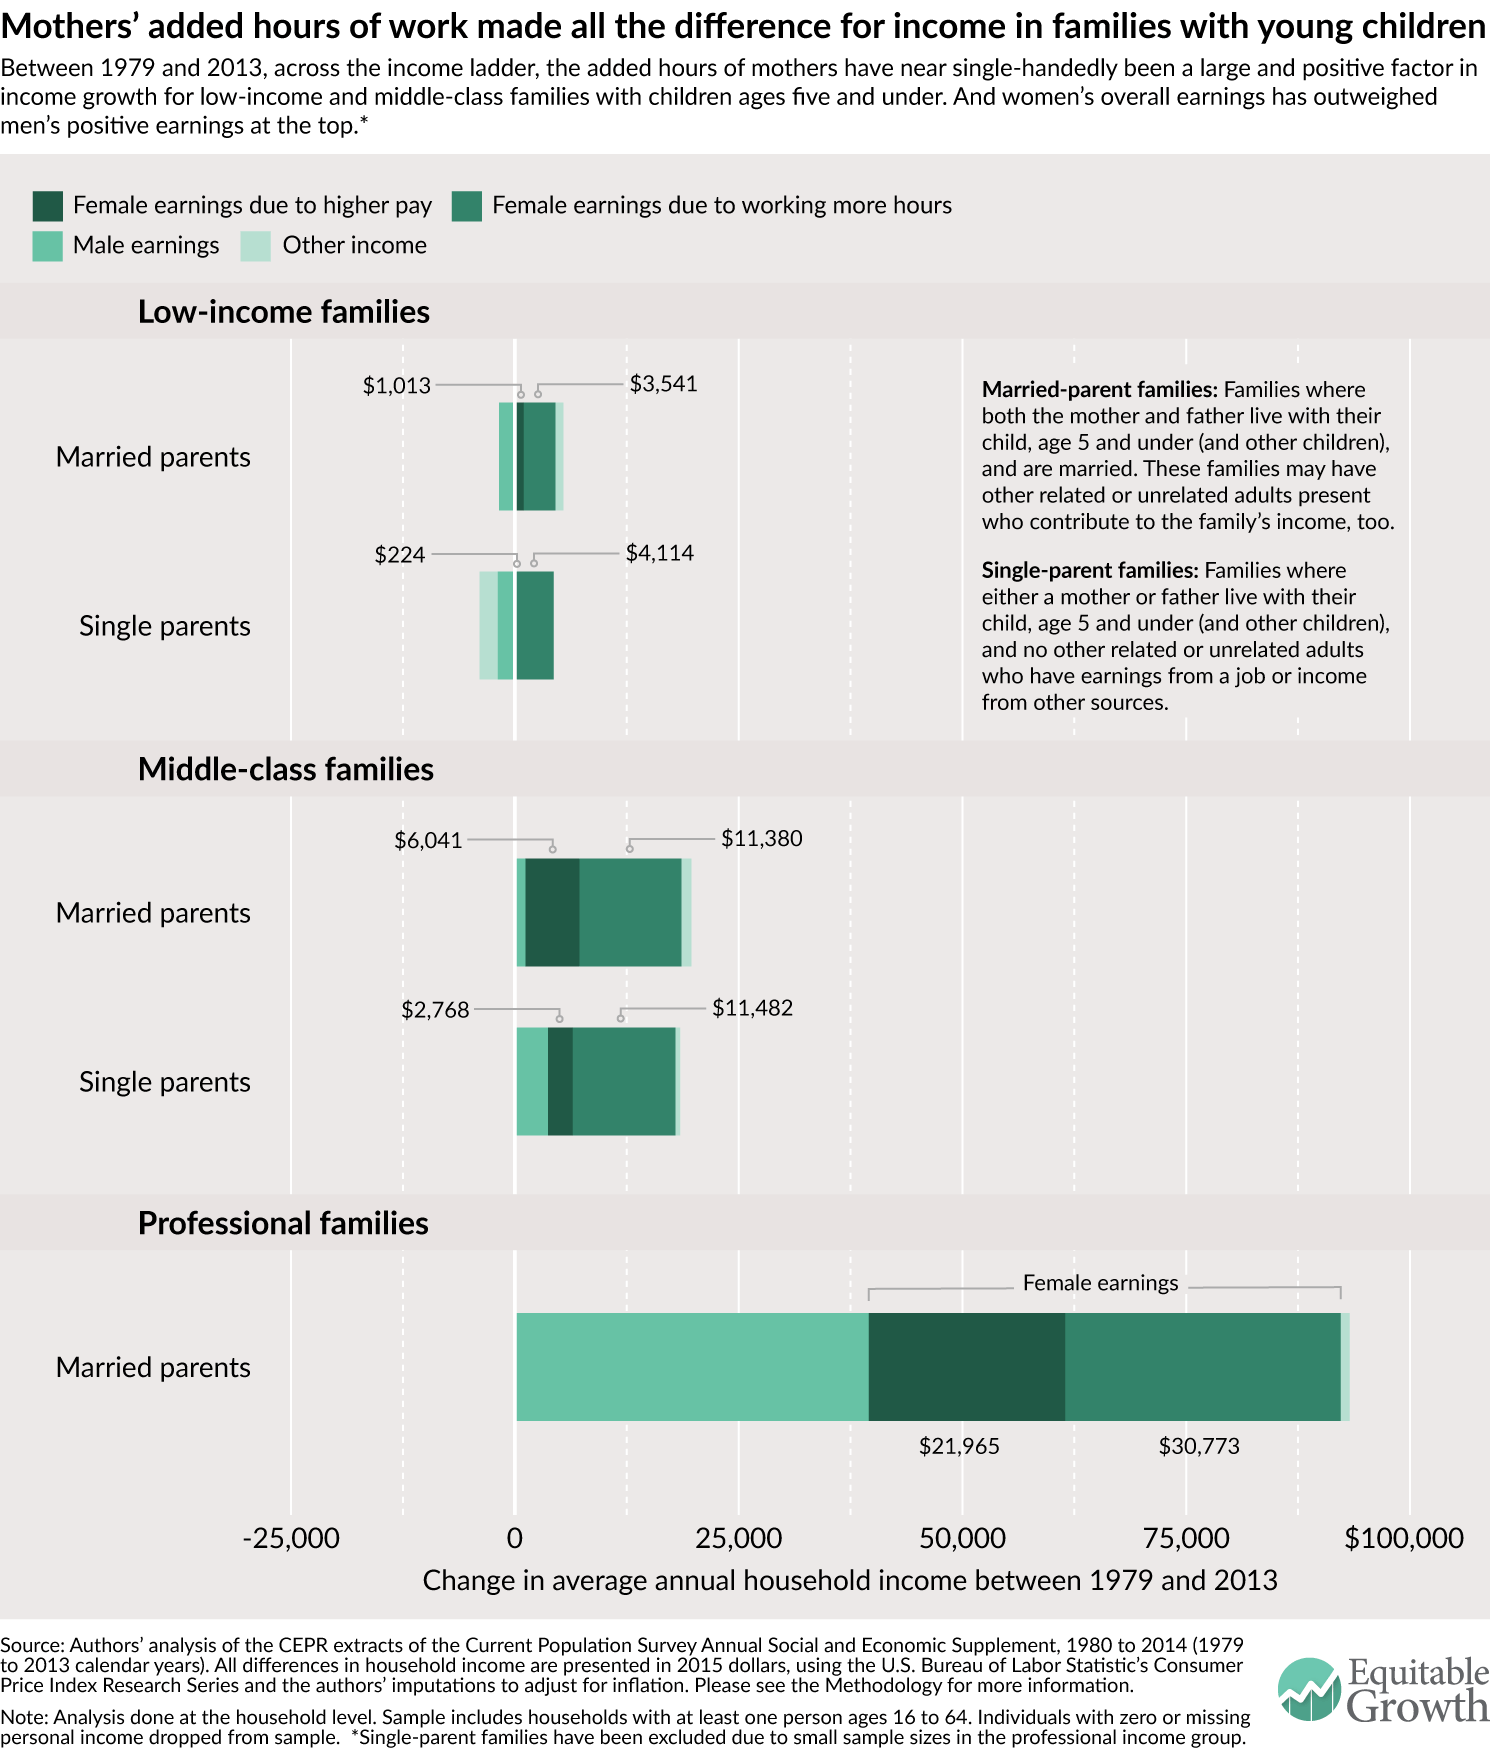
Figure 4 shows that for low-income families with young children, both women’s earnings from more hours and from higher wages protected against falling family incomes between 1979 and 2013. For married- and single-parent families with children five and under, men’s earnings pulled income down at varying degrees. Men in married-parent families and fathers in single-parent families lost $1,748 and $1,938 in earnings between 1979 and 2013, respectively.
In contrast, women’s added hours and higher pay boosted incomes in both low-income family groups. For low-income married-parent families with young children, women’s higher wages increased family incomes by an average of $1,013 while women’s added hours grew family income by an average of $3,541. Single-parent families saw similar substantial gains in mother’s economic contributions: Between 1979 and 2013, women’s higher wages contributed $224 to earnings and added hours boosted incomes by $4,114.
The changes in “other income” are also of interest. For low-income married-parent families, other income grew by $860, but for single-parent families, other income decreased by $1,997. For single-parent families, this decrease in reliance on other sources of income—which could include federal transfers such as supplemental nutrition assistance and Temporary Assistance for Needy Families as well as Social Security benefits—indicates that these policies may not be adequately supportive or sensitive to the needs of parenting alone.
Across the board, middle-class families, like low-income families, saw positive increases in their income largely due to the contributions of women and their increased labor force participation. Figure 4 shows that for both middle-class married- and single-parent families of young children, male earnings made a relatively small, positive addition of $1,205 and $3,706, respectively.
Women’s earnings, in contrast, were positive and large. Women’s earnings from higher wages added $6,041 and $2,768 for married-parent and single-parent families, respectively. The additions due to women’s added hours at work were more impressive, as women from married- and single-parent homed secured an additional $11,380 and $11,482, respectively.
Other income across the the two middle-class family types with also helped increase income.
As we saw in Figures 2 and 3, not only do mothers in professional married-parent families with young children work the longest hours but also their family incomes have also grown considerably. These changes are well-captured when we decompose family income, where we find that both women’s added earnings from higher wages and hours are important. At the same time, we see that men have made near-equal contributions to their families’ income growth, as well.
Figure 4 shows that between 1979 and 2013, men in professional married-parent families with young children added $39,540 to family income. Despite the immense boost from male earnings, female earnings added the most to family income—a total of $52,738, which breaks down into $21,965 from higher wages and $30,773 from more hours worked.
Our findings tell is that working mothers with children ages five and under are indispensable to their families’ bottom line. So what does that mean for the other indispensable role played by mothers—as caregivers? Policymakers need to consider how a full panoply of policies, such as universal high-quality childcare and prekindergarten programs, paid family and medical leave, and flexible scheduling at work can help them balance the lives of these mothers as productive members of our workforce and caregivers.
It’s not enough just to have these policies in place, though. How we address the time-squeeze on U.S. families must be sensitive to the changing definitions of what it means to be a family in the United States and what that tangibly means for the way in which they give care.
—Heather Boushey is the Executive Director and Chief Economist at the Washington Center for Equitable Growth and the author of the book from Harvard University Press, “Finding Time: The Economics of Work-Life Conflict.” Kavya Vaghul is a Research Analyst at Equitable Growth.
The authors would like to thank John Schmitt, Ben Zipperer, Dave Evans, Ed Paisley, David Hudson, and Bridget Ansel. All errors are, of course, ours alone.
The methodology used for this issue brief is identical to that detailed in the Appendix to Heather Boushey’s “Finding Time: The Economics of Work-Life Conflict.”
In this issue brief, we use the Center for Economic and Policy Research extracts of the Current Population Survey Annual Social and Economic Supplement for survey years 1980 and 2014 (calendar years 1979 and 2013). The CPS provides data on income, earnings from employment, hours, and educational attainment. All dollar values are reported in 2015 dollars, adjusted for inflation using the Consumer Price Index Research Series available from the U.S. Bureau of Labor Statistics. Because the Consumer Price Index Research Series only includes indices through 2014, we used the rate of increase between 2014 and 2015 in the Consumer Price Index for all urban consumers from the Bureau of Labor Statistics to scale up the Research Series’ 2014 index value to a reasonable 2015 index estimate. We then used this 2015 index value to adjust all results presented.
For ease of composition, throughout this brief we use the term “family,” even though the analysis is done at the household level. According to the U.S. Census Bureau, in 2014, two-thirds of households were made up of families, defined as at least one person related to the head of household by birth, marriage, or adoption.
We divide our sample into three income groups—low-income, middle-class, and professional households—using the the definitions outlined in “Finding Time.” For calendar year 2013, the last year for which we have data at the time of this analysis, we categorized the income groups as follows:
Note that all cut-offs above are displayed in 2015 dollars, using the inflation adjustment method presented earlier.
In our analysis, we limit the universe to persons with non-missing, positive income of any type. This means that even if a person does not have earnings from some form of employment but does receive income from Social Security, pensions, or any other source recorded by the CPS, they are included in our analysis.
These data are decomposed into income changes between 1979 and 2013 for low-income, middle-class, and professional families. The actual household income decomposition uses a simple shift-share analysis to find the differences in earnings between 1979 and 2013 and calculate the extra earnings due to increased hours worked by women.
To do this, we first calculate the male, female, and other earnings by the three income categories. To calculate the sex-specific earnings per household, we sum the income from wages and income from self-employment for men and women, respectively. The amount for other earnings is derived by subtracting the male and female earnings from total household earnings. We average the household, male, female, and other earnings by each income group for 1979 and 2013, and take the differences between the two years to show the raw changes in earnings by each income group.
To find the change in hours, for each year by household, we sum the total hours worked by men and women. We average these per-household male and female hours, by year, for each of the three income groups.
Finally, we calculate the counterfactual earnings of women. We use the 2013 earnings per hour for women and multiply it by the 1979 hours worked by women. Finally, we subtract this counterfactual earnings from the female earnings in 2013, arriving at the female earnings due to additional hours.
We repeated this analysis for families of different family types that had children age five and below (young children). The first family type we analyze was married-parent families—households that have both a mother and father who are married and their own young child. These married-parent households may also include older children or adults, both related and unrelated, including adult children, some of whom may be earning and contributing to household income.
The second family type we observed was single-parent families—households where either a mother and her own young child or a father and his young child is present. This family type excludes other adults if they are contributing personal income of any type to household income. Because of small household sample sizes, single-parent families were excluded from the analysis of professional families. While these family type categories do dissect some of the nuance in family structures, we acknowledge that they are oversimplifications of complex family inter-relationships and that they do not capture the diversity of family types that exist today. However, breaking the categories down smaller does not give us enough of a sample size for our analysis.
One important point to note is that because of the nature of this shift-share analysis, the averages don’t exactly tally up to the raw data. Therefore, when presenting average income, we use the sum of the decomposed parts of income. While economists typically show median income, for ease of composition and the constraints of the decomposition analysis, we show the averages so that the data are consistent across figures. Another important note is that we make no adjustments for changes over time in topcoding of income, which likely has the effect of exaggerating the increase in professional families’ income relative to the other two income groups.
Essays SEP 8, 2026
By: Alexander Bick, Adam Blandin, David Deming, Tyler Schumacher
Working Papers SEP 8, 2026
By: Alexander Bick, Adam Blandin, David Deming, Tyler Schumacher

Essays SEP 2, 2026
By: Megan Rivera
Get updates on our latest research, event announcements, and policy insights delivered straight to your inbox. Stay connected with the leading voices on equitable growth.


