




Policy
What Work Does Generative AI Do?
Essays SEP 8, 2026
By: Alexander Bick, Adam Blandin, David Deming, Tyler Schumacher
AI, Tech & Energy
Labor, Wages & Worker Power
 Browse All Resources
JUL 12, 2019

This is a weekly post we publish on Fridays with links to articles that touch on economic inequality and growth. The first section is a round-up of what Equitable Growth published this week, and the second is the work we’re highlighting from elsewhere. We won’t be the first to share these articles, but we hope by taking a look back at the whole week, we can put them in context.
Hourly wages among U.S. workers vary enormously by gender, race, and education level. In order to address and identify these variances, we updated our wage comparison tool, which was originally published by former Equitable Growth Research Director John Schmitt and former Analyst Kavya Vaghul, along with our Computational Social Scientist Austin Clemens. This interactive tool provides a way to see just how much wages vary within and across demographic groups. The data behind this interactive are derived from the Center for Economic and Policy Research extracts of the Current Population Survey Outgoing Rotation Group.
The Congressional Budget Office score forecasting significant job losses from a minimum wage increase relies too heavily on old research and not sufficiently on new studies. Recent research makes clear that badly needed increases in the minimum wage can produce substantial wage hikes for workers without significant job loss. This op-ed by Director of Labor Market Policy and economist Kate Bahn puts into context the anticipated CBO scoring of the minimum wage legislation currently being considered in the U.S. House of Representatives. Bahn and Research Assistant Will McGrew also compiled this factsheet, which contextualizes the CBO report in light of the cutting-edge econometric research on minimum wage increases from economists and other scholars in Equitable Growth’s network.
In light of the recent introduction of the “Raise the Wage Act,” Creative Director Dave Evans , along with former Equitable Growth economist Ben Zipperer and Research Assistant Will McGrew updated their analysis on the minimum-to-median wage ratios across states. They provide an interactive graphic that demonstrates that most states had much stronger minimum wages more than 30 years ago than they do today. They conclude that a federal $15 minimum wage would benefit a majority of the states.
Last Friday, the U.S. Bureau of Labor Statistics released new data on the U.S. labor market during the month of June. Kate Bahn and I compiled five graphs highlighting important trends in the data.
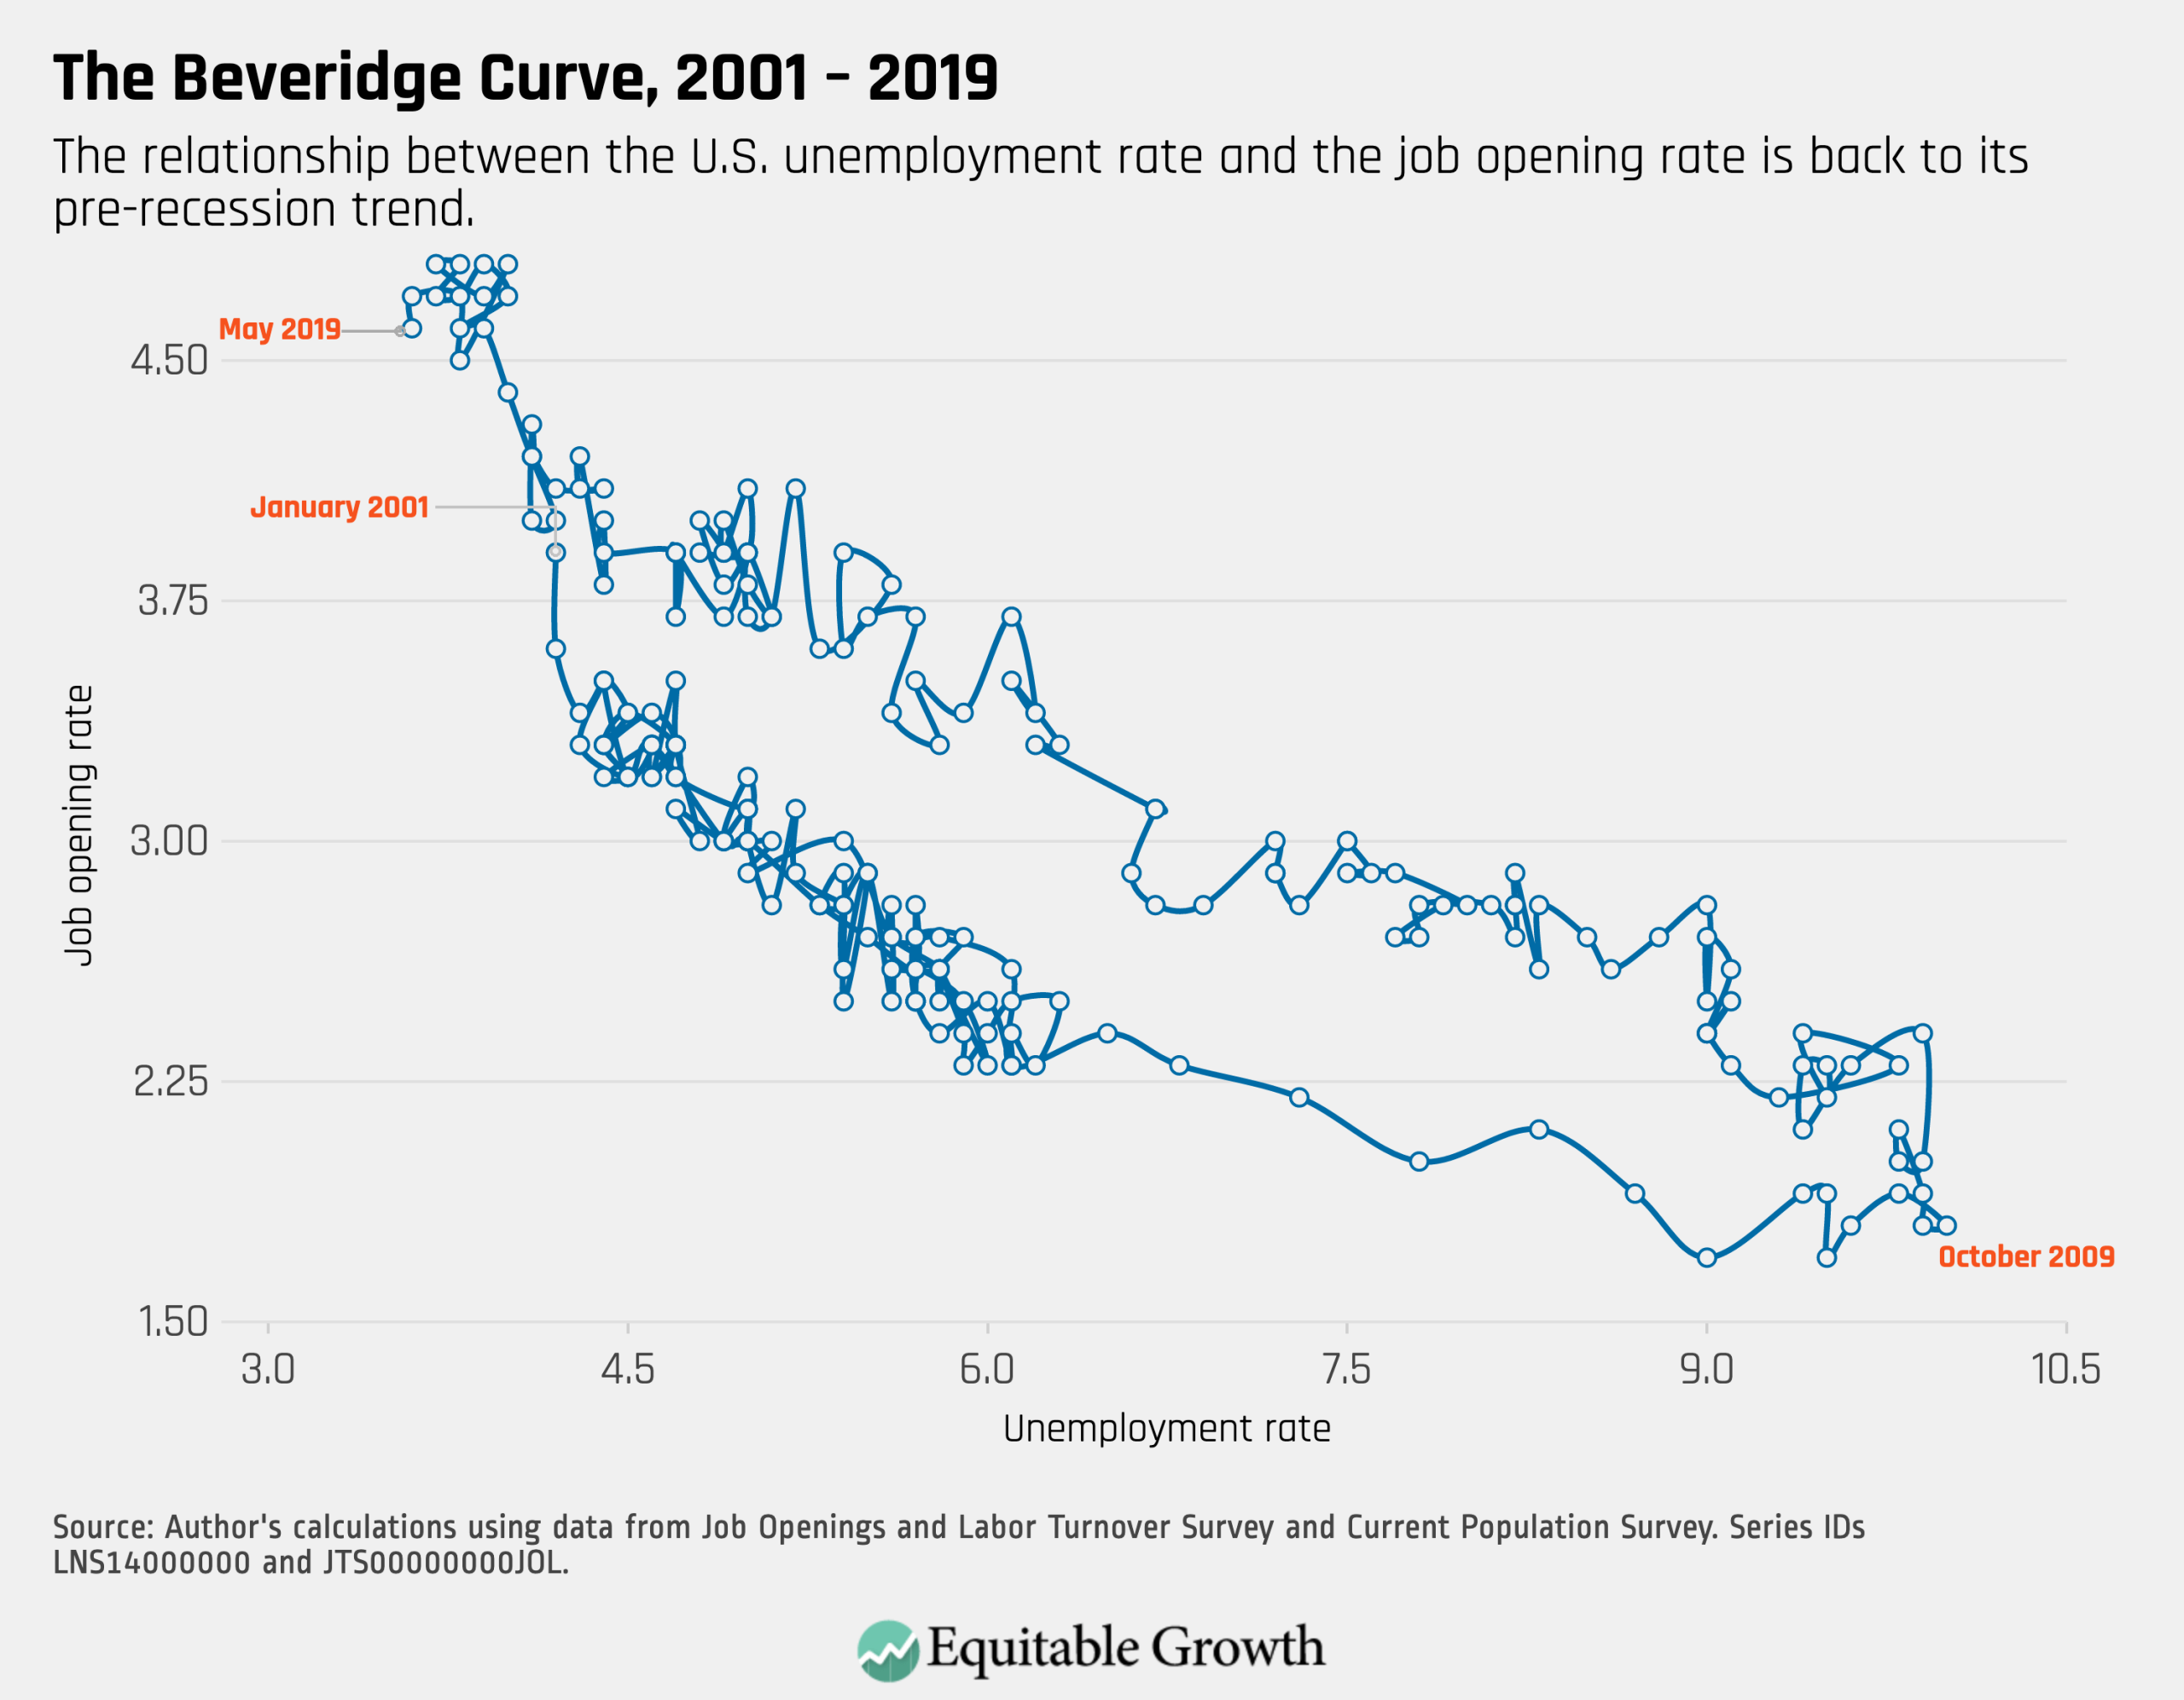
The U.S. Bureau of Labor Statistics earlier this week released the newest data from the Job Openings and Labor Turnover Survey covering the month of May. Kate Bahn and I put together four graphs (opens in a new tab) utilizing JOLTS data.
In the latest installment of Equitable Growth’s In Conversation series, Equitable Growth President and CEO Heather Boushey speaks with economist Leemore Dafny, the Bruce V. Rauner Professor of Business Administration at the Harvard Business School and the Kennedy School of Government. They discussed health insurance exchanges established under the Affordable Care Act and how antitrust enforcement in the health insurance industry can regulate mergers, preventing rising costs and limiting potential harm to consumers.
Heather Boushey dives into the role economist Arthur Laffer, who was recently awarded the Presidential Medal of Freedom, played in promoting supply-side economics. Laffer introduced the country to the idea that tax cuts would lead to such large-scale investments and economic growth that in the end, they basically would pay for themselves. However, this theory is not supported by credible research or evidence, as Boushey points out.
Austin Clemens reports that new estimates of U.S. economic growth released by the University of California, Berkeley’s Gabriel Zucman and Emmanuel Saez tell us, for the first time, how growth was distributed in the United States between wealthy and low-income households in 2015 and 2016. Low-income households in the lowest quintile of income-earners suffered an especially poor year in 2016 and saw their incomes decline by more than 3 percent as a group. While the share of total economic income held by the top 10 percent dropped slightly between 2014 and 2016, from 39.2 percent to 38.4 percent, it still maintains a disproportionately large share of economic growth.
Brad DeLong compiles his most recent worthy reads on equitable growth over the past two weeks (opens in a new tab), both from Equitable Growth staffers and outside press and academics.
This month marks a record-breaking stretch of economic expansion, as the U.S. economy has experienced 121 months of continuous growth. Hispanic women between the ages of 25 and 54 saw employment rates increase by 2.2 percentage points since 2007, while African American women saw a growth of 1.6 percentage points within the same time frame. While this growth is encouraging, the aggregate growth has been concentrated among the wealthiest Americans, who happen to be white men. [nyt (opens in a new tab)]
This week, the Trump administration ended its fight to add a citizenship question to the 2020 Census. Critics argued that adding such a question would result in massive underreporting among permanent residents and visa-holders, who may be fearful of ICE targeting them for their immigration status. The administration still wants to collect citizenship data and, as such, President Donald Trump issued an executive order mandating the U.S. Department of Commerce to obtain citizenship data through other means. [cnn (opens in a new tab)]
This week, the Congressional Budget Office estimated that raising the federal minimum wage to $15 would lift the incomes of 27.3 million workers but eventually lead to 1.3 million lost jobs. Andrew Van Dam reports that while the CBO report headline credits a $15 minimum wage to the tremendous potential job loss, the estimates actually say that an increased minimum wage can result in a range of no major job loss up to 1.3 million jobs lost. Economic Policy Institute economist and former Equitable Growth economist Ben Zipperer said that the low-job-loss scenario indicates that raising the minimum wage may not be as dangerous as academics once thought. [wapo (opens in a new tab)]
The Trump administration recently dropped their plan to limit industry rebates that pharmaceutical manufacturers give to pharmacy benefit managers, or PBMs, in Medicare. This plan would have restricted the deals made between pharma and the PBMs for Medicare and Medicaid plans, thus preventing the PBMs from taking a large profit at the expense of America’s most vulnerable patients. [wsj (opens in a new tab)]
Earlier this week, a federal judge blocked a Trump administration proposal that would require pharmaceutical companies to reveal the sticker prices of their prescription drugs on TV ads if the price is above $35. Transparency of drug pricing would heavily benefit older patients, who often struggle to obtain accurate information of their medical costs. However, many drugmakers sued the Trump administration for violating their free speech rights, and in the end, the judge ruled in their favor. [npr (opens in a new tab)]
Essays SEP 8, 2026
By: Alexander Bick, Adam Blandin, David Deming, Tyler Schumacher

Essays SEP 2, 2026
By: Megan Rivera

Essays AUG 31, 2026
By: Christopher Bangert-Drowns
Get updates on our latest research, event announcements, and policy insights delivered straight to your inbox. Stay connected with the leading voices on equitable growth.


